

Abstract
Variation among individuals arises in part from differences in DNA sequences, but the genetic basis for variation in most traits, including common diseases, remains only partly understood. Many DNA variants influence phenotypes by altering the expression level of one or multiple genes. The effects of such variants can be detected as expression quantitative trait loci (eQTL) 1. Traditional eQTL mapping requires large-scale genotype and gene expression data for each individual in the study sample, which limits sample sizes to hundreds of individuals in both humans and model organisms and reduces statistical power 2–6. Consequently, many eQTL are likely missed, especially those with smaller effects 7. Further, most studies use mRNA rather than protein abundance as the measure of gene expression. Studies that have used mass-spectrometry proteomics 8–13 reported surprising differences between eQTL and protein QTL (pQTL) for the same genes 9,10, but these studies have been even more limited in scope. Here, we introduce a powerful method for identifying genetic loci that influence protein expression in the yeast Saccharomyes cerevisiae. We measure single-cell protein abundance through the use of green-fluorescent-protein tags in very large populations of genetically variable cells, and use pooled sequencing to compare allele frequencies across the genome in thousands of individuals with high vs. low protein abundance. We applied this method to 160 genes and detected many more loci per gene than previous studies. We also observed closer correspondence between loci that influence protein abundance and loci that influence mRNA abundance of a given gene. Most loci cluster at hotspot locations that influence multiple proteins—in some cases, more than half of those examined. The variants that underlie these hotspots have profound effects on the gene regulatory network and provide insights into genetic variation in cell physiology between yeast strains.
We developed a method for detecting genetic influences on protein levels in large populations of genetically distinct individual yeast cells (Extended Data Figure 1). The method leverages extreme QTL mapping (X-QTL), a bulk segregant QTL mapping strategy with high statistical power 14. We quantified protein abundance by measuring levels of green fluorescent protein (GFP) inserted in-frame downstream of a given gene of interest. The GFP tag allows protein abundance to be rapidly and accurately measured in millions of live, single cells by fluorescence-activated cell sorting (FACS). To apply the method to many genes, we took advantage of the yeast GFP collection 15, in which over 4,000 strains each contain a different gene tagged with GFP in a common genetic background (BY). For each gene under study, we crossed the GFP strain to a genetically divergent vineyard strain (RM) and generated a large pool of haploid GFP-positive offspring (segregants) of the same mating type. Across the genome, each segregant inherits either the BY or the RM allele at each locus, some of which influence the given gene’s protein level. We took a starting population of over 500,000 segregants and used FACS to collect 10,000 cells each from the high and low tails of GFP levels (Extended Data Figure 2A). Such selection of phenotypically extreme individuals from a large population provides high power to detect loci with small effects 14. We extracted DNA in bulk from these extreme populations, sequenced it to ~34 fold coverage, and used an analysis method that combines information across linked SNPs to accurately estimate allele frequencies from this depth of coverage 16. We detected loci that influence protein abundance as genomic regions where the high and low GFP pools differ in the frequency of the parental alleles (Extended Data Figure 3). We denote these loci “extreme protein QTL” or X-pQTL.
We applied our method to 174 abundantly expressed genes, 140 of which were chosen based on previous eQTL and pQTL results, while 34 were selected at random. False discovery rates were determined using control experiments in which two cell populations were collected at random with respect to GFP level and compared as described above (Extended Data Figure 2B). High-quality results were obtained for 160 genes (Supplementary Data 1 contains details on the genes, including exclusion criteria). Across these 160 genes, we identified 1,025 X-pQTL at a false discovery rate of 0.7%. The median genomic region spanned by these loci was 68 kb (Supplementary Data 2). The resulting X-pQTL were highly reproducible as gauged by biological and technical replicates (Supplementary Note 1, Supplementary Table 1 & Extended Data Figure 4). The number of X-pQTL per gene ranged from 0 to 25, with a median of five. We compared these numbers to eQTL and pQTL results based on published mRNA and mass-spectrometry protein data on ~100 segregants from a cross between the same BY and RM strains we study here 2,12. 85 genes were assayed in all three data sets; for these genes, we observed a mean of 1.2 eQTL, 0.6 pQTL, and 7.2 X-pQTL (Figure 1). Our method increased detection of loci that influence protein levels by an average of 1,100%, as compared to a 15% increase recently reported through improvements in mass spectrometry 17. Interestingly, the distribution of detected loci per gene approaches that previously predicted to underlie gene expression variation in this yeast cross 7, indicating that the higher power of the method enabled discovery of loci with small effects that escaped detection in previous studies. Our detection of multiple X-pQTL per gene directly demonstrates considerable genetic complexity in protein expression variation.
Figure 1. Distant and local variation affects protein levels.

Histogram showing the number of loci per gene among 85 genes with X-pQTL, eQTL and pQTL data.
By design, all cells in the experiments described above inherit the GFP-tagged gene of interest, and the surrounding local region of the genome, from the BY strain. Therefore, the detected X-pQTL are distant from the gene of interest, and likely influence gene expression in trans. Previous studies have shown that mRNA levels of many genes are influenced by genetic variants in or near the gene itself (local eQTL), the majority of which influence gene expression in cis 1. In contrast, local pQTL were reported to be rare based on mass spectrometry data 8,9. We investigated local X-pQTL by generating GFP-tagged strains for 41 genes in the RM genetic background, and repeating the crosses so that both parent strains carried GFP-tagged alleles, which then segregated among the progeny. We detected local X-pQTL at genome-wide significance for 20 genes (49%, Extended Data Figure 5), and several additional genes would pass a more relaxed local significance threshold (Supplementary Table 2). Thus, local genetic variation affects protein levels for at least half of the genes we tested, in contrast to earlier observations 8,9 but in line with more recent work 11,13.
The genetic basis of mRNA variation has previously been reported to be surprisingly different from that of protein variation 8–10. For example, based on published microarray 2 and mass-spectrometry data 12 for genes also present in our current study, only 23% of the eQTL had a corresponding pQTL. By contrast, we observed that 60% of the distant eQTL had a corresponding X-pQTL whereas only 5% were expected by chance (randomization test, p < 0.01). The direction of QTL effect (i.e. whether higher expression is associated with the BY or the RM allele) agreed for 92% of these shared loci (randomization test p < 0.01). The local eQTL showed similar concurrence (13 of 21 local eQTL, or 62%, had a corresponding X-pQTL), with slightly lower directional agreement (77%). Thus, in line with recent results for strong local eQTL in yeast 13, at least half of both local and distant loci with effects on mRNA levels also influence protein levels. The fraction of pQTL with a corresponding X-pQTL was similar to that for eQTL (46% vs. 60%; chi-squared test: χ2 = 1.1, p = 0.3).
We next asked whether the many new X-pQTL discovered here (i.e., those without a corresponding significant eQTL) are best explained by posttranscriptional effects or by mRNA differences that are too small to be detected at genome-wide significance thresholds. In support of the latter hypothesis, we found that X-pQTL that correspond to significant eQTL have larger effects than those that do not (Wilcoxon rank test, p = 6e-11, Extended Data Figure 6). Further, at X-pQTL without a significant eQTL the direction of allelic effect nevertheless agreed with that in the mRNA data 66% of the time (randomization test, p < 0.01). These results are consistent with the existence of many undetected weak-effect eQTL (Supplementary Note 2 and Extended Data Figure 7), but larger studies of mRNA levels are needed to confirm this. We did observe some clear differences between X-pQTL and eQTL. For 21 of 109 significant distant eQTL (19%), we saw no evidence for a corresponding X-pQTL, even at low statistical stringency (LOD < 1). Five genes with strong local eQTL also showed no evidence for a local X-pQTL; conversely, four genes with a local X-pQTL had no corresponding eQTL (Extended Data Table 1). These cases may represent influences of genetic variation on posttranscriptional processes.
Distant eQTL in yeast, as well as in other species, are not randomly distributed throughout the genome, but instead cluster at “hotspot” loci that influence the expression of many genes 3,5,18. We observed such clustering of X-pQTL at 20 genome locations, each of which overlapped more X-pQTL (≥12) than expected by chance (Extended Data Table 2). The majority of all detected distant X-pQTL (69%) fell within a hotspot. Remarkably, these 20 X-pQTL hotspots captured nearly all of the mRNA hotspots identified in the eQTL data for the same cross 2 (Figure 2 & Extended Data Table 2). In contrast, many eQTL hotspots did not correspond to a mass-spectrometry based pQTL hotspot 9,12.
Figure 2. X-pQTL hotspots.
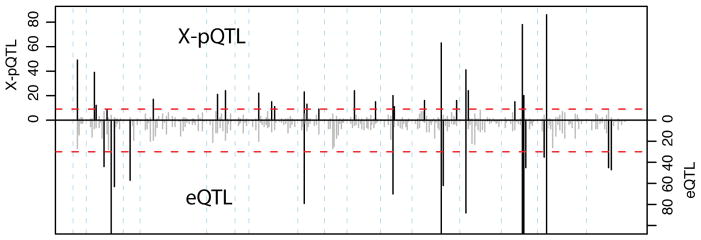
Number of X-pQTL (top) vs. eQTL (bottom, inverted scale) in 20cM bins along the genome. The red dashed lines correspond to the expectation if QTL were distributed randomly. Bins where the QTL count exceeds this threshold are shown in black, others in grey. Note that the eQTL axis is truncated to permit easier visual comparison. The eQTL hotspot glu1 2 (Extended Data Table 2) narrowly failed the permutation threshold in our re-analysis. The eQTL hotspots on chromosomes II and III (glu3, glu4, glu5) correspond to polymorphisms that do not segregate in our strains.
The X-pQTL hotspots had widespread effects on protein levels. The median fraction of genes a hotspot affected was 27% of the 160 genes tested, and two of the hotspots each affected more than half of the genes (Extended Data Table 2). The magnitude and direction of expression changes differed considerably among the genes influenced by a given hotspot (Figure 3A). Together, these observations are best explained by hotspots shaping the proteome in a hierarchical manner. Proteins with the largest abundance changes are likely to be closely related in biological function to the gene whose alleles underlie a hotspot. Abundance of more distantly connected proteins may be more weakly perturbed through mechanisms that influence the overall physiological state of the cell 19. The consequences of some genetic differences may thus reverberate through much of the cell. We illustrate these ideas with a closer look at three of the hotspots.
Figure 3. Hotspot effects.

A. Distribution of hotspot effects. Red (blue): higher (lower) expression associated with the BY allele. Darker dots: significant X-pQTL. Boxplots show the median (central line), central quartiles (boxes), and data extremes (whiskers).
B & C. Effects of the HAP1 and HAP4 hotspots sorted by effect size. Green triangles: direct transcriptional targets of HAP1 or HAP4. Filled triangles: significant X-pQTL.
D. Correlation of hotspot effects with expression changes triggered by glucose response. Red circles: genes significantly regulated by the hotspot.
E. Effects of the chromosome II hotspot at position 132,948. Green triangles: genes with ribosomal and translation-related functions (Supplementary Table 3).
The hotspot at ~239 kb on chromosome XII influences the expression of nearly half the genes in our set (Figure 3B). It contains the gene HAP1, a transcriptional activator of genes involved in cellular respiration 20. In BY, transcriptional activation by HAP1 is reduced due to a transposon insertion, while HAP1 function is intact in RM 18,21. Of the nine genes in our dataset that are under direct transcriptional control by HAP1 22, seven were regulated by this hotspot (YHB1, ACS2, CYC1, ERG10, OLE1, ADO1, and PDR16), more than expected by chance (Fisher’s Exact Test (FET) p = 0.02). Further, these seven direct HAP1 targets all had reduced expression in the presence of the BY allele of HAP1, and they were more strongly influenced by the hotspot than the other genes linking here (Wilcoxon Test p = 0.002, Figure 3C). Similarly, the hotspot on chromosome XI contains the gene HAP4, which encodes a component of the Hap2/3/4/5 complex, an activator of respiratory gene expression with different target genes than HAP1 23. Direct transcriptional targets of this complex 22 are enriched among the genes influenced by this hotspot in our data (5 / 6 genes, p = 0.0003), and these target genes were more strongly affected than other genes (Wilcoxon Test, p = 0.02). Notably, the BY allele was associated with lower expression at all these HAP4 targets (Figure 3C). Thus, variation at both HAP1 and HAP4 regulates direct targets involved in cellular respiration. In both cases, the RM allele is associated with a more respiratory cellular state 19, likely resulting in the weaker expression changes for the many other genes affected by these hotspots.
The hotspot on chromosome XV regulates the largest fraction of genes in our dataset (Extended Data Table 2). We previously showed that variation in the gene IRA2 underlies the corresponding eQTL hotspot 2. IRA2 is an inhibitor of the Ras/PKA signaling pathway, which regulates a wide variety of processes, including the cellular response to glucose 24. Addition of glucose to yeast growing on non-fermentable carbon sources results in expression changes at > 40% of all genes 24, and the majority of these changes are mediated through the Ras/PKA pathway 25. The BY allele of IRA2 is less active than the RM allele 2, and is therefore expected to be associated with higher Ras/PKA activity 19. Indeed, the effects of this hotspot on protein levels are correlated with the mRNA expression changes induced by glucose addition 25 (Spearman rank correlation rho = 0.68, p < 2e-16, Figure 3D). The BY allele thus mimics stronger glucose signaling 19 even though glucose levels are constant and identical for all cells in our experiments. Interestingly, activation of respiratory genes by HAP1 and HAP4 is a branch of glucose signaling that is independent of Ras/PKA activity 25. Thus, the BY laboratory strain differs from the wild RM strain in at least three key components of glucose sensing.
The hotspot effects often overlap for individual proteins. For example, the three hotspots described above jointly regulate a set of eleven genes in our dataset (Extended Data Figure 8). The three BY alleles all reduced expression of five of these proteins. Interestingly, these five genes (ATP14, ATP17, ATP2, CIT1, MDH1; Extended Data Figure 8) are all involved in aerobic respiration, while the remaining six genes are not. The BY strain grows better than wild strains on glucose-rich media that favor fermentation over respiration 26,27. Consistent direction of eQTL effects for genes in a pathway can be interpreted as evidence for adaptive evolution 28. Thus, the HAP1, HAP4 and IRA2 hotspots may represent adaptations of BY to the glucose-rich culture conditions commonly used in the laboratory 29.
Ten X-pQTL hotspots did not have corresponding eQTL hotspots. They may arise from eQTL with effects below the detection limit of the earlier studies, or from variants that influence protein levels via posttranscriptional mechanisms. For example, the locus centered at 132,948 bp on chromosome II regulated about a third of genes in our dataset; the largest fraction among the 10 novel hotspots (Extended Data Table 2). The BY allele increased expression of multiple ribosomal proteins and translation factors, suggesting that this hotspot regulates the abundance of ribosomes (Figure 3E & Supplementary Table 3). Interestingly, none of the ribosomal genes whose protein levels mapped to this hotspot had an eQTL at this locus, suggesting that it may influence ribosome abundance via posttranscriptional processes 30.
We developed a powerful method to detect genetic variants affecting protein levels and used it to uncover substantial complexity in gene expression regulation. Our findings imply that many more eQTL and pQTL will be discovered in studies with larger sample sizes in other species. Our approach can be readily extended to any situation in which segregating cells can be subjected to fluorescent labeling and sorting.
Methods
Yeast Strains
We used strains from the yeast GFP collection 15 with genotype
MATa his3Δ1 leu2Δ0 met15Δ0 ura3Δ0 GOI::GFP-HIS5
where GOI::GFP signifies a carboxyterminal, in-frame insertion of the GFP gene to a gene of interest (GOI) 31. All strains in the GFP collection have the same “BY” genetic background, a common laboratory strain. We crossed the GFP strains to one strain (“YLK2463”) of the RM genetic background:
MATα can1Δ::STE2pr-URA3-mCherry-KanMX his3Δ1::ClonNAT leu2Δ0 ura3Δ0 ho::HYG AMN1BY
YLK2463 carries the synthetic genetic array marker STE2pr-URA3 32 at the can1 locus that, in the presence of canavanine and the absence of uracil in the media, allows only cells of the ‘a’ mating type to grow, permitting the rapid generation of large and stable segregant populations. The SGA marker was kindly provided by the laboratory of Charles Boone. We modified the SGA marker by adding a mCherry gene fused to the URA3 gene. Consequently, mCherry abundance is a measure of the expression of the SGA marker, permitting verification of successful selection of segregants. The BY strains and YLK2463 share the auxotrophies his3Δ1, leu2Δ0 and ura3Δ0 (but not met15Δ0) and carry identical alleles of the AMN1 gene. Some of the strong trans eQTL identified in earlier mapping studies 2,7,18 were caused by engineered gene deletions (leu2Δ0 and ura3Δ0) and by polymorphism at AMN1. Because these loci do not differ between our parent strains, the corresponding QTL do not occur in our experiments.
Gene selection
We selected 174 genes for X-pQTL mapping from the ~4,000 genes represented in the GFP library (see Supplementary Data 1 for full information). Of these, 34 genes were selected at random, and the remaining 140 genes were selected based on earlier eQTL and pQTL data, to ensure that both genes with concurrent eQTL and pQTL, as well discordant cases were represented in our dataset. Most genes (146) in our dataset were selected to have high annotated GFP abundance > 300 in SD media 33. 160 genes were represented in the Smith et al. eQTL dataset 2, and 102 genes were represented in the Khan et al. pQTL dataset 12. Among the 174 genes, 37 had a local eQTL, nine had a local pQTL, 101 had at least one distant eQTL and 30 genes had at least one distant pQTL. The genes in our dataset had an average of 1.12 eQTL, while those not in our dataset had an average of 0.91 eQTL. While this difference is significant (Wilcoxon Rank Test, p = 0.0004), given the small magnitude of the difference it seems likely that the genes in our dataset are generally representative of other genes in terms of the number of QTL affecting their expression. In support of this notion, there was no difference in the number of mass-spectrometry pQTL between the genes in our dataset (average = 0.59 pQTL) and the other genes (0.52 pQTL; p = 0.3).
In this paper, we present data from 160 of these 174 genes. The remaining genes were excluded due to poor growth of the GFP-tagged strain leading to either no useable data, or to insufficient sequencing data. For five genes, we replaced failed “trans” experiments with those from the “local” experiments (s. below). Two of these five genes had local X-pQTL. The inclusion of these two local loci in the 1,025 X-pQTL discussed in the paper does not alter our conclusions. All details on gene selection and exclusion criteria are given in Supplementary Data 1.
Generation of pools of segregant offspring
For each cross, YLK2463 and the corresponding BY strain from the GFP collection were mated and diploids selected on YNB + Leu + Ura + Hygromycin plates. Diploid cultures were sporulated for ~7 days in 5ml Spo++ media. Spores were plated on YNB + Leu + Met + Canavanine plates. The presence of canavanine and the absence of uracil select for both the deletion of CAN1 by the SGA marker and for cells of the ‘a’ mating type (i.e. the BY allele in our cross). The absence of histidine selected for the presence of the GFP cassette, ensuring that all surviving segregants carry the fluorescently labeled allele of the gene of interest. Segregants were harvested after two days, and glycerol stocks frozen at −80°C. Successful selection of MAT a cells that carry both GFP and the active magic marker was verified during FACS sorting by the presence of both GFP and mCherry signal.
For the local pQTL experiments, both parent strains are histidine prototroph and therefore diploids cannot be selected for chemically. Instead, diploids were manually picked from freshly mated cultures using a yeast tetrad dissection scope (MSM System from Singer Instruments, Somerset, UK).
Fluorescence-activated cell sorting
Segregant libraries were thawed and grown for ~12 h in 5 ml of selective media (YNB + Leu + Met + Canavanine) to early-mid log phase. Cells were directly FACS sorted from and into culture media, with no intermediate exposure to nutrient-free buffers. FACS sorts were performed on a BD FACSVantage SE w/DiVa instrument (BD Biosciences, Franklin Lakes, NJ, USA). For each experiment, 10,000 cells were collected from the populations with the 1–2% highest and lowest GFP signal respectively, while controlling for cell size as measured by forward scatter (Extended Data Figure 2A). The sort gates were set based on measurements of 50,000 cells prior to sorting. We typically measured 600 – 700k cells to obtain the two extreme populations of 10k cells each. All isolated populations were grown for ~30 h in liquid YNB Leu + Met + Canavanine media and frozen at −80 °C as glycerol stocks. For all downstream procedures, the high and low populations were treated identically, and processed at the same time.
Empirical estimates of the false discovery rate
In QTL mapping studies involving individual segregants, the false discovery rate (FDR) is typically determined by permuting phenotypes relative to genotype data. This is not possible in X-QTL as in this approach, the genotypes of individual segregants are not known. Instead, we determined the distribution of random allele frequency fluctuations that can occur without selection on GFP levels. We grew two replicates each of segregant pools for 10 genes and one replicate for one additional gene, for a total of 21 experiments. In each experiment, we selected two populations of 10,000 cells in the same cell size range as for the GFP sorts, but without gating on GFP abundance (Extended Data Figure 2B). The resulting 21 pairs of 10,000 cells were then processed and sequenced exactly as described for high / low GFP populations. We applied our peak calling pipeline (s. below) to the data from these 21 experiments and determined the number of loci that would be called significant at a range of thresholds. We set the genome-wide threshold of LOD = 4.5 for further analyses to the highest LOD score (when incrementing in steps of 0.1 LOD) where we see one QTL across the 21 “null” experiments.
DNA library preparation and sequencing
High and low pools were thawed and about 30% grown for ~12 h in YNB + Leu + Met + Canavanine. DNA was extracted using the Quiagen DNEasy system. Indexed, paired-end Illumina libraries were constructed from 25 ng of genomic DNA, using a modification of the Epicentre Nextera 34 protocol using 20× diluted tagmentation enzyme 35 and 11 cycles of post-tagmentation PCR. We used a set of 96 custom Nextera-compatible adaptor primers that contain index sequences described in 36. Up to 96 indexed samples (corresponding to 48 pairs of high and low GFP pools) were pooled to equal molarity and size selected on agarose gels to 400 – 500bp length. Sequencing was performed on an Illumina HiSeq 2000 instrument (Illumina Inc, San Diego, CA, USA), using a read length of 100 bp, with some library pools sequenced as single end and others as paired end. Sequencing depth ranged from 15× – 68× coverage of the whole genome, with a median of 34×. Raw sequencing reads are available upon request.
Measuring allele frequencies by massively parallel short-read sequencing
BY and RM differ at ~0.5% of nucleotides, corresponding to ~ 45,000 single nucleotide variants (SNPs) that can serve as dense genetic markers in QTL mapping experiments 14,35. A challenge for accurate estimation of allele frequencies is mapping bias, i.e. a systematic tendency for sequencing reads corresponding to the reference strain to map better than reads that contain alleles from a non-reference strain. Mapping bias is of particular concern in our experiments because the yeast reference genome was generated from one of our strains (BY). We initially noted clear evidence of reference bias in our data, even though our reads were comparably long. We therefore took several steps to eliminate mapping bias.
First, we compiled a catalogue of high-quality SNPs from Illumina genomic sequence data of the BY and the RM strain 35. Second, we restricted this catalogue to SNPs that can be unambiguously aligned to RM by making use of the high quality RM reference genome that is available from the Broad Institute (http://www.broadinstitute.org/annotation/genome/saccharomyces_cerevisiae.3/Info.html). For each SNP, we extracted 30 bp up- and downstream sequence from the BY reference, and set the SNP position itself to the RM allele. We aligned the resulting 61 bp fragments (as well as their reverse complement) to the RM genome using BWA 37. We kept only SNPs where both the forward and the reverse “read” aligned uniquely to RM, resulting in a set of 38,430 SNPs. Third, we aligned the reads from each experiment to both the BY and the RM reference using BWA 37. At each SNP, we kept only reads that mapped uniquely and without mismatches. Thus, reads that span a SNP were only retained when mapped to the strain reference from which they originated. While we acknowledge that this procedure removes reads with sequencing errors, we found that the corresponding loss in sequence coverage was justified by the improved accuracy of allele frequency estimates. Finally, we removed likely PCR duplicates using a python script kindly provided by Martin Kircher, and estimated allele frequencies by counting at each SNP the number of reads that matched the BY or the RM references. Together, these procedures resulted in dense, accurate allele frequency estimates across the entire yeast genome.
Allele count data is available as Supplementary Dataset 1.
Analyses of count data and QTL detection
Unless otherwise specified, all statistical analyses were performed in the R programming environment (www.r-project.org). At each SNP, we calculated two statistics to describe the allele frequency distribution in the pools. First, we simply calculated the fraction of reads with the BY allele in each pool and subtracted these frequencies in the low GFP tail from those in the high GFP tail (“allele frequency difference”). Second, we calculated the p-value from a G-test comparing the number of BY vs. RM counts in the high to those in the low GFP tail. Because these two SNP-wise statistics can be highly variable at neighboring SNPs due to random sampling, we performed loess-smoothing along the chromosomes for plotting results for single genes.
For X-pQTL detection, we used the MULTIPOOL software 16. MULTIPOOL fits a graphical model to each chromosome that takes into account both linkage and variation in sequence coverage. MULTIPOOL reports a LOD score from a likelihood ratio test comparing a model with and a model without a QTL at the given position. MULTIPOOL was run in “contrast” mode, and with the following parameters: base pairs per centiMorgan (-c parameter) = 2200, bin size (-r) = 100. The pool size (-n) was set to 1,000 rather than 10,000 to allow for the fact that not all collected cells will survive. We noticed that MULTIPOOL can be highly sensitive to SNPs that are fixed or nearly fixed for one of the parental alleles. At these positions, MULTIPOOL sometimes produces very sharp peaks in the LOD curve that spike at single SNPs. We therefore removed SNPs with a BY allele frequency > 0.9 or < 0.1 prior to running MULTIPOOL. The resulting LOD curves robustly detect peaks, and are free from any single-SNP artifacts.
We used the empirical null sorts to set the genome-wide threshold for peak detection at a LOD ≥ 4.5 (s above). Within each QTL, we considered the position of the highest LOD score, and defined confidence intervals as the 2-LOD drop interval around this peak. For a given LOD threshold, false discovery rates were estimated as
[# QTL in the 21 null sorts * (# experiments/21)] / # QTL
Finally, as a measure of the effect size of an X-pQTL, we used the loess-smoothed allele frequency difference between the high and the low GFP population.
Measuring library purity from sequence data
To ensure that each of our experiments targeted the intended gene of interest, and were free from cross-experiment or cross-library contamination, we made use of the fact that deep sequence data allows direct detection of the gene in an experiment that are tagged by the GFP cassette. We created a reference fasta file with two sequences for each gene as follows. First, we added the terminal 75 bp of the gene’s ORF sequence immediately upstream of (but excluding) the stop codon to the first 75 bp of the GFP cassette. Second, we added the last 75 bp of the cassette to the 75 bp of genomic sequence immediately downstream of the stop codon. The cassette sequence was obtained from http://yeastgfp.yeastgenome.org. The length of the sequences were chosen such that a 100 bp read can only map to them if it contains the point of insertion of the GFP cassette.
We mapped all reads to this fusion reference, treating paired reads as single reads (because if two paired reads are mapped as such, only one of them can perfectly cover the insertion site, while the second read is not informative in this context). We used the samtools idx tool to count the number of reads that mapped to each fusion sequence, allowing direct identification of the tagged gene and quantification of any off-target reads.
With a few exceptions (discussed below), all experiments reported here were > 90% pure for the gene of interest in both the high and the low GFP pool. Off-target reads typically corresponded to other genes in the study, suggesting that they may be due to either low levels of cross-contamination during library preparation in 96 well format, or incorrectly sequenced indeces.
We noticed two clear outliers in terms of estimated purity. First, the pools for gene YDR343C (HXT6) had 50–60% of reads mapping to the gene YDR342C (HXT7). These two genes are close paralogs, and both the ends of their ORFs and their downstream sequence are virtually identical, suggesting that the apparent contamination is in fact due to reads randomly mapping to either of the two genes. Second, the pools for the gene YGR192C (TDH3) appeared to be ~20 – 25% contaminated by the gene YGR009C (TDH2). These two genes are also close paralogues so that the ends of their ORFs used in our fusion library are identical, but have different downstream sequences. Off-target reads are therefore expected at 25% of reads for YGR192C. We retained both YDR343C and YGR192C in our analyses.
The remaining genes with apparent contamination have low absolute numbers of reads overlapping the cassette fusions so that a single off-target read has a disproportionate effect on the purity estimate. The one exception is YBR158W (AMN1), where 7 out of 68 fusion reads in the high GFP tail mapped to the gene YIL043C (CBR1), which is not a paralog of YBR158W. We removed YBR158 from all further analyses.
Detecting local X-pQTL
In the experiments described so far, all segregants carry the GFP cassette only at the BY allele of the gene of interest, so that we can detect only distant X-QTL. To test the effect of local variation on a given gene, we engineered the corresponding GFP cassette into our RM strain YLK2463. The GFP cassette along with the HIS5 gene was amplified from genomic DNA extracted from the respective GFP collection strain using primers designed using sequences available at http://yeastgfp.yeastgenome.org/yeastGFPOligoSequence.txt. YLK2463 was transformed with the PCR product and transformants selected on HIS-media following standard yeast protocols. Successful integration at the carboxyterminal end of the target gene was verified using colony PCR with primers described in 31. Because the alleles from both parents are now tagged with GFP, these experiments allow the detection of local X-QTL. We mapped X-pQTL as described above.
We selected 55 genes to be included in the “local” experiments based on whether or not they had a local eQTL or pQTL 2,12 and whether or not they showed allele-specific expression in RNASeq experiments (Albert et al. unpublished, Torabi et al. unpublished). All 55 genes were also included in the 174 “distant” experiments described above (Supplementary Data 1). We excluded seven “local” experiments due to low growth or insufficient sequencing data. The “distant” experiments were FACS sorted and further processed at the same time as the “local” experiments, allowing direct comparison of the results.
To ensure that the GFP cassette is intact after transformation, we analyzed alignments from the high and low GFP populations against the GFP gene sequence. We detected several GFP mutations that were in common between the RM strain and the donor GFP from the corresponding BY strain and that were therefore already present in the GFP collection strains. At five genes, the RM strain carried silent mutations that were not found in the BY strain; these are unlikely to cause false positive local X-pQTL and the genes were retained in our analyses. We excluded six genes with nonsynonymous mutations present only in the RM allele where the RM allele was associated with lower GFP fluorescence. For three genes, we noted non-synonymous mutations in the RM GFP sequence where the RM allele associated with higher fluorescence. Because a fortuitous mutation in the GFP ORF is unlikely to increase GFP fluorescence, it is unlikely that the mutations alter the GFP signal in these three cases. These three genes were therefore retained in the analyses. Two of these three genes (YKL029C and YNL061W) had a local X-pQTL with concordant expression direction to a local eQTL, while the third gene (YBR067C) had a local X-pQTL and no data available in the eQTL dataset. Finally, we excluded one gene where the GFP cassette had no mutations, but where several sequencing reads spanned the end of the ORF without being interrupted by the GFP cassette, suggesting that not all segregants may have inherited a GFP-tagged allele. Supplementary Data 1 details all gene exclusions.
In the paper, we present data for the 41 genes with high quality data. 21 of these genes (55%) have a local eQTL, as compared with 21% of all genes with eQTL data. Matched trans data was available for 37 of these genes. A local X-pQTL is called if the LOD score at the midpoint of the gene exceeds a given threshold (e.g. LOD > 4.5 for genome-wide significance). Because genome-wide significance is conservative when assaying only a single position in the genome as for local X-pQTL, we also used a more relaxed local significance threshold. This threshold was set to the maximum LOD score at the gene position in the “null” experiments described above (LOD = 0.8).
eQTL mapping from published datasets
We obtained genome-wide microarray based gene expression measures from Smith & Kruglyak 2, as well as mass-spectrometry based protein quantifications from Khan et al. 12. Because these data were measured in the same set of ~100 segregants (albeit at different points in time and therefore from separate cultures), we can analyze them in an identical fashion using the available set of genotypes for these segregants 2. We performed nonparametric linkage mapping using R/QTL 38 for each gene, and called QTL at a threshold of LOD = 3, with confidence intervals defined as the 2-LOD drop from the peak position. We note that this is not a stringent cutoff in an eQTL experiment where multiple traits are mapped. However, because we compare these peaks to those from our X-QTL approach (which are controlled for multiple testing using an FDR approach), being more permissive here in fact downplays the improvements in QTL detection by our method.
Overlap of eQTL with X-pQTL or pQTL
For each eQTL, we asked if it was located within 44 kb (roughly 20 cM) of an X-pQTL or pQTL for the given gene. In the published eQTL and pQTL datasets, we defined peaks as those loci exceeding a LOD threshold of ≥ 3. We excluded loci that are known to segregate in only one of the datasets: in particular, we removed the following eQTL and pQTL from the published dataset before comparing to the X-pQTL data:
All eQTL on chromosome II (due to polymorphism in the gene AMN1 39; our RM strain carries the BY allele of AMN1 so that this locus cannot influence protein expression in our data)
All eQTL on chromosome III (due to the mating type locus 18 which is identical in all our segregants, or to an engineered auxotrophy in the gene LEU2 18 which was present only in BY in the earlier data, while LEU2 is deleted in both of our parent strains)
All eQTL on the chromosome where the gene itself is located because in our “distant” experiments such local effects cannot be detected
We note that this strategy will remove a small set of loci that are located on excluded chromosomes but do not correspond to the loci specified above. Excluding these loci is unlikely to influence our overall conclusions. When comparing eQTL with mass-spectrometry based pQTL, we retained all loci in the analyses because the segregants used in these two studies are for the most part identical, so that the same loci are expected to be present in both datasets. Further, when comparing eQTL and pQTL we only analyzed genes that are included in the X-pQTL dataset, to avoid any biases related to the gene selection. If all genes shared between Smith et al. 2 and Khan et al. 12 are analyzed, there are 504 eQTL, only 62 of which are also pQTL (12%). Therefore, restricting the overlap analyses to genes present in the X-pQTL dataset leads to a better agreement between the earlier eQTL and pQTL datasets than across all genes, and doing so is conservative for our purposes. The comparisons of eQTL to X-pQTL and of pQTL to X-pQTL are based on all genes present in the given pair-wise comparison.
We further asked if the direction of effect for an X-pQTL agrees with that for an overlapping eQTL. For example, at a given locus, a higher frequency of the BY allele in the high GFP tail compared to the low GFP tail was interpreted as the BY allele increasing protein expression. This measure was compared to the difference in measured mRNA expression between those segregants that inherited the BY vs. those that inherited the RM allele among the ~100 segregants in the published datasets.
To determine significance of the QTL overlap between datasets, we reshuffled the observed QTL positions 100 times across the genome. In these randomizations, each chromosome was sampled with a probability proportional to its length, and the sizes of QTL confidence intervals were kept intact. We performed 100 such randomizations of the QTL positions in the first set (e.g. eQTL) and compared them to the non-randomized QTL of the second set (e.g. X-pQTL). In each randomized dataset, we extracted the fraction of QTL that overlap and compared this distribution to the observed values. We report the overlap expected by chance as the mean of these 100 randomized fractions.
To test if the observed directional agreement between eQTL and X-pQTL exceeded that expected by chance, we performed a second randomization test. While leaving the positions of X-pQTL and their associated allele effects in place (i.e. without redistributing X-pQTL across the genome, and without redistributing the X-pQTL for one gene across different genes), we randomized gene names between these gene-wise sets of X-pQTL. From each of 100 randomized sets, we calculated the number of eQTL that overlapped an X-pQTL, and what fraction of these overlapping QTL have an effect in the same direction. This test is conservative due to the presence of the linkage hotspots: because many genes link here in both the X-pQTL and eQTL data, a high degree of random overlap is expected. Our test asked whether the observed degree of directional agreement exceeds even this high background expectation.
To estimate what fraction of X-pQTL without a corresponding significant eQTL does nevertheless influence mRNA levels, we calculated the π1 statistic 40 on the distribution of p-values testing the allelic effect of these X-pQTL positions in mRNA levels 2. See Supplementary Note 2 for further details.
Clustering of X-QTL into hotspots
To determine if the X-pQTL were non-randomly distributed across the genome, we reshuffled them across the genome. As described above, each chromosome was sampled with a probability proportional to its length, and the sizes of X-pQTL confidence intervals were kept intact. In each set of randomized loci, we counted for each SNP the number of X-pQTL 2-LOD confidence intervals that contained that SNP. The cutoff for “significant” hotspots was set to the median of the 95% quantiles from the 100 randomized sets.
To identify individual hotspots, we extracted continuous stretches of SNPs that match or exceed the empirical cutoff. Stretches of less than six SNPs were excluded. Within each of the remaining stretches, we defined the hotspot position to be the SNP that overlapped the most X-pQTL (defined by 2-LOD drop confidence intervals). If multiple SNPs overlapped the same number of X-pQTL, we selected the SNP with the smallest bp position to be the hotspot position.
Note that Figure 2 groups linkages into bins of 20 cM (based on the linkage map used in 35). The threshold displayed in that figure is based on 100 randomizations of peak positions as described above, but was not itself used for determining hotspot locations. We chose this visual display to be consistent with that in earlier work 2. The hotspots that identified using the method described above are identical to those that would be identified using 20 cM bins, as can be seen by comparing Extended Data Table 2 with Figure 2.
We compared the X-pQTL hotspots to the eQTL hotspots reported by Smith & Kruglyak for growth in glucose 2. Additionally, the hotspot on chromosome XII at 1,039,502 bp was previously seen in Yvert et al. 39.
Comparison of genes regulated by hotspots to other datasets
HAP1 and HAP4 targets
Genes regulated by the HAP1 and HAP4 transcription factors were downloaded from ScerTF 41, using ChIP data for both transcription factors. Overlap between transcription factor targets and the genes regulated by the given hotspots was tested using Fisher’s exact test. Effect sizes for a gene at a hotspot position were measured as the difference in allele frequency of the BY allele between the high and low GFP population. Effect sizes for transcription factor targets and the remaining genes were tested using Wilcoxon rank tests.
Expression data for glucose sensing and PKA induction
To test if the putative IRA2 hotspot mimics the effects of altered glucose sensing, we compared the effects of this locus on the genes in our dataset to mRNA expression data obtained by Zaman et al. 25. In that work, the authors added glucose to yeast growing on glycerol (a non-fermentable carbon source) and measured the resulting mRNA expression changes using microarrays. We obtained these expression data from the PUMA database (http://puma.princeton.edu). We averaged the results for each gene across the four available replicates of the 60 minutes time point post glucose addition (experiment IDs 100564, 101022, 101261, 105490). We calculated spearman’s rank correlation between hotspot effect size and mRNA expression. The hotspot effects are polarized such that positive values correspond to higher expression being caused by the BY compared to the RM allele.
Extended Data
Extended Data Figure 1.

Overview of the experimental design
Extended Data Figure 2. Illustration of FACS design.
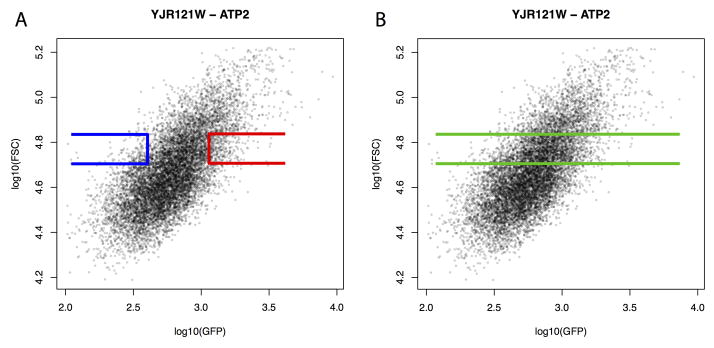
Shown is GFP intensity and forward scatter (FSC, a measure of cell size) recorded during FACS. The correlation between cell size and GFP intensity is clearly visible. The superimposed collection gates are an illustration, and do not show the actual gates used for this gene. A. The low GFP (blue) and high GFP (red) gates sample extreme levels of GFP within a defined range of cell sizes. B. For the “null” experiments, the same cell size range is collected, but without selecting on GFP.
Extended Data Figure 3. Sequence analyses and X-pQTL detection example.

In all panels, physical genomic coordinates are shown on the x-axes. The position of the gene (LEU1) is indicated by the purple horizontal line.
Top panel: Frequency of the BY allele in the high (red) and low (blue) GFP population. SNPs are indicated by dots, and loess-smoothed averages as solid lines. Note the fixation for the BY allele in all segregants at the gene position as well as at the mating type locus on chromosome III, as well as the fixation for the RM allele at the SGA marker integrated at the CAN1 locus on the left arm of chromosome V.
Middle panel: Subtraction of allele frequencies in the low from those in the high GFP population. SNPs are indicated by grey dots, with the loess-smoothed average indicated in black. Note that on average, there is no difference between the high and the low populations. Positive difference values correspond to a higher frequency of the BY allele in the high GFP population, which we interpret as higher expression being caused by the BY allele at that locus. The red horizontal lines indicate the 99.99% quantile from the empirical “null” sort experiments. They are shown for illustration only and were not used for peak calling. The blue vertical boxes indicate positions of genome-wide X-pQTL, with the width representing the 2-LOD drop interval.
Bottom panel: LOD scores obtained from MULTIPOOL 16. The red horizontal line is the genome-wide significance threshold (LOD = 4.5). Stars indicate X-pQTL called by our algorithm; these positions correspond to the blue bars in the middle panel. For this gene, 14 X-pQTL are called.
Extended Data Figure 4. Reproducibility examples.

Shown are allele frequency differences between the high and low GFP populations along the genome for three examples of replicates for three genes. The gene positions are indicated by purple vertical lines; note that YMR315W and GCN1 were “local” experiments where peaks at the gene position are visible. The red horizontal lines indicate the 99.99% quantile from the empirical “null” sort experiments. Note the near-perfect agreement for strong X-pQTL, with some differences discernable at weaker loci. See Supplementary Note 1 for details.
Extended Data Figure 5. Example for a local X-pQTL in the gene MAE1.

Shown is the difference in the frequency of the BY allele between the high and the low GFP population along the genome. Red dashed horizontal lines indicate the 99.99% quantile from the empirical “null” sort experiments. They are shown for illustration only and were not used for peak calling.
Extended Data Figure 6. Distributions of X-pQTL effect sizes for X-pQTL with and without a corresponding eQTL.
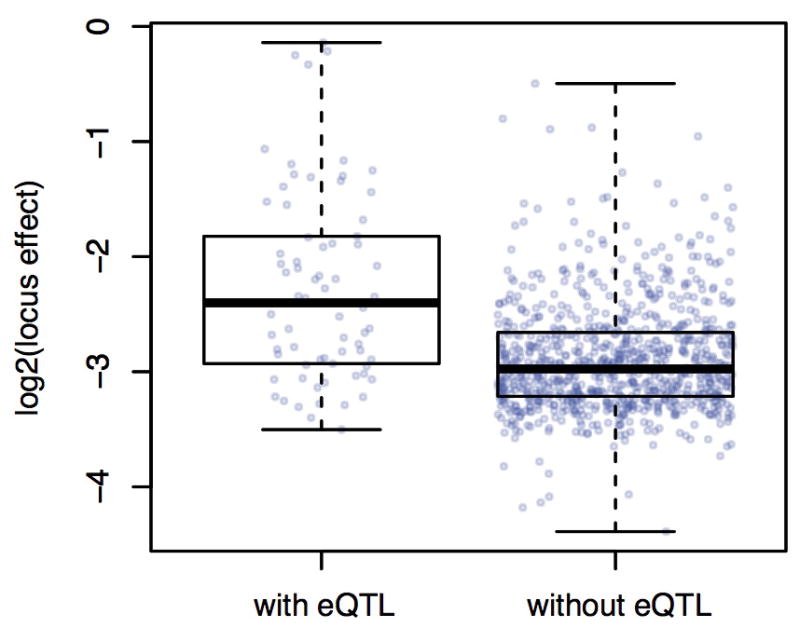
Effect sizes are shown as the allele frequency differences between the high and low GFP population.
Extended Data Figure 7. The impact of small effect sizes on the π1 estimate.

Each panel shows the p-value distribution obtained from 5,000 tests of a given effect size x, if two groups of 50 individuals each are compared using a T-test. The effect size x is given along with the corresponding variance explained (VE), the π1 estimate, and the fraction of tests that achieved nominal significance (p < 0.05). Note that π1 reaches 0.3 at VE = 0.5% – 1% (middle row, right columns). See Supplementary Note 2 for details.
Extended Data Figure 8. Genes regulated by the hotspots on chromosomes XI, XII, and XV.

The table shows genes that have an X-pQTL at three hotspots. For each gene involved in aerobic respiration, we show the X-pQTL LOD scores along the genome in the top half of the plot, and the eQTL and pQTL LOD scores in the bottom half on an inverted scale. The hotspot locations are shown as grey bars labeled with the names of the causative genes. Purple vertical lines indicate the gene positions. Red dashed horizontal lines are significance thresholds. Stars indicate significant QTL.
Extended Data Table 1.
mRNA-specific and protein-specific local QTL
| Gene | X-pQTL LOD | eQTL LOD |
|---|---|---|
| Local eQTL only
| ||
| YJL201W | 0.5 | 15.2 |
| YPL048W | 0.4 | 7.3 |
| YDL171C | 0.5 | 6.4 |
| YLR438W | 1.0 | 6.4 |
| YNL044W | 0.5 | 5.3 |
|
| ||
| Local X-pQTL only
| ||
| YJL130C | 6.4 | 0.2 |
| YDL126C | 13.7 | 0.2 |
| YGL026C | 8.6 | 0.1 |
| YMR315W | 12.7 | 0.6 |
Extended Data Table 2.
Hotspot regulators of protein expression
| Chromosome | Position (peak SNP) | % of genes regulated at LOD > 4.5 / LOD > 3 | mRNA hotspot* |
|---|---|---|---|
| I | 39,010 | 31/40 | Glu1 |
| II | 132,948 | 31/41 | - |
| II | 397,978 | 9/18 | Glu2 |
| IV | 223,943 | 12/24 | - |
| V | 192,064 | 16/31 | - |
| V | 371,845 | 16/21 | Glu6 |
| VII | 137,332 | 15/26 | - |
| VII | 505,871 | 16/29 | - |
| VIII | 103,041 | 19/29 | Glu7 |
| VIII | 419,747 | 8/12 | - |
| X | 142,009 | 18/26 | - |
| X | 655,465 | 11/15 | - |
| XI | 234,462 | 16/23 | Glu8 |
| XII | 238,302 | 16/31 | - |
| XII | 656,893 | 41/49 | Glu9 |
| XII | 1,039,502 | 12/19 | Yvert† |
| XIII | 96,832 | 31/46 | Glu10 |
| XIV | 232,509 | 13/19 | - |
| XIV | 465,007 | 58/65 | Glu11 |
| XV | 162,766 | 56/70 | Glu12 |
Supplementary Material
Acknowledgments
We are grateful to Christina DeCoste in the Princeton Flow Cytometry Resource Facility for technical assistance and advice on the experiments. This work was supported by National Institutes of Health (NIH) grant R01 GM102308, a James S. McDonnell Centennial Fellowship, and the Howard Hughes Medical Institute (LK), a research fellowship from the German Science Foundation AL 1525/1-1 (FWA), a National Science Foundation (NSF) fellowship (JSB), and NIH postdoctoral fellowship F32 GM101857-02 (ST)
Footnotes
Author contributions
FWA and LK conceived the project, designed research and wrote the paper. FWA and AHS performed experiments. FWA analyzed the data. ST provided advice on yeast strain construction, the initial experimental design and other experimental procedures. JSB provided advice on experimental procedures and data analysis.
Competing financial interest statement
The authors declare that no competing financial interests exist.
References
- 1.Rockman MV, Kruglyak L. Genetics of global gene expression. Nature Reviews Genetics. 2006;7:862–872. doi: 10.1038/nrg1964. [DOI] [PubMed] [Google Scholar]
- 2.Smith EN, Kruglyak L. Gene–Environment Interaction in Yeast Gene Expression. PLoS Biology. 2008;6:e83. doi: 10.1371/journal.pbio.0060083. [DOI] [PMC free article] [PubMed] [Google Scholar]
- 3.Rockman MV, Skrovanek SS, Kruglyak L. Selection at linked sites shapes heritable phenotypic variation in C. elegans. Science. 2010 doi: 10.1126/science.1194208. [DOI] [PMC free article] [PubMed] [Google Scholar]
- 4.Huang GJ, et al. High resolution mapping of expression QTLs in heterogeneous stock mice in multiple tissues. Genome Research. 2009;19:1133–1140. doi: 10.1101/gr.088120.108. [DOI] [PMC free article] [PubMed] [Google Scholar]
- 5.West MAL, et al. Global eQTL Mapping Reveals the Complex Genetic Architecture of Transcript-Level Variation in Arabidopsis. Genetics. 2006;175:1441–1450. doi: 10.1534/genetics.106.064972. [DOI] [PMC free article] [PubMed] [Google Scholar]
- 6.Lappalainen T, et al. Transcriptome and genome sequencing uncovers functional variation in humans. Nature. 2013 doi: 10.1038/nature12531. [DOI] [PMC free article] [PubMed] [Google Scholar]
- 7.Brem RB, Kruglyak L. The landscape of genetic complexity across 5,700 gene expression traits in yeast. Proceedings of the National Academy of Sciences. 2005;102:1572–1577. doi: 10.1073/pnas.0408709102. [DOI] [PMC free article] [PubMed] [Google Scholar]
- 8.Foss EJ, et al. Genetic basis of proteome variation in yeast. Nature Genetics. 2007;39:1369–1375. doi: 10.1038/ng.2007.22. [DOI] [PubMed] [Google Scholar]
- 9.Foss EJ, et al. Genetic Variation Shapes Protein Networks Mainly through Non-transcriptional Mechanisms. PLoS Biology. 2011;9:e1001144. doi: 10.1371/journal.pbio.1001144. [DOI] [PMC free article] [PubMed] [Google Scholar]
- 10.Ghazalpour A, et al. Comparative Analysis of Proteome and Transcriptome Variation in Mouse. PLoS Genetics. 2011;7:e1001393. doi: 10.1371/journal.pgen.1001393. [DOI] [PMC free article] [PubMed] [Google Scholar]
- 11.Wu L, et al. Variation and genetic control of protein abundance in humans. Nature. 2013 doi: 10.1038/nature12223. [DOI] [PMC free article] [PubMed] [Google Scholar]
- 12.Khan Z, Bloom JS, Garcia BA, Singh M, Kruglyak L. Protein quantification across hundreds of experimental conditions. Proceedings of the National Academy of Sciences. 2009;106:15544–15548. doi: 10.1073/pnas.0904100106. [DOI] [PMC free article] [PubMed] [Google Scholar]
- 13.Skelly DA, et al. Integrative phenomics reveals insight into the structure of phenotypic diversity in budding yeast. Genome Research. 2013 doi: 10.1101/gr.155762.113. [DOI] [PMC free article] [PubMed] [Google Scholar]
- 14.Ehrenreich IM, et al. Dissection of genetically complex traits with extremely large pools of yeast segregants. Nature. 2010;464:1039–1042. doi: 10.1038/nature08923. [DOI] [PMC free article] [PubMed] [Google Scholar]
- 15.Huh WK, et al. Global analysis of protein localization in budding yeast. Nature. 2003;425:686–691. doi: 10.1038/nature02026. [DOI] [PubMed] [Google Scholar]
- 16.Edwards MD, Gifford DK. High-resolution genetic mapping with pooled sequencing. BMC Bioinformatics. 2012;13:S8. doi: 10.1186/1471-2105-13-S6-S8. [DOI] [PMC free article] [PubMed] [Google Scholar]
- 17.Picotti P, et al. A complete mass-spectrometric map of the yeast proteome applied to quantitative trait analysis. Nature. 2013;494:266–270. doi: 10.1038/nature11835. [DOI] [PMC free article] [PubMed] [Google Scholar]
- 18.Brem RB, Yvert G, Clinton R, Kruglyak L. Genetic Dissection of Transcriptional Regulation in Budding Yeast. Science. 2002;296:752–755. doi: 10.1126/science.1069516. [DOI] [PubMed] [Google Scholar]
- 19.Litvin O, Causton HC, Chen BJ, Pe’er D. Modularity and interactions in the genetics of gene expression. Proceedings of the National Academy of Sciences. 2009;106:6441–6446. doi: 10.1073/pnas.0810208106. [DOI] [PMC free article] [PubMed] [Google Scholar]
- 20.Zitomer RS, Lowry CV. Regulation of gene expression by oxygen in Saccharomyces cerevisiae. Microbial Reviews. 1992;56:1–11. doi: 10.1128/mr.56.1.1-11.1992. [DOI] [PMC free article] [PubMed] [Google Scholar]
- 21.Gaisne M, Bécam AM, Verdiere J, Herbert CJ. A ‘natural’ mutation in Saccharomyces cerevisiae strains derived from S288c affects the complex regulatory gene HAP1 ( CYP1 ) Current Genetics. 1999;36:195–200. doi: 10.1007/s002940050490. [DOI] [PubMed] [Google Scholar]
- 22.Harbison CT, et al. Transcriptional regulatory code of a eukaryotic genome. Nature. 2004;431:99–104. doi: 10.1038/nature02800. [DOI] [PMC free article] [PubMed] [Google Scholar]
- 23.Butler G. Hypoxia and Gene Expression in Eukaryotic Microbes. Annual Review of Microbiology. 2013;67:291–312. doi: 10.1146/annurev-micro-092412-155658. [DOI] [PubMed] [Google Scholar]
- 24.Zaman S, Lippman SI, Zhao X, Broach JR. How Saccharomyces Responds to Nutrients. Annu Rev Genet. 2008;42:27–81. doi: 10.1146/annurev.genet.41.110306.130206. [DOI] [PubMed] [Google Scholar]
- 25.Zaman S, Lippman SI, Schneper L, Slonim N, Broach JR. Glucose regulates transcription in yeast through a network of signaling pathways. Mol Syst Biol. 2009;5 doi: 10.1038/msb.2009.2. [DOI] [PMC free article] [PubMed] [Google Scholar]
- 26.Spor A, et al. Niche-driven evolution of metabolic and life-history strategies in natural and domesticated populations of Saccharomyces cerevisiae. BMC Evol Biol. 2009;9:296. doi: 10.1186/1471-2148-9-296. [DOI] [PMC free article] [PubMed] [Google Scholar]
- 27.Warringer J, et al. Trait Variation in Yeast Is Defined by Population History. PLoS Genetics. 2011;7:e1002111. doi: 10.1371/journal.pgen.1002111. [DOI] [PMC free article] [PubMed] [Google Scholar]
- 28.Fraser HB, Moses AM, Schadt EE. Evidence for widespread adaptive evolution of gene expression in budding yeast. Proceedings of the National Academy of Sciences. 2010;107:2977–2982. doi: 10.1073/pnas.0912245107. [DOI] [PMC free article] [PubMed] [Google Scholar]
- 29.Lewis JA, Gasch AP. Natural Variation in the Yeast Glucose-Signaling Network Reveals a New Role for the Mig3p Transcription Factor. G3 - Genes|Genomes|Genetics. 2012;2:1607–1612. doi: 10.1534/g3.112.004127. [DOI] [PMC free article] [PubMed] [Google Scholar]
- 30.Henras AK, et al. The post-transcriptional steps of eukaryotic ribosome biogenesis. Cell Mol Life Sci. 2008;65:2334–2359. doi: 10.1007/s00018-008-8027-0. [DOI] [PMC free article] [PubMed] [Google Scholar]
- 31.Howson R, et al. Construction, Verification and Experimental Use of Two Epitope-Tagged Collections of Budding Yeast Strains. Comparative and Functional Genomics. 2005;6:2–16. doi: 10.1002/cfg.449. [DOI] [PMC free article] [PubMed] [Google Scholar]
- 32.Tong AHY, Boone C. High-Throughput Strain Construction and Systematic Synthetic Lethal Screening in Saccharomyces cerevisiae. Methods in Microbiology. 2007;36:369–707. [Google Scholar]
- 33.Newman JRS, et al. Single-cell proteomic analysis of S. cerevisiae reveals the architecture of biological noise. Nature. 2006;441:840–846. doi: 10.1038/nature04785. [DOI] [PubMed] [Google Scholar]
- 34.Adey A, et al. Rapid, low-input, low-bias construction of shotgun fragment libraries by high-density in vitro transposition. Genome Biol. 2010;11:R119. doi: 10.1186/gb-2010-11-12-r119. [DOI] [PMC free article] [PubMed] [Google Scholar]
- 35.Bloom JS, Ehrenreich IM, Loo WT, Lite TLV, Kruglyak L. Finding the sources of missing heritability in a yeast cross. Nature. 2013;494:234–237. doi: 10.1038/nature11867. [DOI] [PMC free article] [PubMed] [Google Scholar]
- 36.Meyer M, Kircher M. Illumina Sequencing Library Preparation for Highly Multiplexed Target Capture and Sequencing. Cold Spring Harbor Protocols. 2010 doi: 10.1101/pdb.prot5448. [DOI] [PubMed] [Google Scholar]
- 37.Li H, Durbin R. Fast and accurate short read alignment with Burrows-Wheeler transform. Bioinformatics. 2009;25:1754–1760. doi: 10.1093/bioinformatics/btp324. [DOI] [PMC free article] [PubMed] [Google Scholar]
- 38.Broman KW, Wu H, Sen S, Churchill GA. R/qtl: QTL mapping in experimental crosses. Bioinformatics. 2003;19:889–890. doi: 10.1093/bioinformatics/btg112. [DOI] [PubMed] [Google Scholar]
- 39.Yvert G, et al. Trans-acting regulatory variation in Saccharomyces cerevisiae and the role of transcription factors. Nature Genetics. 2003;35:57–64. doi: 10.1038/ng1222. [DOI] [PubMed] [Google Scholar]
- 40.Storey JD, Tibshirani R. Statistical significance for genomewide studies. Proceedings of the National Academy of Sciences. 2003;100:9440–9445. doi: 10.1073/pnas.1530509100. [DOI] [PMC free article] [PubMed] [Google Scholar]
- 41.Spivak AT, Stormo GD. ScerTF: a comprehensive database of benchmarked position weight matrices for Saccharomyces species. Nucleic Acids Research. 2011;40:D162–D168. doi: 10.1093/nar/gkr1180. [DOI] [PMC free article] [PubMed] [Google Scholar]
Associated Data
This section collects any data citations, data availability statements, or supplementary materials included in this article.