

Abstract
Dysregulation of thyroid hormones triiodothyronine and thyroxine (T3/T4) can impact metabolism, body composition, and development. Thus, it is critical to identify novel mechanisms that impact T3/T4 production. We found that type 2 taste receptors (TAS2Rs), which are activated by bitter-tasting compounds such as those found in many foods and pharmaceuticals, negatively regulate thyroid-stimulating hormone (TSH)-dependent Ca2+ increases and TSH-dependent iodide efflux in thyrocytes. Immunohistochemical Tas2r-dependent reporter expression and real-time PCR analyses reveal that human and mouse thyrocytes and the Nthy-Ori 3-1 human thyrocyte line express several TAS2Rs. Five different agonists for thyrocyte-expressed TAS2Rs reduced TSH-dependent Ca2+ release in Nthy-Ori 3-1 cells, but not basal Ca2+ levels, in a dose-dependent manner. Ca2+ responses were unaffected by 6-n-propylthiouracil, consistent with the expression of an unresponsive variant of its cognate receptor, TAS2R38, in these cells. TAS2R agonists also inhibited basal and TSH-dependent iodide efflux. Furthermore, a common TAS2R42 polymorphism is associated with increased serum T4 levels in a human cohort. Our findings indicate that TAS2Rs couple the detection of bitter-tasting compounds to changes in thyrocyte function and T3/T4 production. Thus, TAS2Rs may mediate a protective response to overingestion of toxic materials and could serve as new druggable targets for therapeutic treatment of hypo- or hyperthyroidism.—Clark, A. A., Dotson, C. D., Elson, A. E. T., Voigt, A., Boehm, U., Meyerhof, W., Steinle, N. I., Munger, S. D. TAS2R bitter taste receptors regulate thyroid function.
Keywords: G protein-coupled receptor, iodide, thyroxine, thyrocyte, T2R
A critical step in thyroid hormone synthesis is the transport of iodide from the bloodstream, through the thyroid follicular cells (thyrocytes), and into the thyroid follicular lumen, where it is oxidized and incorporated into the thyroid hormone precursor thyroglobulin (1). Because the regulation of iodide efflux from thyrocytes can have broad metabolic consequences via its impact on thyroid hormone production, it is critical to elucidate the molecular mechanisms that affect this process. Of particular interest are receptor-mediated mechanisms that could couple the detection of extrafollicular factors to changes in thyrocyte physiology. As integral membrane proteins such as GPCRs are often effective therapeutic targets for pharmaceuticals (2), the identification of receptors that impact thyroid hormone production could be useful in the treatment of thyroid disease.
Type 2 taste receptors (TAS2Rs) comprise a large family of GPCRs, with 25 distinct isoforms encoded in the human genome (3). TAS2Rs were first discovered in the gustatory system, where they are coexpressed in a subset of taste receptor cells and function as receptors for bitter-tasting compounds, including many common drugs (3–9). More recently, it has become clear that TAS2Rs are also expressed outside the gustatory system, including in respiratory and gastrointestinal tissues, where they could respond to exogenous or endogenous stimuli (3, 9–21). These extraoral TAS2Rs have been implicated in diverse functions including cellular responses to inhaled or ingested toxins, although the evidence for a role for TAS2Rs in these functions is often only circumstantial (3, 9). Here, we report that TAS2Rs are expressed in the thyroid, an endocrine organ with no direct access to the external environment. Furthermore, we find that thyroid-expressed TAS2Rs could influence the production of thyroid hormones by regulating thyroid stimulating hormone (TSH)-dependent changes in intracellular Ca2+ and iodide efflux from thyrocytes.
MATERIALS AND METHODS
Experiments were approved by the University of Maryland Institutional Animal Care and Use Committee or Institutional Review Board, as appropriate.
Cell culture
The human thyrocyte line Nthy Ori 3-1 (22) (Sigma-Aldrich, St. Louis, MO, USA) was cultured in RPMI 1640 media containing 2.05 mM l-glutamine, 25.03 mM 4-(2-hydroxyethyl)-1-piperazineethanesulfonic acid (HEPES) (Life Technologies, Carlsbad, CA, USA), and 10% fetal bovine serum (Atlanta Biologicals Flowery Branch, GA, USA) at 37°C with 5% CO2. Cells were used between passages 17 and 30.
Real-time RT-PCR
RNA was isolated from Nthy-Ori 3-1 cells using Trizol reagent (Life Technologies). Human thyroid RNA was purchased from BioChain Institute (Newark, CA, USA). RNA samples were treated with DNase I (Life Technologies) prior to cDNA synthesis using the iScript Select cDNA synthesis kit (Bio-Rad, Hercules, CA, USA). TAS2R and α-gustducin cDNAs were amplified by both standard PCR and by real-time PCR. These latter experiments were performed using SsoFast EvaGreen and a Bio-Rad CFX96 Real-Time PCR System (Table 1). PCR primer efficacies were verified using Nthy-Ori 3-1 cDNA, and amplified products were normalized to signals for glyceraldehyde 3-phosphate dehydrogenase (GAPDH) using the ΔCt method (23). The presence of a single amplicon species was verified by melting curve analysis and by agarose gel electrophoresis. A subset of TAS2Rs amplified from human thyroid cDNA by standard RT-PCR was selected for real-time analysis based on one or more of the following criteria: genetic association with differences in thyroid hormone levels (TAS2R42); known sensitivity to thyroid toxins (TAS2R38); sensitivity to agonists that activate a single TAS2R isoform (TAS2R10 and TAS2R38); and sensitivity to agonists at sub-millimolar concentrations (TAS2R4, TAS2R10, TAS2R38, and TAS2R43). Table 2 presents agonist-receptor relationships for these TAS2Rs.
TABLE 1.
Oligonucleotides used for real-time RT-PCR
| Gene product | Forward primer | Reverse primer |
|---|---|---|
| TAS2R4 | 5′-CTGTACATCACGCTTAGCCAG | 5′-AGAAACCACTAAAGACAAGAT |
| TAS2R10 | 5′-AACTACATATTTCTCTGGTTG | 5′-CGCAATGTATGCAAAATTAAG |
| TAS2R38 | 5′-CTGACCAATGCCTTCGTTTTC | 5′-AAGCCGGCTGATGCTGAGACA |
| TAS2R42 | 5′-CTGTTTGATTCATTTCTAGTG | 5′-TGTCAAGTGATTAGTCATGTG |
| TAS2R43 | 5′-CTTCACTTAAAGAGGAGAGTT | 5′-AATCTCATTCATGTTTATCAC |
| α-Gustducin | 5′-CTCAATGACTCAGCAGCTTAC | 5′-CGTTTTCACTCGAGAATGGAG |
| SLC5A5 (NIS) | 5′-TTCCTCTGGATGTGCCTGGGC | 5′-GTACTCGTAGGTGCTGGTGAG |
| GAPDH | 5′-CATTGACCTCAACTACATGGTT | 5′-CCATTGATGACAAGCTTCCC |
TABLE 2.
Agonist-TAS2R pairings and minimal effective agonist concentrations
| TAS2R | Agonist | Minimum effective concentration for TAS2R activation* |
|---|---|---|
| TAS2R4 | Camphor | 300 μM |
| Colchicine | 100 μM | |
| Denatonium benzoate | 300 μM | |
| TAS2R10 | Camphor | 300 μM |
| Chloramphenicol | 100 μM | |
| Cycloheximide | 100 μM | |
| Denatonium benzoate | 3 μM | |
| TAS2R38 | 6-n-propylthiouracil | 6 μM |
| TAS2R42 | Unknown | Not applicable |
| TAS2R43 | Chloramphenicol | 100 μM |
| Denatonium benzoate | 300 μM |
In receptor activation assays, as reported previously (27).
Immunohistochemistry
Mouse thyroid and taste tissue was dissected from Tas2r131Cre/+/Rosa26tauGFP/+ and Tas2r131+/+/Rosa26tauGFP/+ mice (24) (after euthanasia by intracardial perfusion with cold PBS followed by 4% paraformaldehyde) and embedded for cryosectioning. Sections (15 μM) were collected onto slides, and green fluorescent protein (GFP) fluorescence was visualized directly by confocal microscopy. Human thyroid (21-yr-old female accident victim), formalin-fixed and paraffin-embedded, was purchased from ILSBIO, LLC (Chestertown, MD, USA). Sections (14 μM) were mounted on glass slides, deparaffinized, and rehydrated. Nthy-Ori 3-1 cells were plated onto gelatin-coated tissue culture chamber slides, grown to 50% confluence, and fixed with 4% paraformaldehyde for 20 min at room temperature. For immunocytochemistry, slides were incubated overnight with one or more of the following primary antisera: α-gustducin (sc-395, 1:100; Santa Cruz Biotechnology, Dallas, TX, USA); TAS2R38 (ab65509, 1:500; Abcam, Cambridge, MA, USA), or E-cadherin (sc-7870, 1:250; Santa Cruz Biotechnology). Immunoreactivity was visualized with CY2- or CY3-conjugated secondary antibodies followed by confocal microscopy. The TAS2R38 antisera do not recognize other TAS2Rs, and staining is abolished in cells that do not express TAS2R38 (25). Immunostaining with the α-gustducin antisera is coincident with GFP fluorescence in α-gustducin reporter mice (26). Images were processed using Olympus FluoView software, and global brightness, contrast, and levels were adjusted in Adobe Photoshop CS5/CS6.
Ca2+ measurements
Nthy Ori 3-1 cells were seeded in black-walled, clear-bottom 96-well plates (Corning Life Sciences, Tewksbury, MA, USA) at a density of 20,000 cells per well. Plates were incubated overnight or until 95% confluent in 100 μl RPMI 1640 media. Changes in intracellular Ca2+ were measured using the Fluo-4 NW Calcium Assay Kit (Life Technologies) and a FlexStation 3 Benchtop Multi-Mode Microplate Reader (Molecular Devices, Sunnyvale, CA, USA). Two sets of experiments were performed. In the first, cells were incubated with or without bovine TSH (333 mU/ml; Sigma-Aldrich) along with one of the following TAS2R agonists (27): camphor (5–333 μM), chloramphenicol (0.02–1.0 mM), colchicine (5–333 μM), cycloheximide (0.02–1.0 mM), denatonium benzoate (0.02–1.0 mM), or 6-n-propylthiouracil (PROP; 0.02–1.0 mM). All compounds were obtained from Sigma-Aldrich except chloramphenicol (Research Products International, Mt. Prospect, IL, USA). In the second, cells were incubated with buffer or one of the four bitter-tasting compounds (chloramphenicol, cycloheximide: 0.5 or 1.0 mM; denatonium benzoate: 0.33 or 1.0 mM; PROP: 0.04 or 0.5 mM) and TSH (10.4–666 mU/ml). Following stimulation, fluorescence measurements were obtained at 2 s intervals for 3 min. Ca2+ levels were quantified in relative fluorescent units (RFUs), and changes in fluorescence were measured using RFU peaks above baseline. Statistical differences between and within treatment groups were assessed by 2-way ANOVA followed by 1-way ANOVA.
Measurements of iodide efflux
Iodide efflux was measured using a protocol adapted from Weiss et al. (28). Nthy Ori 3-1 cells were seeded in 40 ml culture flasks at 4,000,000 cells per flask and maintained at 37°C in 8 ml RPMI 1640 medium until 95% confluent. Media were then aspirated, and cells were washed twice with 5 ml HBSS (10 mM HEPES, pH 7.3, 137 mM NaCl, 5.4 mM KCl, 1.3 mM CaCl2, 0.4 mM MgSO4, 0.5 mM MgCl2, 0.4 mM Na2HPO4, 0.44 mM KH2PO4, 5.55 mM glucose). Cells were incubated in a 37°C water bath for 40 min with 5 ml HBSS containing 10 μM NaI, 1 μCi/ml [125I] (PerkinElmer Life and Analytical Sciences, Waltham, MA, USA), and 10% fetal bovine serum. HBSS containing [125I] was aspirated, and then the cells were washed twice with 5 ml HBSS and were incubated with 3 ml HBSS containing 10 μM NaI with or without 333 mU/ml TSH, 1 mM denatonium benzoate with 333 mU/ml TSH, or 1 mM chloramphenicol with 333 mU/ml TSH. These agonists were selected based on their effects on TSH-dependent Ca2+ release and their demonstrated ability to activate multiple TAS2Rs (27). Flasks were removed from water bath, and media were collected at 4, 8, 12, and 16 min. After media collection, cells were washed with 5 ml HBSS before being returned to the water bath. After the 16 min time point, cells were treated with 5 ml ethanol to remove the remaining [125I], and [125I] levels were assessed in all samples using a scintillation counter. The amount of [125I] remaining at each time point was determined by subtracting radioactivity collected up to that time point from total radioactivity. Statistical differences in area under the curve (AUC) were determined using 1-way ANOVA followed by a Scheffe post hoc test.
Gene Association Studies
Subjects
The University of Maryland School of Medicine’s Institutional Review Board approved all studies. The Amish Family Diabetes Study (AFDS) is an ongoing effort to identify genetic contributors to obesity, diabetes, cardiovascular disease, and related disorders. Detailed descriptions of the population (the Old Order Amish of Lancaster County, PA, USA), study design, recruitment methods, phenotypic characterization, clinical characteristics of the subjects, and statistical methods have been published previously (29). Briefly, the mean age of subjects was 46 ± 15 yr for men and 45 ± 15 yr for women. The mean body mass index (BMI) was 26.4 ± 3.7 kg/m2 for men and 28.1 ± 5.4 kg/m2 for women (P < 0.001).
Clinical and laboratory measurements
Study subjects received a standardized examination at the study clinic in Strasburg, PA, USA. Fasting blood samples were collected, and free thyroid hormones levels were determined in a subsample of 374 subjects. Free triiodothyronine (T3) and free thyroxine (T4) were measured by Quest Diagnostics (Baltimore, MD, USA). TSH was evaluated by radioimmunoassay (Nichols Institute Diagnostics, San Juan Capistrano, CA, USA).
Genotyping
Genotyping of TAS2R candidate haplotype-tagging single nucleotide polymorphisms (SNPs; r2 ≥ 0.8) in the AFDS has been described previously (15). Briefly, SNPs were identified from the HapMap (30) and Entrez SNP (31) databases, as well as from published reports (32). In total, 50 TAS2R-associated SNPs were genotyped. All SNPs were genotyped using the TaqMan platform (Life Technologies) according to manufacturer’s protocols. SNPs found to be monomorphic in the AFDS (n = 3) were not analyzed further. Genotypes were checked for Mendelian consistency; inconsistencies, which were detected in <0.5% of genotypes, were removed from analysis. Genotype frequencies of all SNPs were tested for consistency with Hardy-Weinberg expectations by the χ2 test. Markers that showed extreme deviation from Hardy-Weinberg equilibrium in controls (P < 0.001) were eliminated from further analysis (n = 6), as were SNPs with call rates <90% (n = 8) or minor allele frequencies <0.15 (n = 8). Twenty-five SNPs were polymorphic in the AFDS, passed quality control filters, and were subsequently analyzed.
Statistical analyses
Associations with SNP genotype and the various phenotypes were performed using pedigree-based analysis by regressing the effect of the marker genotype while accounting for residual familial correlations among related individuals using age, sex, and BMI as covariates. Phenotypic data were transformed by their natural logarithms to normalize the data distributions. To account for the relatedness among family members, we used the measured genotype approach, in which we estimated the likelihood of specific genetic models given the pedigree structure. Parameter estimates were obtained by maximum likelihood methods, and the significance of association was tested by likelihood ratio tests. All analyses were carried out using the Sequential Oligogenic Linkage Analysis Routines (SOLAR) software program (33) assuming a recessive model. To control for inflation in the type I error rate due to the number of comparisons in our initial association analyses, we use the PACT statistic (34), which attains the accuracy of permutation or simulation-based correction through the adjustment of correlated P values.
RESULTS
TAS2Rs are expressed in thyrocytes
The thyroid gland emerges during embryological development from the floor of the pharynx near the base of the tongue. Thus, we asked if the thyroid expresses molecules related to taste transduction. Using standard RT-PCR, we could amplify products from human thyroid cDNA for 15 of 25 TAS2R bitter taste receptors (5, 7) and for the taste-related G protein subunit α-gustducin (35) (Fig. 1A). Using quantitative real-time RT-PCR, we then assessed the expression levels of select TAS2Rs and α-gustducin (Table 1) in either human thyroid or Nthy-Ori 3-1 cells (22), a human thyrocyte line (Fig. 1B). Both human thyroid and Nthy-Ori 3-1 cDNA showed TAS2R and α-gustducin expression at levels comparable to, or much greater than, that of SLC5A5, the Na+/I− symporter (NIS) mediating iodide uptake into thyrocytes.
Figure 1.
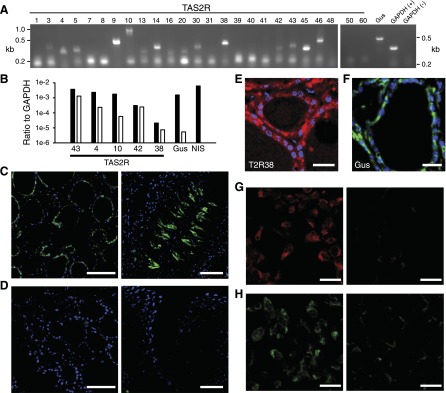
TAS2R expression in thyrocytes. A) RT-PCR amplification of 15 of 25 TAS2R isoforms, α-gustducin (Gus), and GAPDH (+, reverse transcribed RNA; −, no reverse transcription) from human thyroid cDNA. kb, kilobases. B) Real-time RT-PCR expression levels of the Na+-I− symporter SLC5A5 (NIS), α-gustducin (Gus), and 5 TAS2R isoforms in human thyroid (black) and Nthy-Ori 3-1 (white) cDNA, normalized to GAPDH (ΔCt method). Each bar, n ≥ 3 separate amplifications. SLC5A5 levels in Nthy-Ori 3-1 cDNA were indistinguishable from background and thus are not represented. C) GFP (green) is expressed in thyrocytes (left) and subsets of taste receptor cells (right) from thyroid and circumvallate papillae, respectively, of Tas2r131Cre/+/Rosa26tauGFP/+ mice. D) No GFP signal is seen in either thyroid or taste tissue from Tas2r131+/+/Rosa26tauGFP/+control mice. Blue, DAPI. E and F) Immunohistochemical staining for (E) TAS2R38 and (F) α-gustducin (Gus) localized to thyrocytes of human thyroid. Blue, DAPI. G) TAS2R38 immunoreactivity in Nthy-Ori 3-1 cells (left); staining is absent when the primary antisera are excluded (right). H) α-gustducin immunoreactivity in Nthy-Ori 3-1 cells; staining is absent when the primary antisera are excluded (right). Scale bars, 50 (C, D, G, and H) and 20 μM (E and F).
Next, we asked whether TAS2Rs are expressed in native thyrocytes. Using a gene-targeted mouse line that expresses a tau-GFP fusion protein under the control of the mouse Tas2r131 promoter via Cre-dependent recombination of an engineered Rosa26-loxp-stop-loxp-tau-GFP locus (Tas2r131Cre/+/Rosa26tauGFP/+ mice) (24), we visualized the expression of the Tas2r131 GFP reporter in mouse thyroid and taste buds. The GFP signal was easily seen in thyrocytes surrounding each thyroid follicle, as well as in a subset of taste receptor cells (Fig. 1C), but was absent in mice that had not undergone Cre-dependent recombination (Fig. 1D). We did not observe fluorescence between follicles, the site of calcitonin-secreting parafollicular cells, suggesting that expression of this receptor is restricted to thyrocytes. We visualized immunoreactivity for both TAS2R38 (25) (Fig. 1E) and α-gustducin (Fig. 1F) in human cadaver thyroid tissue, demonstrating that the expression of these proteins is conserved in human thyrocytes. We could not resolve subcellular localization of the immunoreactivity in these sections. Finally, both α-gustducin and TAS2R38 immunoreactivity were found on the membrane and in the cytoplasm of Nthy-Ori 3-1 cells. It was absent upon exclusion of primary antisera (Fig. 1G, H). Together, these data indicate that human thyrocytes express TAS2Rs and α-gustducin.
TAS2R ligands inhibit TSH-dependent Ca2+ increases
A critical step in thyroid hormone synthesis is the transport of iodide from the bloodstream, through the thyroid follicular cells (thyrocytes), and into the follicular lumen of thyroid follicles, where it is oxidized and incorporated into the thyroid hormone precursor thyroglobulin (1). To investigate the impact of TAS2R activation on thyrocyte physiology, we first assessed the effects of several TAS2R ligands on TSH-dependent Ca2+ signals in Nthy-Ori 3-1 cells. We selected 6 compounds that are efficacious agonists for TAS2R4, TAS2R10, TAS2R43, and/or TAS2R38 (27), 4 of the TAS2Rs we found to be expressed in both Nthy-Ori 3-1 cells and human thyroid cDNA (Fig. 1B, E): camphor (TAS2R4 and TAS2R10), chloramphenicol (TAS2R10 and TAS2R43), colchicine (TAS2R4), cycloheximide (TAS2R10), denatonium benzoate (TAS2R4, TAS2R10 and TAS2R43), and PROP (TAS2R38; Table 2). We did not test any TAS2R42 agonists as this remains an orphan receptor (27). None of the TAS2R agonists altered intracellular Ca2+ levels in the absence of TSH (Fig. 2A–F). However, 5 of these compounds inhibited TSH-dependent Ca2+ increases in a concentration-dependent manner (Fig. 2A–E). Effective concentrations of these agonists were consistent with their demonstrated range of efficacies for TAS2R4, TAS2R10, and/or TAS2R43 in receptor activation assays (27), suggesting that the effects were receptor mediated. To better quantify this effect, we measured the ability of different TSH concentrations to elicit Ca2+ increases in the presence of either of 2 concentrations of chloramphenicol, cycloheximide, or denatonium benzoate. Each of these TAS2R agonists shifted the concentration-response functions for TSH-dependent Ca2+ release to the right (Fig. 2G–I), thus decreasing the efficacy of TSH.
Figure 2.

TAS2R agonists inhibit TSH-dependent Ca2+ increases in Nthy-Ori 3-1 thyrocytes. A–F) Change in intracellular Ca2+ levels in the presence (black) or absence (red) of 333 mU/ml TSH on treatment with several concentrations of TAS2R agonists. Two-way ANOVA (TAS2R agonist concentration × TSH treatment): camphor, F1,7 = 2.6, P = 0.02; chloramphenicol, F1,7 = 18.5, P = 1 × 10⁻¹¹; colchicine, F1,7 = 5.5, P = 0.0001; cycloheximide, F1,7 = 14.2, P = 3.7 × 10⁻¹⁰; denatonium, F1,7 = 31.7, P = 1 × 10⁻¹¹; PROP, F1,7 = 1.3, P = 0.27. Post hoc 1-way ANOVAs: camphor + TSH, F1,7 = 2.8, P = 0.03; camphor − TSH, F1,7 = 1.2, P = 0.34; chloramphenicol + TSH, F1,7 = 36.4, P = 1 × 10⁻¹¹; chloramphenicol − TSH, F1,7 = 2.4, P = 0.53; colchicine + TSH, F1,7 = 5.2, P = 9.8 × 10⁻⁴; colchicine − TSH, F1,7 = 0.3, P = 0.95; cycloheximide + TSH, F1,7 = 14.5, P = 8.2 × 10⁻⁸; cycloheximide − TSH, F1,7 = 1.4, P = 0.26; denatonium + TSH, F1,7 = 41.7, P = 1 × 10⁻¹¹; denatonium − TSH, F1,7 = 5.1, P = 0.001; PROP + TSH, F1,7 = 1.3, P = 0.28; PROP − TSH, F1,7 = 0.470 P = 0.85. G–J) Change in intracellular Ca2+ levels with increasing concentrations of TSH in the absence (black) or presence (red, green) of TAS2R agonists chloramphenicol (G, Chl), cycloheximide (H, Cyc), denatonium benzoate (I, DB), or PROP (J). Two-way ANOVA (TSH concentration × TAS2R agonist treatment): chloramphenicol, F2,7 = 15.1, P = 1 × 10⁻¹¹; cycloheximide, F1,7 = 5.5, P = 3.4 × 10⁻⁸; denatonium, F1,7 = 6.6, P = 4.4 × 10⁻¹⁰; PROP, F1,7 = 1.5, P = 0.13. Error bars, sem. Each point, n ≥ 4.
Surprisingly, the TAS2R38 agonist PROP had no effect on TSH-dependent Ca2+ levels (Fig. 2F, J) even though TAS2R38 message and protein are detectable in Nthy-Ori 3-1 cells (Fig. 1B, E). Sequencing of 6 PCR products obtained from independent reverse transcription reactions showed that Nthy-Ori 3-1 cells express only the “nontaster” version of TAS2R38 (encoding Ala at amino acid 49), which is unresponsive to PROP or other TAS2R38 ligands and acts as a functional knockout of this receptor (36). These results further support a direct role of TAS2Rs in the modulation of TSH-dependent intracellular Ca2+ signals.
TAS2R ligands inhibit TSH-dependent iodide efflux in Nthy-Ori 3-1 cells
TSH-dependent increases in intracellular Ca2+ regulate iodide efflux from thyrocytes (28, 37). To assess whether TAS2R agonists influence iodide efflux, we measured the rate of TSH-dependent iodide efflux in the absence or presence of TAS2R agonists. Nthy-Ori 3-1 cells were loaded with [125I] and then incubated with buffer or buffer containing TSH (333 mU/ml) alone, TSH plus chloramphenicol (1 mM), or TSH plus denatonium benzoate (1 mM). Consistent with published results (28, 37), TSH significantly potentiated iodide efflux over the buffer control (Fig. 3). However, both TAS2R agonists tested significantly reduced iodide efflux relative to TSH alone (both agonists) and to the buffer control (chloramphenicol only). The effectiveness of these 2 compounds for inhibiting iodide efflux paralleled their abilities to inhibit TSH-dependent Ca2+ increases. Together with the results described above, these data indicate that TAS2R activation modulates TSH-dependent iodide efflux from thyrocytes.
Figure 3.

TAS2R agonists inhibit TSH-dependent iodide efflux from Nthy-Ori 3-1 thyrocytes. Percent of [125I] remaining in Nthy-Ori 3-1 cells after TSH (333 mU/ml) stimulation in the absence or presence of TAS2R agonists chloramphenicol (Chl, 1 mM) or denatonium benzoate (DB, 1 mM). Error bars, sem. Each point, n ≥ 4. Inset) Same data represented as AUC, normalized to the media AUC. One-way ANOVA: F1,3 = 12.02, P = 0009; Scheffe’s post hoc: *P < 0.05 vs. media; #P < 0.05 vs. TSH. Error bars, sem.
TAS2R42 polymorphism is associated with lower thyroid hormone levels in a human cohort
Reduced iodide efflux should result in decreased production of thyroid hormones over time due to reduced iodine availability for incorporation into the thyroid hormone precursor, thyroglobulin. The human TAS2R subgenome contains a large number of SNPs (32), several of which have been associated with changes in ligand sensitivity (15, 36, 38). Therefore, we asked whether genetic variants within any TAS2R genes are associated with differences in free T3 (fT3) or free T4 (fT4) levels in a human cohort. We genotyped haplotype-tagging SNPs in or around all TAS2R genes in the genomes of 374 participants from the AFDS (29) (Table 3). Of SNPs meeting quality control criteria, only the nonsynonymous coding SNP rs5020531, located within the TAS2R42 gene, showed a significant association with elevated fT3 or fT4 levels (fT3: P = 0.003; PACT value = 0.06 after correction for multiple comparisons; fT4: P = 0.000004; PACT value = 0.00009 after correction for multiple comparisons; Tables 3 and 4). These results indicate that a difference in the primary structure of a thyroid-expressed TAS2R (Fig. 1B) is associated with differences in circulating levels of thyroid hormones.
TABLE 3.
TAS2R42 SNP significantly associated with fT3 and fT4 levels in the AFDS
| SNP | Associated nearest gene | Call rate (%) | HWE | Major/minor allele | MAF | SNP type | fT3* (P value) | fT4* (P value) |
|---|---|---|---|---|---|---|---|---|
| rs1376251 | TAS2R50 | 97.4 | 0.941 | C/T | 0.25 | C203Y | 0.82 | 0.60 |
| rs7301234 | TAS2R49 | 91.3 | 0.601 | G/A | 0.28 | Noncoding | 0.51 | 0.41 |
| rs10772408 | TAS2R49 | 94.3 | 0.576 | T/C | 0.40 | Noncoding | 0.88 | 0.10 |
| rs10772420 | TAS2R48 | 95.6 | 0.122 | A/G | 0.34 | C299R | 0.16 | 0.50 |
| rs4763235 | TAS2R48 | 96.3 | 0.960 | C/G | 0.25 | Noncoding | 0.49 | 0.48 |
| rs2708380 | TAS2R46 | 97.1 | 0.107 | T/A | 0.39 | L228M | 0.08 | 0.09 |
| rs28581524 | TAS2R45 | 91.3 | 0.16 | C/G | 0.24 | H210Q | 0.93 | 0.81 |
| rs2599404 | TAS2R47 | 97.1 | 0.629 | C/A | 0.36 | L252F | 0.42 | 0.88 |
| rs5020531 | TAS2R42 | 96.2 | 0.025 | C/T | 0.25 | S196F | 0.003 | 0.000004 |
| rs41467 | TAS2R1 | 94.9 | 0.291 | G/T | 0.47 | Noncoding | 0.22 | 0.03 |
| rs2234233 | TAS2R1 | 94.5 | 0.809 | C/T | 0.24 | R206W | 0.23 | 0.41 |
| rs1357949 | TAS2R16 | 96.5 | 0.581 | A/G | 0.26 | Noncoding | 0.10 | 0.47 |
| rs6466849 | TAS2R16 | 97.4 | 0.966 | C/T | 0.29 | Noncoding | 0.98 | 0.68 |
| rs860170 | TAS2R16 | 94.9 | 0.089 | A/G | 0.38 | H222R | 0.98 | 0.41 |
| rs978739 | TAS2R16 | 97.7 | 0.014 | A/G | 0.35 | Noncoding | 0.67 | 0.10 |
| rs11763979 | TAS2R3 | 98.4 | 0.227 | G/T | 0.27 | Noncoding | 0.55 | 0.13 |
| rs2233998 | TAS2R4 | 92.7 | 0.052 | T/C | 0.23 | F7S | 0.63 | 0.64 |
| rs2234001 | TAS2R4 | 97.0 | 0.073 | G/C | 0.23 | V96L | 0.52 | 0.56 |
| rs2227264 | TAS2R5 | 95.8 | 0.103 | G/T | 0.23 | S26I | 0.70 | 0.34 |
| rs1726866 | TAS2R38 | 97.0 | 0.430 | T/C | 0.24 | V262A | 0.20 | 0.43 |
| rs4726600 | TAS2R39 | 97.7 | 0.279 | G/A | 0.25 | Noncoding | 0.88 | 0.95 |
| rs534126 | TAS2R40 | 98.0 | 0.622 | C/T | 0.38 | Noncoding | 0.96 | 0.86 |
| rs4595035 | TAS2R60 | 97.7 | 0.616 | C/T | 0.35 | R310R | 0.99 | 0.50 |
| rs1404635 | TAS2R41 | 100 | 0.577 | G/A | 0.16 | T63T | 0.53 | 0.88 |
| rs10278721 | TAS2R41 | 97.7 | 0.653 | C/T | 0.16 | P127L | 0.73 | 0.28 |
Covariates: age, sex, and BMI, with adjustments for family structure. Significant association in bold text. HWE, Hardy-Weinberg equilibrium test; MAF, minor allele frequency; fT3, free triiodothyronine; fT4, free thyroxine.
Recessive model, unadjusted P values.
TABLE 4.
Mean trait values for TAS2R42 SNP rs5020531
| Trait | rs5020531 | ||
|---|---|---|---|
| CC | CT | TT | |
| TSH (μIU/ml) | 2.29 ± 0.36 (n = 442) | 1.65 ± 0.34 (n = 316) | 1.68 ± 0.82 (n = 32) |
| fT3 (pg/dl) | 325.52 ± 7.47 (n = 195) | 328.48 ± 6.88 (n = 138) | 377.53 ± 16.96 (n = 14) |
| fT4 (ng/dl) | 0.95 ± 0.03 (n = 195) | 0.99 ± 0.03 (n = 138) | 1.32 ± 0.08 (n = 14) |
Values expressed as mean ± sem. n = number of subjects; Covariates: age, sex, and BMI, with adjustments for family structure.
DISCUSSION
TAS2Rs are well characterized in the gustatory system, where they function to detect bitter-tasting compounds (3–7). TAS2R expression has also been reported in nongustatory tissues, including those of the gastrointestinal and respiratory systems, where they may mediate physiologic responses to ingested or inhaled toxins (9–17, 39). However, low expression levels, a paucity of validated antisera, and unclear functional homologies between many human and rodent TAS2Rs have made it challenging to demonstrate physiologically relevant expression in extraoral tissues (9). Here, we used a combination of quantitative RT-PCR, a genetically encoded in vivo reporter, and immunolabeling with validated TAS2R38 (25) and α-gustducin (40) antisera to clearly demonstrate that TAS2Rs and α-gustducin proteins are expressed in thyrocytes (Fig. 1). This same reporter mouse was previously used to demonstrate Tas2r expression in colonic goblet cells (41). We also showed that several agonists of several TAS2Rs expressed in thyrocytes can impact TSH-dependent Ca2+ signaling and iodide efflux at physiologically relevant concentrations (27), although the mechanism by which TAS2Rs exert these effects remains unknown. Furthermore, dissimilar agonists exert similar effects (27) (Figs. 1A, 2, and 3). Additionally, the TAS2R38 agonist PROP is ineffective in cells that only express the unresponsive variant of that receptor (Fig. 2F, J). Finally, a TAS2R SNP is significantly associated with elevated serum thyroid hormone levels (Table 2). Together, our results provide compelling evidence for a direct role of TAS2Rs in the modulation of thyroid hormone production.
TSH regulates several distinct physiologic processes in the thyroid, including thyrocyte differentiation and proliferation, thyroglobulin endocytosis from the colloid, iodide influx through basal thyrocyte membranes, and apical iodide efflux from thyrocytes into the follicular lumen (42). This last process is mediated by a TSH receptor-dependent increase in intracellular Ca2+ in many species, including humans (28, 37, 42–44). Iodide is an essential component of T3 and T4; upon efflux into the follicular colloid, iodide is oxidized by thyroid peroxidase (TPO) before it is incorporated into the thyroid hormone precursor thyroglobulin. Therefore, down-regulation of iodide efflux would be expected to reduce the concentration of iodinated thyroglobulin. Interestingly, several TAS2R38 agonists, including PROP and methimazole (27), are also TPO inhibitors (45, 46) and are used clinically to reduce excess thyroid hormone production in cases of hyperthyroidism. The TAS2R agonist effects that we observed are upstream of TPO, as indicated by the inability of PROP (but not other TAS2R agonists) to impact TSH-dependent Ca2+ signaling or iodide efflux in a thyrocyte line that expresses only the nonresponsive TAS2R38 variant. However, these antithyroid drugs may show even greater efficacy in individuals with the responsive TAS2R38 haplotype.
Many TAS2R polymorphisms, which are prevalent in human populations (32), have been linked to differences in behavioral, physiologic, or disease susceptibility phenotypes including taste responsiveness to specific compounds (36, 38, 47–49); eating behaviors (50); risk for glucose dysregulation and/or diabetes (15, 51); upper respiratory infections (16); aging (52); and alcohol use and misuse (53–57). Although some of these associations likely result from altered taste sensitivity, others may reflect changes in extraoral TAS2R functions. For example, individuals with the nontaster haplotype of TAS2R38 (36, 47) were significantly more likely to exhibit respiratory infections by gram-negative bacteria and evidence of impaired mucociliary clearance (16). The functional consequences of the S196F change is unclear as TAS2R42 remains an orphan receptor and S196, which is predicted to reside within the fifth transmembrane domain, is not conserved among TAS2Rs. Even so, our results suggest that individuals expressing nonfunctional TAS2R variants would maintain greater iodide efflux (and thus greater thyroid hormone production) in the presence of cognate TAS2R agonists. This reduced responsiveness to particular TAS2R agonists could result in resistance to the antithyroid effects of certain medications, food compounds, or endogenous regulators, leading to a greater prevalence of hyperthyroidism. It is unknown whether thyrocyte-expressed TAS2Rs are typically the targets of endogenous factors or if they act to mediate responses to ingested or inhaled compounds that are subsequently absorbed into the bloodstream and transported to the thyroid. Clearly, medications taken orally such a PROP and methimazole can reach the thyroid at physiologically relevant concentrations. Additionally, thyrocyte TAS2Rs could mediate adaptive responses to acute infectious thyroiditis (58) through their detection of quorum-sensing factors produced by pathogenic bacteria (11, 16). Regardless of their normal physiologic function, TAS2Rs may be useful therapeutic targets for the regulation of thyroid activity and treatment of comorbidities associated with thyroid dysfunctions. Additionally, the extensive haplotype diversity of TAS2Rs in human populations (32) may offer the potential for personalized therapies tuned to an individual’s TAS2R repertoire. Identification of cognate agonists for TAS2R42, currently an orphan receptor, could be particularly useful in this context. Finally, the ability of many pharmaceuticals to activate TAS2Rs (9, 59) suggests that any new drugs should be specifically tested for off-target actions on the thyroid.
Acknowledgments
This work was supported by the National Institute on Deafness and Other Communication Disorders (Grant R01 DC010110), U.S. National Institutes of Health (NIH); the National Institute of Diabetes and Digestive and Kidney Diseases (Grant P30 DK072488), NIH; an intramural grant from the University of Maryland School of Medicine; and the Deutsche Forschungsgemeinschaft (Grant BO 1743/2).
Glossary
- AFDS
Amish Family Diabetes Study
- AUC
area under the curve
- BMI
body mass index
- fT3
free T3
- fT4
free T4
- GAPDH
glyceraldehyde 3-phosphate dehydrogenase
- GFP
green fluorescent protein
- NIS
Na+/I− symporter
- PROP
6-n-propylthiouracil
- RFU
relative fluorescent unit
- SNP
single nucleotide polymorphism
- SOLAR
Sequential Oligogenic Linkage Analysis Routines
- T3
triiodothyronine
- T4
thyroxine
- TAS2R
type 2 taste receptor
- TPO
thyroid peroxidase
- TSH
thyroid-stimulating hormone
REFERENCES
- 1.Fong P. (2011) Thyroid iodide efflux: a team effort? J. Physiol. 589, 5929–5939 [DOI] [PMC free article] [PubMed] [Google Scholar]
- 2.Congreve M., Langmead C. J., Mason J. S., Marshall F. H. (2011) Progress in structure based drug design for G protein-coupled receptors. J. Med. Chem. 54, 4283–4311 [DOI] [PMC free article] [PubMed] [Google Scholar]
- 3.Behrens M., Meyerhof W. (2011) Gustatory and extragustatory functions of mammalian taste receptors. Physiol. Behav. 105, 4–13 [DOI] [PubMed] [Google Scholar]
- 4.Chandrashekar J., Mueller K. L., Hoon M. A., Adler E., Feng L., Guo W., Zuker C. S., Ryba N. J. (2000) T2Rs function as bitter taste receptors. Cell 100, 703–711 [DOI] [PubMed] [Google Scholar]
- 5.Adler E., Hoon M. A., Mueller K. L., Chandrashekar J., Ryba N. J., Zuker C. S. (2000) A novel family of mammalian taste receptors. Cell 100, 693–702 [DOI] [PubMed] [Google Scholar]
- 6.Mueller K. L., Hoon M. A., Erlenbach I., Chandrashekar J., Zuker C. S., Ryba N. J. (2005) The receptors and coding logic for bitter taste. Nature 434, 225–229 [DOI] [PubMed] [Google Scholar]
- 7.Matsunami H., Montmayeur J. P., Buck L. B. (2000) A family of candidate taste receptors in human and mouse. Nature 404, 601–604 [DOI] [PubMed] [Google Scholar]
- 8.Behrens M., Foerster S., Staehler F., Raguse J. D., Meyerhof W. (2007) Gustatory expression pattern of the human TAS2R bitter receptor gene family reveals a heterogenous population of bitter responsive taste receptor cells. J Neurosci. 27, 12630–12640 [DOI] [PMC free article] [PubMed] [Google Scholar]
- 9.Clark A. A., Liggett S. B., Munger S. D. (2012) Extraoral bitter taste receptors as mediators of off-target drug effects. FASEB J. 26, 4827–4831 [DOI] [PMC free article] [PubMed] [Google Scholar]
- 10.Tizzano M., Cristofoletti M., Sbarbati A., Finger T. E. (2011) Expression of taste receptors in solitary chemosensory cells of rodent airways. BMC Pulm. Med. 11, 3. [DOI] [PMC free article] [PubMed] [Google Scholar]
- 11.Tizzano M., Gulbransen B. D., Vandenbeuch A., Clapp T. R., Herman J. P., Sibhatu H. M., Churchill M. E., Silver W. L., Kinnamon S. C., Finger T. E. (2010) Nasal chemosensory cells use bitter taste signaling to detect irritants and bacterial signals. Proc. Natl. Acad. Sci. USA 107, 3210–3215 [DOI] [PMC free article] [PubMed] [Google Scholar]
- 12.Deshpande D. A., Wang W. C., McIlmoyle E. L., Robinett K. S., Schillinger R. M., An S. S., Sham J. S., Liggett S. B. (2010) Bitter taste receptors on airway smooth muscle bronchodilate by localized calcium signaling and reverse obstruction. Nat. Med. 16, 1299–1304 [DOI] [PMC free article] [PubMed] [Google Scholar]
- 13.Robinett K. S., Deshpande D. A., Malone M. M., Liggett S. B. (2011) Agonist-promoted homologous desensitization of human airway smooth muscle bitter taste receptors. Am. J. Respir. Cell Mol. Biol. 45, 1069–1074 [DOI] [PMC free article] [PubMed] [Google Scholar]
- 14.Wu S. V., Rozengurt N., Yang M., Young S. H., Sinnett-Smith J., Rozengurt E. (2002) Expression of bitter taste receptors of the T2R family in the gastrointestinal tract and enteroendocrine STC-1 cells. Proc. Natl. Acad. Sci. USA 99, 2392–2397 [DOI] [PMC free article] [PubMed] [Google Scholar]
- 15.Dotson C. D., Zhang L., Xu H., Shin Y. K., Vigues S., Ott S. H., Elson A. E., Choi H. J., Shaw H., Egan J. M ., Mitchell B. D., Li X., Steinle N. I., Munger S. D. (2008) Bitter taste receptors influence glucose homeostasis. PLoS ONE 3, e3974. [DOI] [PMC free article] [PubMed] [Google Scholar]
- 16.Lee R. J., Xiong G., Kofonow J. M., Chen B., Lysenko A., Jiang P., Abraham V., Doghramji L., Adappa N. D., Palmer J. N., Kennedy D. W., Beauchamp G. K., Doulias P. T., Ischiropoulos H., Kreindler J. L., Reed D. R., Cohen N. A. (2012) T2R38 taste receptor polymorphisms underlie susceptibility to upper respiratory infection. J. Clin. Invest. 122, 4145–4159 [DOI] [PMC free article] [PubMed] [Google Scholar]
- 17.Shah A. S., Ben-Shahar Y., Moninger T. O., Kline J. N., Welsh M. J. (2009) Motile cilia of human airway epithelia are chemosensory. Science 325, 1131–1134 [DOI] [PMC free article] [PubMed] [Google Scholar]
- 18.Jeon T. I., Seo Y. K., Osborne T. F. (2011) Gut bitter taste receptor signalling induces ABCB1 through a mechanism involving CCK. Biochem. J. 438, 33–37 [DOI] [PMC free article] [PubMed] [Google Scholar]
- 19.Jeon T. I., Zhu B., Larson J. L., Osborne T. F. (2008) SREBP-2 regulates gut peptide secretion through intestinal bitter taste receptor signaling in mice. J. Clin. Invest. 118, 3693–3700 [DOI] [PMC free article] [PubMed] [Google Scholar]
- 20.Foster S. R., Blank K., See Hoe L. E., Behrens M., Meyerhof W., Peart J. N., Thomas W. G. (2014) Bitter taste receptor agonists elicit G-protein-dependent negative inotropy in the murine heart. FASEB J. 28, 4497–4508 [DOI] [PubMed] [Google Scholar]
- 21.Xu J., Cao J., Iguchi N., Riethmacher D., Huang L. (2013) Functional characterization of bitter-taste receptors expressed in mammalian testis. Mol. Hum. Reprod. 19, 17–28 [DOI] [PMC free article] [PubMed] [Google Scholar]
- 22.Gregory Powell J., Wang X., Allard B. L., Sahin M., Wang X. L., Hay I. D., Hiddinga H. J., Deshpande S. S., Kroll T. G., Grebe S. K., Eberhardt N. L., McIver B. (2004) The PAX8/PPARgamma fusion oncoprotein transforms immortalized human thyrocytes through a mechanism probably involving wild-type PPARgamma inhibition. Oncogene 23, 3634–3641 [DOI] [PubMed] [Google Scholar]
- 23.Pfaffl M. W. (2006) Relative quantification. In Real-Time PCR (Dorak M. T., ed.), pp. 63–82, Taylor & Francis, New York [Google Scholar]
- 24.Foster S. R., Porrello E. R., Purdue B., Chan H. W., Voigt A., Frenzel S., Hannan R. D., Moritz K. M., Simmons D. G., Molenaar P., Roura E., Boehm U., Meyerhof W., Thomas W.G. (2013) Expression, regulation and putative nutrient-sensing function of taste GPCRs in the heart. PLoS ONE 8, e64579. [DOI] [PMC free article] [PubMed] [Google Scholar]
- 25.Behrens M., Born S., Redel U., Voigt N., Schuh V., Raguse J. D., Meyerhof W. (2012) Immunohistochemical detection of TAS2R38 protein in human taste cells. PLoS ONE 7, e40304. [DOI] [PMC free article] [PubMed] [Google Scholar]
- 26.Jang H. J., Kokrashvili Z., Theodorakis M. J., Carlson O. D., Kim B. J., Zhou J., Kim H. H., Xu X., Chan S. L., Juhaszova M., Bernier M., Mosinger B., Margolskee R. F., Egan J. M. (2007) Gut-expressed gustducin and taste receptors regulate secretion of glucagon-like peptide-1. Proc. Natl. Acad. Sci. USA 104, 15069–15074 [DOI] [PMC free article] [PubMed] [Google Scholar]
- 27.Meyerhof W., Batram C., Kuhn C., Brockhoff A., Chudoba E., Bufe B., Appendino G., Behrens M. (2010) The molecular receptive ranges of human TAS2R bitter taste receptors. Chem. Senses 35, 157–170 [DOI] [PubMed] [Google Scholar]
- 28.Weiss S. J., Philp N. J., Grollman E. F. (1984) Effect of thyrotropin on iodide efflux in FRTL-5 cells mediated by Ca2+. Endocrinology 114, 1108–1113 [DOI] [PubMed] [Google Scholar]
- 29.Hsueh W. C., Mitchell B. D., Aburomia R., Pollin T., Sakul H., Gelder Ehm M., Michelsen B. K., Wagner M. J., St Jean P. L., Knowler W. C., Burns D. K., Bell C. J., Shuldiner A. R. (2000) Diabetes in the Old Order Amish: characterization and heritability analysis of the Amish Family Diabetes Study. Diabetes Care 23, 595–601 [DOI] [PubMed] [Google Scholar]
- 30.International HapMap Consortium (2005) A haplotype map of the human genome. Nature 437, 1299–1320 [DOI] [PMC free article] [PubMed] [Google Scholar]
- 31.Sherry S. T., Ward M. H., Kholodov M., Baker J., Phan L., Smigielski E. M., Sirotkin K. (2001) dbSNP: the NCBI database of genetic variation. Nucleic Acids Res. 29, 308–311 [DOI] [PMC free article] [PubMed] [Google Scholar]
- 32.Kim U., Wooding S., Ricci D., Jorde L. B., Drayna D. (2005) Worldwide haplotype diversity and coding sequence variation at human bitter taste receptor loci. Hum. Mutat. 26, 199–204 [DOI] [PubMed] [Google Scholar]
- 33.Almasy L., Blangero J. (1998) Multipoint quantitative-trait linkage analysis in general pedigrees. Am. J. Hum. Genet. 62, 1198–1211 [DOI] [PMC free article] [PubMed] [Google Scholar]
- 34.Conneely K. N., Boehnke M. (2007) So many correlated tests, so little time! Rapid adjustment of P values for multiple correlated tests. Am. J. Hum. Genet. 81, 1158–1168 [DOI] [PMC free article] [PubMed] [Google Scholar]
- 35.McLaughlin S. K., McKinnon P. J., Margolskee R. F. (1992) Gustducin is a taste-cell-specific G protein closely related to the transducins. Nature 357, 563–569 [DOI] [PubMed] [Google Scholar]
- 36.Bufe, B., Breslin, P. A., Kuhn, C., Reed, D. R., Tharp, C. D., Slack, J. P., Kim, U. K., Drayna, D., and Meyerhof, W. (2005) The molecular basis of individual differences in phenylthiocarbamide and propylthiouracil bitterness perception. Curr. Biol.15, 322–327 [DOI] [PMC free article] [PubMed] [Google Scholar]
- 37.Corda D., Marcocci C., Kohn L. D., Axelrod J., Luini A. (1985) Association of the changes in cytosolic Ca2+ and iodide efflux induced by thyrotropin and by the stimulation of alpha 1-adrenergic receptors in cultured rat thyroid cells. J. Biol. Chem. 260, 9230–9236 [PubMed] [Google Scholar]
- 38.Soranzo N., Bufe B., Sabeti P. C., Wilson J. F., Weale M. E., Marguerie R., Meyerhof W., Goldstein D. B. (2005) Positive selection on a high-sensitivity allele of the human bitter-taste receptor TAS2R16. Curr. Biol. 15, 1257–1265 [DOI] [PubMed] [Google Scholar]
- 39.Lee R. J., Kofonow J. M., Rosen P. L., Siebert A. P., Chen B., Doghramji L., Xiong G., Adappa N. D., Palmer J. N., Kennedy D. W., Kreindler J. L., Margolskee R. F., Cohen N. A. (2014) Bitter and sweet taste receptors regulate human upper respiratory innate immunity. J. Clin. Invest. 124, 1393–1405 [DOI] [PMC free article] [PubMed] [Google Scholar]
- 40.Yang R., Ma H., Thomas S. M., Kinnamon J. C. (2007) Immunocytochemical analysis of syntaxin-1 in rat circumvallate taste buds. J. Comp. Neurol. 502, 883–893 [DOI] [PubMed] [Google Scholar]
- 41.Prandi S., Bromke M., Hübner S., Voigt A., Boehm U., Meyerhof W., Behrens M. (2013) A subset of mouse colonic goblet cells expresses the bitter taste receptor Tas2r131. PLoS ONE 8, e82820. [DOI] [PMC free article] [PubMed] [Google Scholar]
- 42.Dumont, J., Opitz, R., Christophe, D., Vassart, G., Roger, P. P., and Maenhaut, C. (2011) Ontogeny, anatomy, metabolism and physiology of the thyroid. Available at: http://www.thyroidmanager.org. Accessed Date of access: October 2, 2014
- 43.Raspé E., Dumont J. E. (1994) Control of the dog thyrocyte plasma membrane iodide permeability by the Ca(2+)-phosphatidylinositol and adenosine 3′,5′-monophosphate cascades. Endocrinology 135, 986–995 [DOI] [PubMed] [Google Scholar]
- 44.Weiss S. J., Philp N. J., Grollman E. F. (1984) Iodide transport in a continuous line of cultured cells from rat thyroid. Endocrinology 114, 1090–1098 [DOI] [PubMed] [Google Scholar]
- 45.Nagasaka A., Hidaka H. (1976) Effect of antithyroid agents 6-propyl-2-thiouracil and 1-mehtyl-2-mercaptoimidazole on human thyroid iodine peroxidase. J. Clin. Endocrinol. Metab. 43, 152–158 [DOI] [PubMed] [Google Scholar]
- 46.Crofton K. M. (2008) Thyroid disrupting chemicals: mechanisms and mixtures. Int. J. Androl. 31, 209–223 [DOI] [PubMed] [Google Scholar]
- 47.Kim U. K., Jorgenson E., Coon H., Leppert M., Risch N., Drayna D. (2003) Positional cloning of the human quantitative trait locus underlying taste sensitivity to phenylthiocarbamide. Science 299, 1221–1225 [DOI] [PubMed] [Google Scholar]
- 48.Pronin, A. N., Xu, H., Tang, H., Zhang, L., Li, Q., and Li, X. (2007) Specific alleles of bitter receptor genes influence human sensitivity to the bitterness of aloin and saccharin. Curr. Biol.17, 1403–1408 [DOI] [PubMed] [Google Scholar]
- 49.Allen A. L., McGeary J. E., Knopik V. S., Hayes J. E. (2013) Bitterness of the non-nutritive sweetener acesulfame potassium varies with polymorphisms in TAS2R9 and TAS2R31. Chem. Senses 38, 379–389 [DOI] [PMC free article] [PubMed] [Google Scholar]
- 50.Dotson C. D., Shaw H. L., Mitchell B. D., Munger S. D., Steinle N. I. (2010) Variation in the gene TAS2R38 is associated with the eating behavior disinhibition in Old Order Amish women. Appetite 54, 93–99 [DOI] [PMC free article] [PubMed] [Google Scholar]
- 51.Timpson N. J., Christensen M., Lawlor D. A., Gaunt T. R., Day I. N., Ebrahim S., Davey Smith G. (2005) TAS2R38 (phenylthiocarbamide) haplotypes, coronary heart disease traits, and eating behavior in the British Women’s Heart and Health Study. Am. J. Clin. Nutr. 81, 1005–1011 [DOI] [PubMed] [Google Scholar]
- 52.Campa D., De Rango F., Carrai M., Crocco P., Montesanto A., Canzian F., Rose G., Rizzato C., Passarino G., Barale R. (2012) Bitter taste receptor polymorphisms and human aging. PLoS ONE 7, e45232. [DOI] [PMC free article] [PubMed] [Google Scholar]
- 53.Duffy V. B., Davidson A. C., Kidd J. R., Kidd K. K., Speed W. C., Pakstis A. J., Reed D. R., Snyder D. J., Bartoshuk L. M. (2004) Bitter receptor gene (TAS2R38), 6-n-propylthiouracil (PROP) bitterness and alcohol intake. Alcohol. Clin. Exp. Res. 28, 1629–1637 [DOI] [PMC free article] [PubMed] [Google Scholar]
- 54.Dotson C. D., Wallace M. R., Bartoshuk L. M., Logan H. L. (2012) Variation in the gene TAS2R13 is associated with differences in alcohol consumption in patients with head and neck cancer. Chem. Senses 37, 737–744 [DOI] [PMC free article] [PubMed] [Google Scholar]
- 55.Hayes J. E., Wallace M. R., Knopik V. S., Herbstman D. M., Bartoshuk L. M., Duffy V. B. (2011) Allelic variation in TAS2R bitter receptor genes associates with variation in sensations from and ingestive behaviors toward common bitter beverages in adults. Chem. Senses 36, 311–319 [DOI] [PMC free article] [PubMed] [Google Scholar]
- 56.Wang J. C., Hinrichs A. L., Bertelsen S., Stock H., Budde J. P., Dick D. M., Bucholz K. K., Rice J., Saccone N., Edenberg H. J., Hesselbrock V., Kuperman S., Schuckit M. A., Bierut L. J., Goate A. M. (2007) Functional variants in TAS2R38 and TAS2R16 influence alcohol consumption in high-risk families of African-American origin. Alcohol. Clin. Exp. Res. 31, 209–215 [DOI] [PubMed] [Google Scholar]
- 57.Hinrichs A. L., Wang J. C., Bufe B., Kwon J. M., Budde J., Allen R., Bertelsen S., Evans W., Dick D., Rice J., Foroud T., Nurnberger J., Tischfield J. A., Kuperman S., Crowe R., Hesselbrock V., Schuckit M., Almasy L., Porjesz B., Edenberg H. J., Begleiter H., Meyerhof W., Bierut L. J., Goate A. M. (2006) Functional variant in a bitter-taste receptor (hTAS2R16) influences risk of alcohol dependence. Am. J. Hum. Genet. 78, 103–111 [DOI] [PMC free article] [PubMed] [Google Scholar]
- 58.Franklyn J. A., Boelaert K. (2012) Thyrotoxicosis. Lancet 379, 1155–1166 [DOI] [PubMed] [Google Scholar]
- 59.Levit A., Nowak S., Peters M., Wiener A., Meyerhof W., Behrens M., Niv M. Y. (2014) The bitter pill: clinical drugs that activate the human bitter taste receptor TAS2R14. FASEB J. 28, 1181–1197 [DOI] [PubMed] [Google Scholar]