Abstract
Sterols are essential biological molecules in the majority of life forms. Sterol reductases1 including Delta-14 sterol reductase (C14SR), 7-dehydrocholesterol reductase (DHCR7) and 24-dehydrocholesterol reductase (DHCR24) reduce specific carbon-carbon double bonds of the sterol moiety using a reducing cofactor during sterol biosynthesis. Lamin B Receptor2 (LBR), an integral inner nuclear membrane protein, also contains a functional C14SR domain. Here we report the crystal structure of a Delta-14 sterol reductase (maSR1) from the methanotrophic bacterium Methylomicrobium alcaliphilum 20Z, a homolog of human C14SR, LBR, and DHCR7, with the cofactor NADPH. The enzyme contains 10 transmembrane segments (TM). Its catalytic domain comprises the C-terminal half (containing TM6-10) and envelops two interconnected pockets, one of which faces the cytoplasm and houses NADPH, while the other one is accessible from the lipid bilayer. Comparison with a soluble steroid 5β-reductase structure3 suggests that the reducing end of NADPH meets the sterol substrate at the juncture of the two pockets. A sterol reductase activity assay proves maSR1 can reduce the double bond of a cholesterol biosynthetic intermediate demonstrating functional conservation to human C14SR. Therefore, our structure as a prototype of integral membrane sterol reductases provides molecular insight into mutations in DHCR7 and LBR for inborn human diseases.
Sterols, amphipathic molecules, are widespread in animals, plants, fungi and some prokaryotes and occur in a large variety4 including ergosterol, hopanoids, phytosterol and cholesterol. The most abundant sterol in animals is cholesterol, which does not only play a vital role for maintenance of membrane strength and permeability, but also serves as a precursor for the biosynthesis of steroid hormones5,6. Endogenous biosynthesis is the major source of sterols, and the biosynthetic pathway from water-soluble small metabolites via intermediates of increasing complexity up to water-insoluble sterols encompasses numerous distinct enzymes1,7, many of which contain multiple transmembrane segments. To date, no structure of the integral membrane enzymes involving sterol biosynthesis has been determined. Sterol reductases1, integral membrane enzymes including C14SR, DHCR7, and DHCR24, can reduce specific carbon-carbon double bonds of the sterol moiety using a reducing cofactor at distinct steps in sterol and cholesterol biosynthesis (Extended Data Fig. 1).
Curiously, the multifunctional lamin B receptor2 (LBR), located in the inner nuclear envelope membrane, also contains a domain in its C-terminal portion that is highly homologous to human sterol reductase8 (Extended Data Fig. 2). Indeed, cDNA of human LBR complements reductase gene (ERG24) deletion in yeast, in support of the idea that LBR can substitute for sterol reductase activity9. Mutations in LBR and DHCR7 lead to various human genetic diseases1 (Pelger-Huet Anomaly10 (PHA) and Greenberg skeletal dysplasia11 (HEM) related to LBR; Smith-Lemli-Opitz syndrome12,13 (SLOS) related to DHCR7). However, structural knowledge and, hence, a mechanistic understanding of these important membrane-embedded enzymes is thus far lacking.
To gain more insights into sterol reductases, we set out to determine the crystal structure of one of its family members. In screening for crystal forming representatives of integral membrane sterol reductases, we found a homolog from the methanotrophic bacterium Methylmicrobium alcaliphilum 20Z, maSR1, which shares 38-45% sequence identity and 51-62% similarity to human C14SR, DHCR7 and the C-terminal portion of LBR (Extended Data Fig. 2). Methylomicrobium alcaliphilum 20Z is an aerobic methanotroph, the cell membrane of which contains significant levels of sterols and hopanoids14.
Expression of maSR1 complements the deletion of the Delta-14 sterol reductase gene (ERG24) in yeast, indicating that maSR1 is a bona fide sterol reductase (Extended Data Fig. 3, lanes 1-3). To test whether maSR1 can function in human cholesterol biosynthesis, we preformed the sterol reductase activity assay of maSR1 after expression in human HEK293 cells and employed 5α-cholesta-8,14-dien-3β-ol (C27Δ8,14), a human cholesterol biosynthetic intermediate analogue15-17 of 4,4-dimethylcholesta-8,14-dien-3β-ol (C29Δ8,14, Extended Data Fig. 1) as the substrate (Fig. 1a). This assay has been used for initial identification15 and further investigations16,17 of mammalian sterol reductases. The catalytic efficiency of maSR1 is about 75% of that of human C14SR (Fig. 1b, c). We conclude that maSR1 can function like human C14SR and specifically reduce the double bond of the approximate cholesterol biosynthetic intermediate.
Figure 1. Delta-14 reductase activity of maSR1.
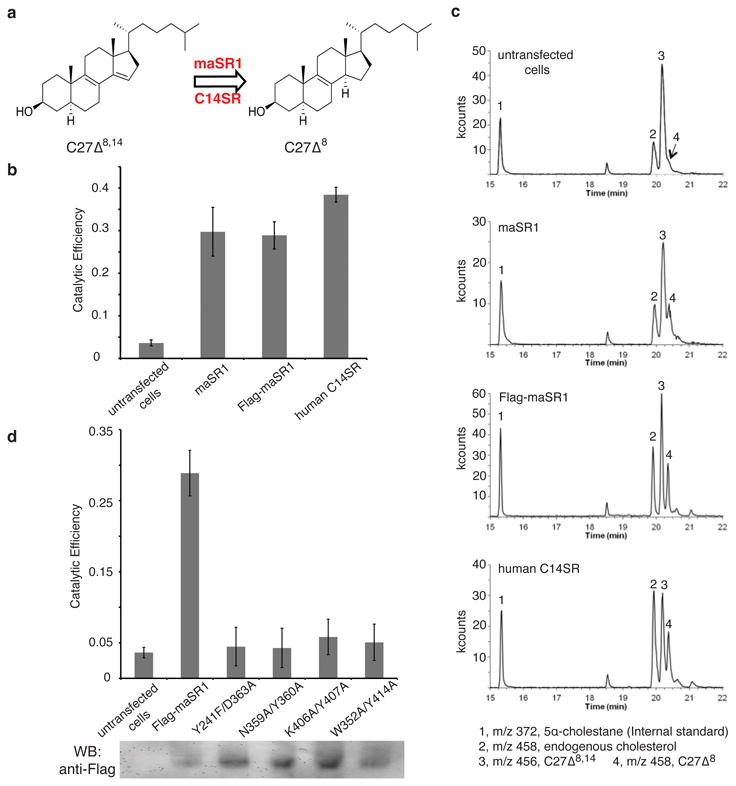
a, Reaction catalyzed by transfected human C14SR or maSR1 in which 5α-cholesta-8,14-dien-3β-ol (C27Δ8,14) is converted to 5α-cholesta-8-en-3β-ol (C27Δ8). b, The catalytic efficiency (calculated as the integrated GC-MS chromatogram peak area ratio C27Δ8/(C27Δ8,14 + C27Δ8)) in untransfected HEK293 cells and cells transfected with maSR1, Flag-maSR1 and human C14SR is 3.6%± 0.7%; 29.7%±5.7%; 28.9%±3.2% and 38.4%±1.8%, respectively. c, GC-MS chromatograms of Delta-14 sterol reductase assay. Peak 1, m/z 372, 5α-cholestane (an internal standard); peak 2, m/z 458, endogenous cholesterol; peak 3, m/z 456, C27Δ8,14; peak 4, m/z 458, C27Δ8. The reduced products (peak 4) were detected in maSR1, Flag-maSR1, C14SR but little in untransfected cells. m/z, the mass-to-charge ratio. d, The catalytic efficiency of Flag-maSR1 mutants. All mutants expressed by anti-Flag western blot detection (data not shown). Error bars, s.d. of two independent experiments.
We crystallized maSR1 in space group P1 with NADPH. The diffraction of the crystal is anisotropic (Method and Extended Data Fig. 4). The structure was determined by selenium-based single-wavelength anomalous dispersion (SAD) and refined at 2.74Å resolution (Extended Data Tables 1 and 2). Introduction of additional selenium anomalous scatterers by selective mutation, and preparation of platinum derivatives confirmed the correctness of the atomic model (Extended Data Figs. 5 and Table 3).
Two maSR1 molecules (rotated by180°) pack into a crystallographic dimer that forms the asymmetric unit. The dimensions of the maSR1 monomer are 50Å×45Å×58Å. The enzyme contains 10 transmembrane helices (TM1-10). Based on the “positive inside rule” for membrane proteins18, we assigned the N- and C-termini to face the cytoplasm, consistent with the biochemically determined topology of the yeast homolog ERG2419. There are two short anti-parallel β-sheet regions (β1-4) interspersed in the cytoplasm-exposed loops as well as two short α-helices, designated α1 and α2 (Fig. 2a and Extended Data Fig. 2). Residues 1-23 and 162-176 (part of the loop between TM4-5) are not visible in the electron density map and therefore presumed to be disordered. The binding pocket for NADPH could be localized to the C-terminal domain (TM6-10) and a cavity with an unidentified ligand density facing the lipid bilayer is surrounded by TM7 and TM10 (Fig. 2b, c).
Figure 2. The molecular architecture of maSR1.
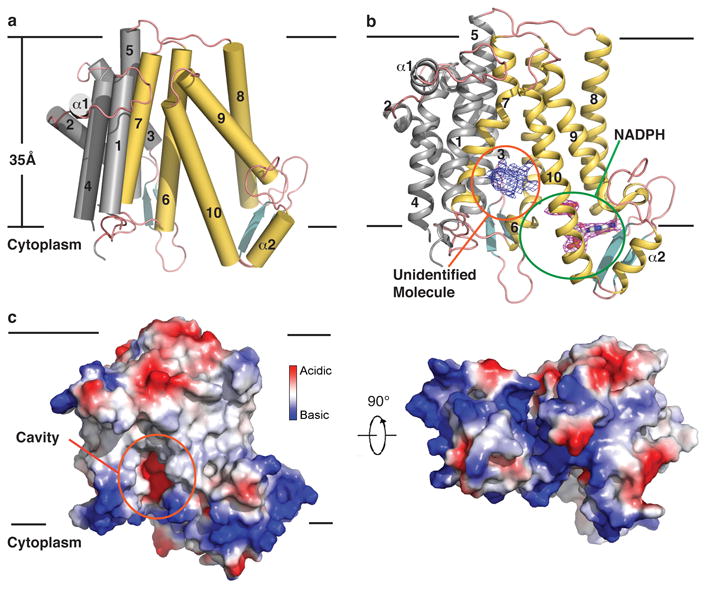
a, Overall structure of maSR1 viewed parallel to the membrane. The ten TMs are divided into an N-terminal half (TM1-5 and α1, gray) and a C-terminal half (TM 6-10 and α2, yellow). The two black lines show approximate location of the lipid bilayer. b, maSR1 structure cartoon with NADPH shown by stick representation. mFo-DFc map for an unidentified molecule (blue mesh) and SA-Omit map (Fo-Fc densities) for NADPH (magenta mesh) both contoured at σ level 2.0. c, The cavity is indicated by an orange circle in an electrostatic surface representation. The right and left panels represent two perpendicular views.
Except for the ribose-nicotinamide moiety, the remainder of the NADPH molecule could be clearly identified (Extended Data Fig. 6a, b). The nicotinamide ring is the hydrogen donor in the transient interaction with the substrate. In our structure, the absence of a sterol substrate probably fails to coordinate the nicotinamide ring and hence causes it to be disordered. By contrast, the other half of the NADPH molecule is well defined in the electron density and stabilized by a hydrogen bond from the centrally located Tyr414 of α2 (Fig. 3a). The remainder of the NADPH pocket is lined with residues from TM9 and TM10 as well as two residues from TM8 (Fig. 3a). The NADPH pocket extends further around TM10 providing enough space to house the nicotinamide-ribose moiety of NADPH (Extended Data Fig. 6c). We mutated several residues in the NADPH binding pocket of maSR1 (Extended Data Fig. 2). These mutations led to the loss of catalytic activity, as judged by the human Delta-14 sterol reductase activity assay (Fig. 1d) and by the ERG24 complementation assay in yeast (Extended Data Fig. 3, lanes 4, 6 and 7).
Figure 3. NADPH, putative sterol binding pockets and homology modeling with steroid 5β-reductase.
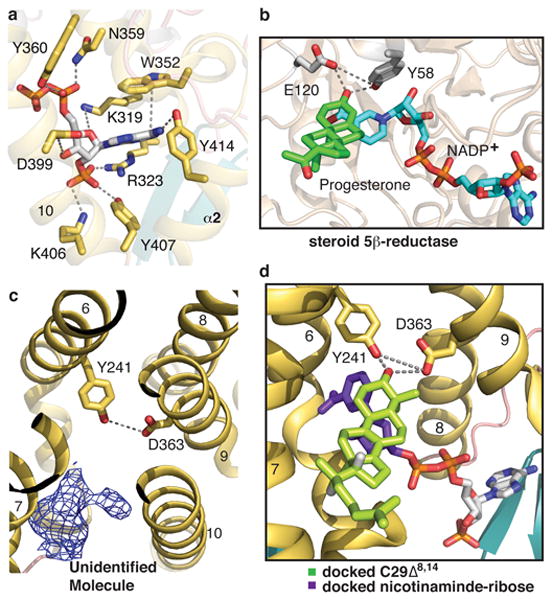
a, Close-up view of the NADPH binding pocket. NADPH is shown in stick representation with the phosphates in red. The interactions between NADPH and maSR1 are indicated by dash lines. b, Close-up view of the active pockets of steroid 5β-reductase (PDB 3COT). Tyr58 and Glu120 clamp the β3 carbonyl oxygen of progesterone. c, The putative sterol binding site is accessible from the lipid bilayer. An unidentified ligand density is shown with mFo-DFc map (blue mesh) at σ level of 2.5. d, Modeling of maSR1 putative sterol binding pocket. Based on the active sites of steroid 5β-reductase, the missing ribose-nicotinamide moiety (purple) of NADPH was docked into the NADPH pocket and C29Δ8,14 (light green) modeled into the pocket of the maSR1 structure.
The working principle of reductases is to bring nicotinamide of NADPH into close proximity to the substrate leading to carbon-carbon double bond reduction. In analogy to the catalytic pockets of soluble steroid 5β-reductase3 (AKR1D1, PDB 3COT), bound to both progesterone and NADP+ (Fig. 3b), the lipid bilayer-facing cavity of maSR1 is likely a candidate for sterol binding pocket (Fig. 3c). Notably, the sterol binding pockets of both enzymes contain a ‘signature’ motif forming triangular hydrogen bonds that coordinate the β3 hydroxyl of either sterol or steroid; for maSR1, this signature motif includes Tyr241 bonded to Asp363 (Fig. 3c); and for steroid 5β-reductase, Tyr58 bonded to Glu120 (Fig. 3b). The distance between Tyr58 and Glu120 (4.1Å) in steroid 5β-reductase is similar to that of Tyr241 and Asp363 (3.9Å) in maSR1. The maSR1 double mutant Y241F/D363A loses sterol reductase function in the human Delta-14 sterol reductase activity assay (Fig. 1d) and the yeast ERG24 complementation assay (Extended Data Fig. 3, lane 5). For the putative sterol binding pocket, extensive hydrophobic contacts between the highly conserved Trp274 and Tyr387 residues enforce the interaction of TM7 and TM10 (Extended Data Fig. 6d). Interestingly, in each monomer of the crystallographic dimer there is extra electron density of an unidentified molecule in front of the cavity (Fig. 2b and 3c). Although the molecular identity of this density could not be unambiguously determined (maybe an endogenous molecule from E.coli or the detergent used for purification), it may represent a substrate for the putative sterol-binding pocket. We modeled that two binding pockets bring the reducing end of NADPH into close proximity to the sterol (steroid) carbon-carbon double bond to be reduced (Fig. 3d) in analogy to the AKR family enzymes (aldo-keto reductase, e.g. AKR1C3 and AKR1C2) involved in human steroidgenesis20.
Due to the high sequence homology with human LBR and human DHCR7, we generated structural models based on maSR1 to highlight disease-related mutations (Fig. 4). The PHA/HEM related mutations of LBR and the SLOS related mutations of DHCR7 could almost entirely be mapped to the sterol reductase catalytic domain affecting the cofactor binding or sterol entry/binding sites. The similarities in pathogenesis between PHA/HEM and SLOS could therefore arise from a defect in sterol reduction.
Figure 4. Models of human LBR and human DHCR7.
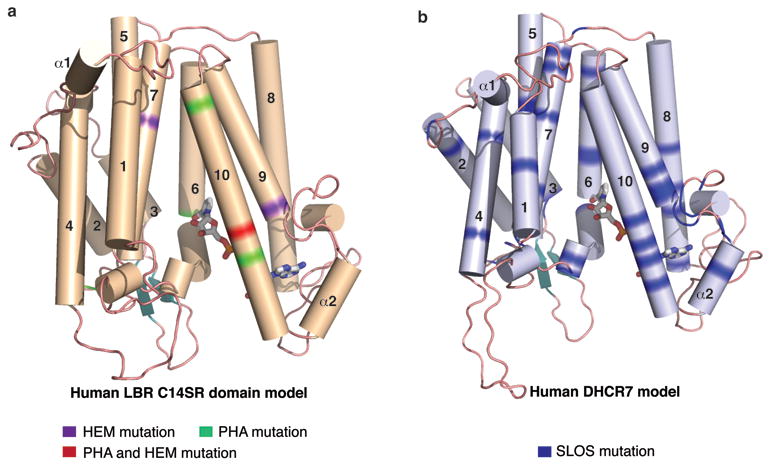
a, Human LBR model and the distribution of PHA and HEM mutations in green and purple, respectively. b, Human DHCR7 model and the distribution of SLOS mutations in blue. The cofactor NADPH (gray) is shown in stick representation.
Intriguingly, substrate recognition for sterol reductases is not very specific. maSR1 could reduce both the double bond of C27Δ8,14 (Fig. 1b), and of the yeast sterol substrate ergosta-8,14-dien-ol (Extended Data Fig. 3). This is consistent with previous observations for LBR: it can reduce C27Δ8,14 (ref. 16), complement C14SR function in C14SR-/- mice21 and also reduce different yeast sterol substrates9. Finally, our structure also provides insights into the function of LBR. A DALI search for structural homologues of maSR1 shows no similar entry for the entire maSR1 structure. However, it identified the membrane-embedded isoprenylcysteine carboxyl methyltransferase22 (ICMT, PDB 4A2N) as the closest entry for the TM6-10 segments of maSR1 (Extended Data Fig. 7). The function of ICMT, which recognizes and then carboxymethylates the farnesylated cysteine of its substrate, points towards a similar role of the C14SR domain of LBR, which may recognize the farnesylated cysteine of either Prelamin A or Lamin B as the ligand23.
Methods
Protein expression and purification
We expressed a homolog of eukaryotic sterol reductases from the methanotrophic bacterium Methylomicrobium alcaliphilum 20Z (maSR1, GI: 503913803). Its cDNA was cloned into pET-21b (Novagen) with an N-terminal 8-His tag. The transformed C43(DE3) (Lucigen) cells were grown to an optical density of 1.0 at A600 nm and induced with 0.2mM isopropyl-β-D-thiogalactopyranoside (IPTG). Cells were disrupted using a French Press with 2 passes at 15,000 psi, in a buffer A containing 25mM Tris-Cl, pH 8.0, and 150mM NaCl. After a low speed centrifugation, the resulting supernatant was centrifuged at high speed to sediment a membrane fraction, which then was incubated in buffer A with 2% (w/v) n-Dodecyl-β-D-maltopyranoside (DDM, Anatrace) for 1 hour at 4 °C. The lysate was centrifuged again and the supernatant was loaded onto Ni2+-NTA affinity column (Qiagen). After washing twice, the protein was eluted with 25mM Tris-Cl, pH8.0, 150mM NaCl, 300mM imidazole, and 0.1% DDM, and concentrated by centricon for subsequent gel filtration (Superdex-200, GE Healthcare) in buffer A with 0.4% (w/v) n-Nonyl-β-D-Glucopyranoside (β-NG, Anatrace). The peak fraction was collected for crystallization. All mutations were generated using two-step PCR. Selenomethionine (Se-Met) labeled protein was purified similarly with the exception that 1mM Tris [2-carboxyethyl] phosphine (TCEP) was included during the purification process.
Crystallization
Before crystallization, the protein solution was incubated with 2mM NADPH (Sigma-Aldrich). Crystals were grown at 20°C by the hanging-drop vapor-diffusion method. The crystals appeared after 5 days in the well buffer containing 0.1M Tris-Cl pH 7.0, 0.2M NH4Ac, 30% (v/v) Pentaerythritol ethoxylate (15/4 EO/OH). DDM was added into crystallization buffer at 1% (v/v) final concentration to improve diffraction. Selenomethionine (Se-Met) labeled protein was crystallized in the same buffer supplemented with 6mM DTT. Platinum derivatives were obtained by soaking native crystals for 12 hours in mother liquor plus 10 mg/ml K2Pt(NO2)4. All crystals were directly flash-frozen in a cold nitrogen stream at 100 K.
Data collection and structure determination
The data were collected at National Synchrotron Light Source (NSLS) beamline X29. All data sets were processed using HKL200024. Owing to the anisotropic diffraction properties, the outlier reflections were rejected based on extreme-value Wilson statistics using the program XTRIAGE25 in the PHENIX package26. The anomalous signal in the SeMet-derivative data was further magnified with the local-scaling algorithm using the program SOLVE27. Then, the selenium sites were determined using the program SHELXD28. The identified sites were refined and the initial phases were generated in the program PHASER29 with the SAD experimental phasing module. Two-fold NCS averaging along with solvent flattening and histogram matching was performed using DM30. The initial model was built in COOT31 manually. The structure was refined with PHENIX.REFINE26. Model validation was performed with MolProbity32. Introduction of additional selenium anomalous scatterers by selective mutation, and preparation of platinum derivatives confirmed the correctness of the atomic model.
The homology models of human LBR and human DHCR7 was generated by the program MODELLER33 on the basis of the structure of maSR1 in which the N-terminal regions (1-200 of LBR and 1-58 of DHCR7) were excluded because of low sequence conservation (Extended Data Fig. 2). All figures were generated using the program PyMOL (http://www.pymol.org/).
Yeast reductase complementation assay
Wild-type and mutant maSR1 and scERG24 were subcloned into the URA3 shuttle vector pCM190 (Euroscarf, Germany). The plasmids were introduced in ERG24 deficient Saccharomyces cerevisiae strain Y11164 (Euroscarf) by electroporation. A single colony was picked from a URA− selective plate. For the yeast rescue assay, the yeast was grown on URA− plates either in the absence or the presence of sub-inhibitory concentrations of cycloheximide (20 ng/ml) at 30°C for 24 to 48 hours. The results were confirmed by 3 independent experiments with different colonies.
Delta14-reductase assay
The cDNA encoding human Delta-14 sterol reductase (C14SR) was subcloned into pCMV-SPORT6 (Open Biosystems). Wild type and mutant maSR1 were subcloned into pEGFP-N1 (Clontech) without the EGFP-tag. HEK293 cells were grown in a 5% CO2 incubator at 37°C in DMEM supplemented with 10% fetal bovine serum, 2 mM L-glutamine, 100 U/mL penicillin, and 0.1 mg/mL streptomycin. Cells were cultured in 10-cm Petri dishes to 80% confluence and transfected with the plasmids, using Lipofectamine 2000 (Life Technologies). After 48 hours, transfected cells were recovered and the washed cell pellet was resuspended in PBS containing complete protease inhibitor cocktail (Sigma-Aldrich). Cells were lysed by sonication three times for 10 seconds on ice. After a low speed centrifugation, the resulting supernatant was ultracentrifuged to sediment a membrane fraction. The isolated membrane fraction was resuspended in 10 mM KPO4/0.5 mM EDTA (pH 7.4) and freezed in aliquots for further analyses. Protein concentration was determined by Bradford method, using BSA as a standard. Proteins of the membrane fraction were separated by SDS-PAGE, blotted on PVDF and probed with mouse monoclonal anti-FLAG M2 (Sigma-Aldrich) and peroxidase-conjugated goat anti-mouse (Santa Cruz). The protein was detected using Super Signal West Pico Chemiluminescent Substrate (Pierce).
Delta-14 reductase activity was assayed in the membrane fractions obtained from transfected cells (0.25 mg protein per assay) using 5α-cholesta-8,14-dien-3β-ol (C27Δ8,14) as a substrate15-17. After the addition of 5α-cholestane (5 μg) as an internal standard, sterols were extracted with petroleum ether, desiccated under nitrogen stream and converted to trimethylsilyl derivatives using N,O-Bis (trimethylsilyl) trifluoroacetamide (BSTFA) and pyridine (1:1, v/v). Gas chromatography–mass spectrometry (GC-MS) analysis was performed in multiple ion detection mode using a Varian GC-MS 2000 apparatus with a Varian CP-Sil8 CB low bleed capillary column. The trimethylsilylation of sterol products yields a molecular mass increased 72 Dalton. Sterol retention times were: 15.31 min, 5α-cholestane (m/z 372); 19.90 min, cholesterol (m/z 458); 20.16 min, 5α-cholesta-8,14-dien-3β-ol (C27Δ8,14, m/z 456); 20.34 min, 5α-cholesta- 8-en-3β-ol (C27Δ8, m/z 458). Delta14-reductase catalytic efficiency is calculated as the peak area ratio C27Δ8/(C27Δ8,14 + C27Δ8). The C27Δ8 sterol was undetectable at zero incubation time.
Extended Data
Extended Data Fig. 1.
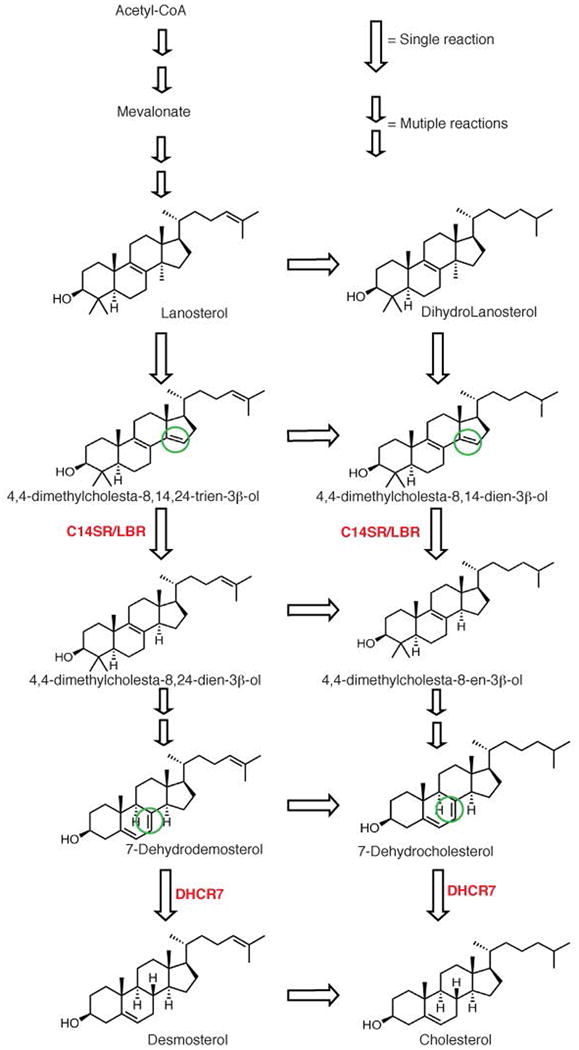
Cholesterol biosynthesis pathway1 and sterol reductase family. Acetyl-CoA is the precursor for cholesterol biosynthesis. After several reactions, the intermediate lanosterol is synthesized. Conversion of lanosterol to cholesterol (Bloch pathway) involves many reactions, some of which are catalyzed by C14SR, LBR and DHCR7 (maSR1 homologues, in red). C14SR, LBR and DHCR7 are homologues of NADPH-dependent reductases that catalyze the reduction of the sterol double bonds indicated in the green circles.
Extended Data Fig. 2.
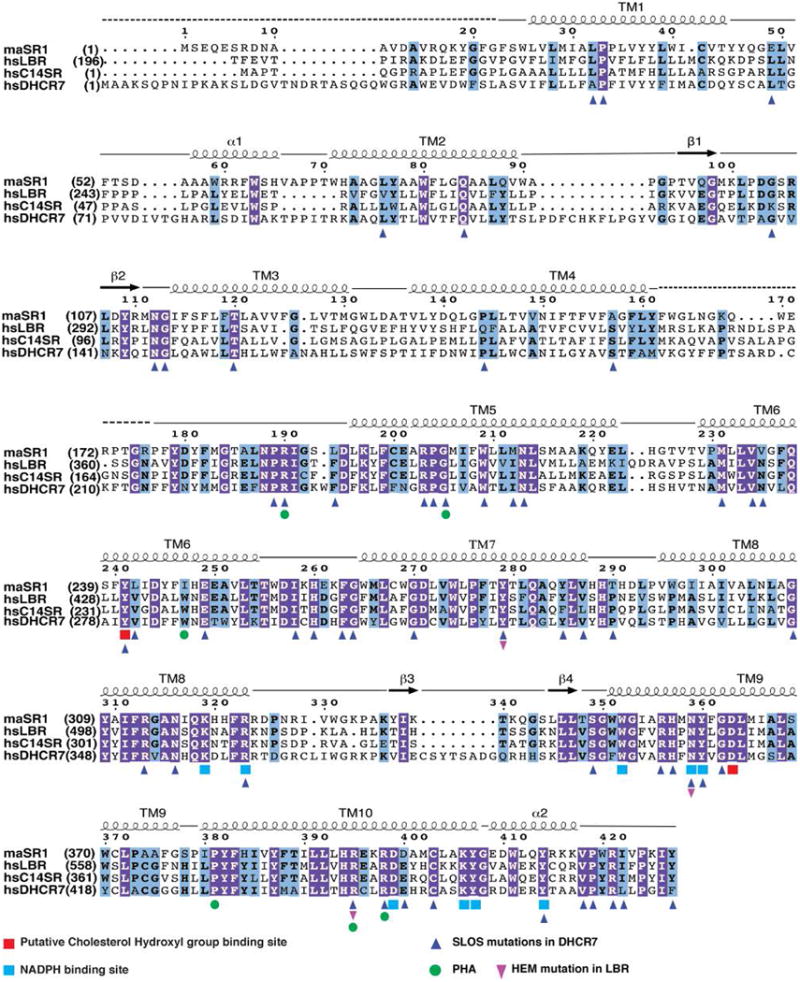
Sequence alignment of maSR1 with human C14SR, DHCR7 and C-terminal domain of LBR. Secondary structural elements of maSR1 are indicated above the sequences. Disordered regions in the maSR1 structure are shown by a dashed line. Invariant amino acids are highlighted in blue (invariant in 3 of 4 proteins) and purple (invariant in all proteins). Putative cholesterol hydroxyl group binding sites are highlighted in red, NADPH binding sites are highlighted in cyan. Human disease mutations are also highlighted by different symbols. Sequence alignment was carried out using ClustalW34.
Extended Data Fig. 3.
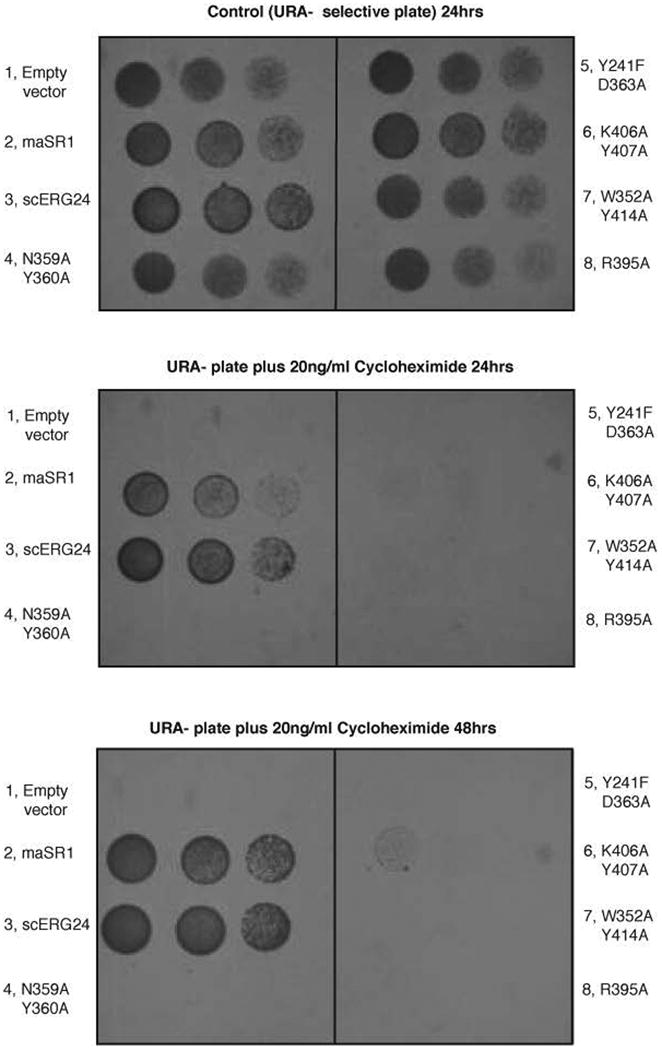
Yeast complementation assay. maSR1 can rescue the growth of a Saccharomyces cerevisiae Delta-14 sterol reductase ERG24 (yeast maSR1 homolog) deletion strain (ΔERG24). ΔERG24 yeast expressing wild-type maSR1, scERG24 and mutated maSR1 from a URA3 shuttle vector can grow under URA− selection (upper panel). Growth of yeast expressing maSR1, scERG24 and various mutated maSR1 versions under in the presence of sub-inhibitory concentrations of cycloheximide (20ng/ml) for 24 to 48 hours (lower panel). The yeast expressing maSR1 or scERG24 is able to grow in the presence of cycloheximide. R395A (lane 8) corresponds to R583Q in LBR which has been reported to lead to loss of activity in yeast35. Results are representative of three independent experiments.
Extended Data Fig. 4.
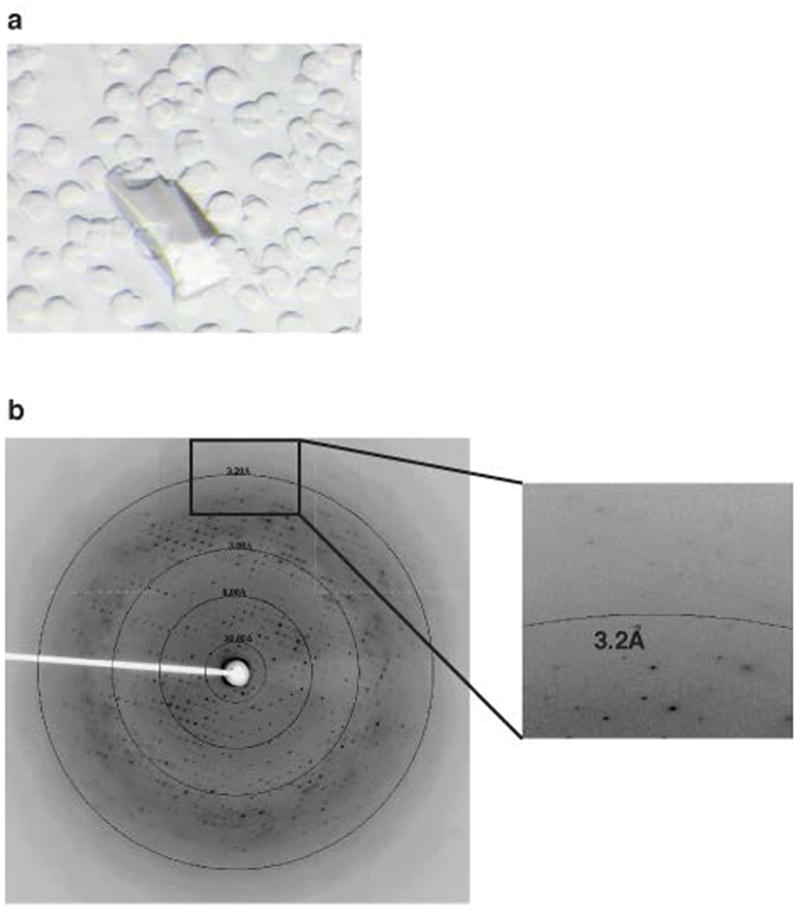
maSR1 crystal and X-ray diffraction image. a, Photograph of maSR1 crystal. b, A representative X-ray diffraction image of maSR1 crystals with various resolution rings indicated by the circles.
Extended Data Fig. 5.
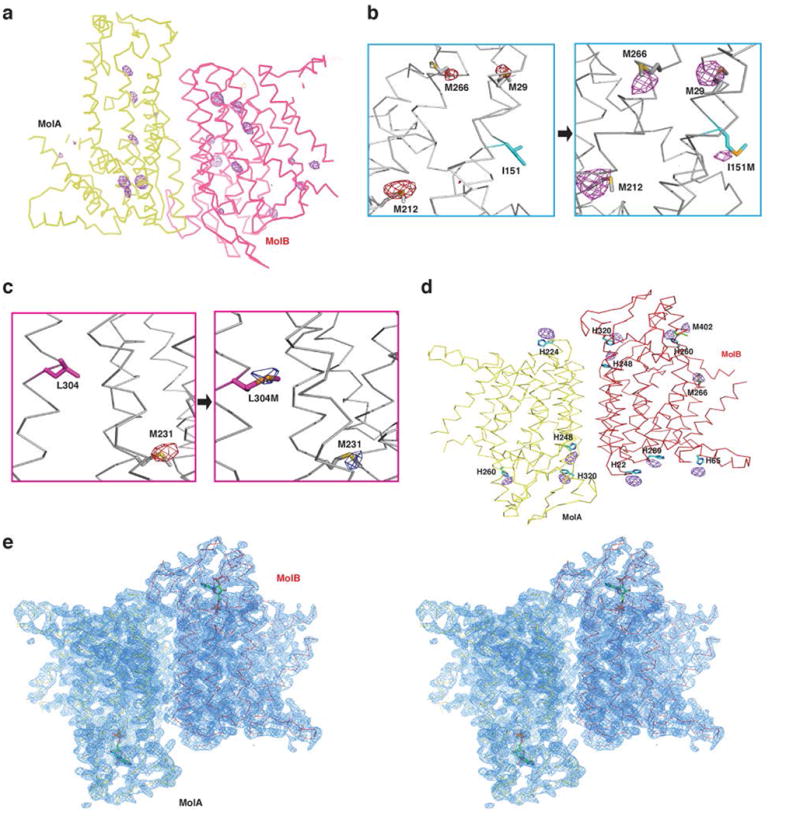
Anomalous difference Fourier electron density. a, Overview of the anomalous difference Fourier map for selenium atoms in an asymmetric unit. The electron density is contoured at 4.5σ (purple mesh). b, Examination of the atomic model in TM4 by selenium anomalous difference signals. Left panel shows wild type Se-Met anomalous difference signals, right panel shows mutated Se-Met anomalous difference signals at 3σ (purple mesh). c, Examination of the atomic model in TM8 by selenium anomalous difference signals. Left panel shows wild type Se-Met anomalous difference signals, right panel shows mutated Se-Met anomalous difference signals at 3σ (blue mesh). d, A view of the anomalous difference Fourier map for platinum atoms in an asymmetric unit. The electron density is contoured at 3σ (purple mesh). There are 4 platinum atoms binding to histidine residues in Molecule A (yellow), but there are 8 platinum atoms binding to 6 histidine and 2 methionine residues in Molecule B (red). e, An overall view of the 2Fo-Fc electron density, contoured at 2σ, in one asymmetric unit.
Extended Data Fig. 6.
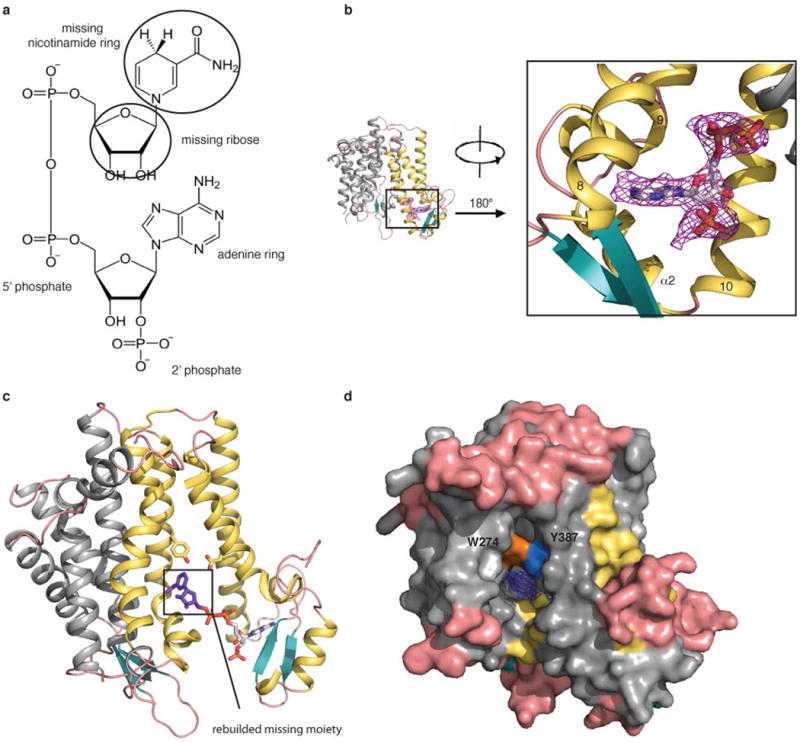
NADPH binding pocket and interaction between Trp274 and Tyr387 of maSR1. a, The structure of NADPH with the missing moiety in the maSR1 structure indicated in the black circles. b, Overview of the NADPH-bound maSR1. SA-Omit map (Fo-Fc densities, magenta mesh) for NADPH contoured at σ level 2.0. The right panel is an enlargement of the left panel (same orientation as Fig. 2a), rotated by 180°. c, The rebuilded missing moiety (purple) of NADPH in maSR1. d, The surface representation shows Trp274 (orange) and Tyr387 (blue) just located in the back of the sterol binding pocket. mFo-DFc map for an unidentified ligand (blue mesh) contoured at 2σ.
Extended Data Fig. 7.
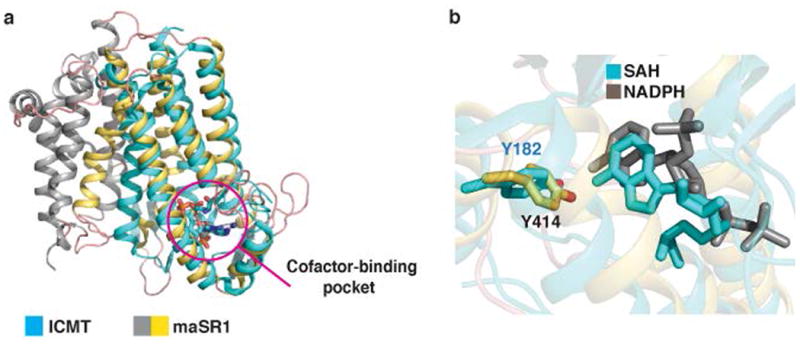
Comparison of maSR1 structure with ICMT structure. a, A comparison of maSR1 (gray and yellow) and ICMT22 (cyan) structure with SAH bound (PDB 4A2N). DALI search36 shows the closest entry (Z-score of 7.5) to maSR1 is the structure of isoprenylcysteine carboxyl methyltransferase (ICMT) consisting of 5 transmembrane helices, which had 193 Cα atoms aligned to maSR1 (TMs 6-10 and α2) with RMSD of 2.8Å. Both proteins have a similar cofactor-binding pocket (magenta circle), although the sequence conservation is low. b, Comparison of NADPH and SAH binding pockets of maSR1 (gray) and ICMT (cyan). The orientation of adenine-ribose moiety of SAH and NAPDH is similar with respect to the coordinating tyrosine residues in the cofactor pockets of these two enzymes.
Extended Data Table 1.
Data collection and refinement statistics.
| Native | Sc-SAD | |
|---|---|---|
| Wavelength (Å) | 1.0750 | 0.9791 |
| Space group | P1 | P1 |
| Unit cell (Å)(a,b,c; α,β,γ) | 74.81, 75.88, 80.27: 64.96, 89.95, 86.30 | |
| Resolution (Å) | 50~2.74 (2.84~2.74) | 50~3.3 (3.42~3.3) |
| Rmerge (%) | 4.1 (41.5) | 12.0 (64.6) |
| I/σI | 21.1 (1.4) | 20.4 (1.7) |
| Completeness* (%) | 74.8 (28.5) | 83.0 (53.0) |
| Number of measured reflections | 63,092 | 136,260 |
| Number of unique reflections | 30,595 | 19,876 |
| Redundancy | 2.1 (1.9) | 6.9 (5.4) |
| Wilson B factor (Å2) | 76.7 | 85.1 |
|
| ||
| Rwork / Rfree (%) | 23.29 / 28.37 | |
| Molecules in ASU | 2 | |
| Number of atoms / B-factor: | ||
| All atoms | 6487 / 89.89 | |
| Main chain | 3128 / 89.13 | |
| Side chain | 3297 / 90.60 | |
| Other entities | 62 / 90.56 | |
| Ramachandran plot (%): | ||
| Favored/Allowed/Disallowed | 90.8/9.2/0 | |
| RMS-deviation in: | ||
| Bond distances (Å) | 0.013 | |
| Bond angles (°) | 1.646 | |
see Extended Data Table 2 of the native data completeness of each shell.
Values in parentheses are for the highest resolution shell. Rfree was calculated with 5% of the reflections selected in the thin shell.
Extended Data Table 2.
Native data completeness of each shell.
| Resolution (Å) | Completeness (%) |
|---|---|
| 50.00 – 6.09 | 95 |
| 6.09 – 4.83 | 98 |
| 4.83 – 4.23 | 91 |
| 4.23 – 3.84 | 98 |
| 3.84 – 3.56 | 97 |
| 3.56 – 3.35 | 89 |
| 3.35 – 3.19 | 73 |
| 3.19 – 3.05 | 60 |
| 3.05 – 2.93 | 49 |
| 2.93 – 2.83 | 37 |
| 2.83 – 2.74 | 28 |
|
| |
| Overall | 74.8 |
Extended Data Table 3.
Data collection statistics for the maSR1 mutants I151M, L304M, and Pt-derivatives.
| Data Set | I151M | L304M | Pt-derivatives |
|---|---|---|---|
| Wavelength (Å) | 0.9791 | 0.9791 | 1.0717 |
| Spaee group | P1 | P1 | P1 |
| Unit cell (Å) (a,b,c; α,β,γ) | 74.77, 75.38, 79.75; 65.39, 89.86, 86.19 | 74.80, 76.81, 81.37; 63.69, 90.171, 86.67 | 78.63, 75.00, 74.48; 94.20, 65.88, 90.80 |
| Resolution (Å) (outer shell) | 50~3.2 (3.31~3.2) | 50~4.3 (4.45~4.3) | 50~3.51 (3.64~3.51) |
| Rmerge (%) | 8.4 (53.8) | 17.3 (81.5) | 13.1 (79.3) |
| I/σ (outer shell) | 24.0 (2.2) | 7.3 (1.2) | 12.8 (1.1) |
| Completeness (%) | 86.9 (59.0) | 81.2 (68.1) | 82.2 (49.7) |
| Number of measured reflections | 197,021 | 56,642 | 102,898 |
| Number of unique reflections | 22,484 | 8,813 | 15,845 |
| Redundancy | 8.9 (7.5) | 6.4 (5.1) | 6.5 (4.7) |
Values in parentheses are for the highest resolution shell.
Acknowledgments
We thank W. Shi and H. Robinson at National Synchrotron Light Source (NSLS) beamline X29 and N. Sukumar at Advanced Photon Source (APS) beamline 24-ID-E for on-site assistance and J. Wang for support with the structure determination. We also thank L. Gatticchi and B. Sebastiani for assistance with the sterol reductase assays, and E. Coutavas, E. Debler, H. Shi for constructive comments in manuscript preparation. The C27Δ8,14 substrate was a gift to R.Roberti by G. Galli, University of Milano, Italy. This work was supported by funds from the Rockefeller University and the Howard Hughes Medical Institute. X. Li is supported by C.H. Li Memorial Scholar Fund fellowship of the Rockefeller University.
Footnotes
Author Contributions: X.L. designed the research; X.L. performed structural biological study; X.L. and R.R. performed sterol reductase activity assays; X.L., R.R. and G.B. contributed to data analysis and manuscript preparation; X.L. and G.B. wrote the manuscript.
Author Information: Coordinates and structure factors for maSR1 are deposited in the Protein Data Bank under accession code 4QUV. Reprints and permissions information is available at www.nature.com/reprints. The authors declare no competing financial interests. Readers are welcome to comment on the online version of the paper.
References
- 1.Porter FD, Herman GE. Malformation syndromes caused by disorders of cholesterol synthesis. Journal of Lipid Research. 2011;52:6–34. doi: 10.1194/jlr.R009548. [DOI] [PMC free article] [PubMed] [Google Scholar]
- 2.Worman HJ, Yuan J, Blobel G, Georgatos SD. A lamin B receptor in the nuclear envelope. Proceedings of the National Academy of Sciences of the United States of America. 1988;85:8531–8534. doi: 10.1073/pnas.85.22.8531. [DOI] [PMC free article] [PubMed] [Google Scholar]
- 3.Di Costanzo L, Drury JE, Penning TM, Christianson DW. Crystal structure of human liver Delta4-3-ketosteroid 5beta-reductase (AKR1D1) and implications for substrate binding and catalysis. The Journal of Biological Chemistry. 2008;283:16830–16839. doi: 10.1074/jbc.M801778200. [DOI] [PMC free article] [PubMed] [Google Scholar]
- 4.Fahy E, et al. A comprehensive classification system for lipids. Journal of Lipid Research. 2005;46:839–861. doi: 10.1194/jlr.E400004-JLR200. [DOI] [PubMed] [Google Scholar]
- 5.Miller WL, Bose HS. Early steps in steroidogenesis: intracellular cholesterol trafficking. Journal of Lipid Research. 2011;52:2111–2135. doi: 10.1194/jlr.R016675. [DOI] [PMC free article] [PubMed] [Google Scholar]
- 6.Miller WL. Steroid hormone synthesis in mitochondria. Molecular and Cellular Endocrinology. 2013;379:62–73. doi: 10.1016/j.mce.2013.04.014. [DOI] [PubMed] [Google Scholar]
- 7.Goldstein JL, DeBose-Boyd RA, Brown MS. Protein sensors for membrane sterols. Cell. 2006;124:35–46. doi: 10.1016/j.cell.2005.12.022. [DOI] [PubMed] [Google Scholar]
- 8.Olins AL, Rhodes G, Welch DB, Zwerger M, Olins DE. Lamin B receptor: multi-tasking at the nuclear envelope. Nucleus. 2010;1:53–70. doi: 10.4161/nucl.1.1.10515. [DOI] [PMC free article] [PubMed] [Google Scholar]
- 9.Silve S, Dupuy PH, Ferrara P, Loison G. Human lamin B receptor exhibits sterol C14-reductase activity in Saccharomyces cerevisiae. Biochim Biophys Acta. 1998;1392:233–244. doi: 10.1016/s0005-2760(98)00041-1. [DOI] [PubMed] [Google Scholar]
- 10.Hoffmann K, et al. Mutations in the gene encoding the lamin B receptor produce an altered nuclear morphology in granulocytes (Pelger-Huet anomaly) Nat Genet. 2002;31:410–414. doi: 10.1038/ng925. [DOI] [PubMed] [Google Scholar]
- 11.Waterham HR, et al. Autosomal recessive HEM/Greenberg skeletal dysplasia is caused by 3 beta-hydroxysterol delta 14-reductase deficiency due to mutations in the lamin B receptor gene. Am J Hum Genet. 2003;72:1013–1017. doi: 10.1086/373938. [DOI] [PMC free article] [PubMed] [Google Scholar]
- 12.Porter FD. Smith-Lemli-Opitz syndrome: pathogenesis, diagnosis and management. European journal of human genetics : EJHG. 2008;16:535–541. doi: 10.1038/ejhg.2008.10. [DOI] [PubMed] [Google Scholar]
- 13.Herman GE, Kratz L. Disorders of sterol synthesis: beyond Smith-Lemli-Opitz syndrome. American journal of medical genetics. Part C, Seminars in medical genetics. 2012;160C:301–321. doi: 10.1002/ajmg.c.31340. [DOI] [PubMed] [Google Scholar]
- 14.Shchukin VN, Khmelenina VN, Eshinimaev B, Suzina NE, Trotsenko Iu A. Primary characterization of dominant cell surface proteins of halotolerant methanotroph Methylomicrobium alcaliphilum 20Z. Mikrobiologiia. 2011;80:595–605. [PubMed] [Google Scholar]
- 15.Paik YK, Trzaskos JM, Shafiee A, Gaylor JL. Microsomal enzymes of cholesterol biosynthesis from lanosterol. Characterization, solubilization, and partial purification of NADPH-dependent delta 8,14-steroid 14-reductase. The Journal of Biological Chemistry. 1984;259:13413–13423. [PubMed] [Google Scholar]
- 16.Roberti R, et al. Cloning and expression of sterol Delta 14-reductase from bovine liver. Eur J Biochem. 2002;269:283–290. doi: 10.1046/j.0014-2956.2001.02646.x. [DOI] [PubMed] [Google Scholar]
- 17.Bennati AM, et al. Sterol dependent regulation of human TM7SF2 gene expression: role of the encoded 3beta-hydroxysterol Delta14-reductase in human cholesterol biosynthesis. Biochim Biophys Acta. 2006;1761:677–685. doi: 10.1016/j.bbalip.2006.05.004. [DOI] [PubMed] [Google Scholar]
- 18.von Heijne G. Control of topology and mode of assembly of a polytopic membrane protein by positively charged residues. Nature. 1989;341:456–458. doi: 10.1038/341456a0. [DOI] [PubMed] [Google Scholar]
- 19.Kim H, Melen K, Osterberg M, von Heijne G. A global topology map of the Saccharomyces cerevisiae membrane proteome. Proceedings of the National Academy of Sciences of the United States of America. 2006;103:11142–11147. doi: 10.1073/pnas.0604075103. [DOI] [PMC free article] [PubMed] [Google Scholar]
- 20.Miller WL, Auchus RJ. The molecular biology, biochemistry, and physiology of human steroidogenesis and its disorders. Endocrine Reviews. 2011;32:81–151. doi: 10.1210/er.2010-0013. [DOI] [PMC free article] [PubMed] [Google Scholar]
- 21.Bennati AM, et al. Disruption of the gene encoding 3beta-hydroxysterol Delta-reductase (Tm7sf2) in mice does not impair cholesterol biosynthesis. FEBS J. 2008;275:5034–5047. doi: 10.1111/j.1742-4658.2008.06637.x. [DOI] [PubMed] [Google Scholar]
- 22.Yang J, et al. Mechanism of isoprenylcysteine carboxyl methylation from the crystal structure of the integral membrane methyltransferase ICMT. Mol Cell. 2011;44:997–1004. doi: 10.1016/j.molcel.2011.10.020. [DOI] [PubMed] [Google Scholar]
- 23.Hennekes H, Nigg EA. The role of isoprenylation in membrane attachment of nuclear lamins. A single point mutation prevents proteolytic cleavage of the lamin A precursor and confers membrane binding properties. J Cell Sci. 1994;107:1019–1029. doi: 10.1242/jcs.107.4.1019. [DOI] [PubMed] [Google Scholar]
- 24.Otwinowski Z, Minor W. Processing of X-ray diffraction data collected in oscillation mode. Methods Enzymol. 1997;276:307–326. doi: 10.1016/S0076-6879(97)76066-X. [DOI] [PubMed] [Google Scholar]
- 25.Zwart P, Grosse-Kunstleve R, Adams P. Xtriage and Fest: automatic assessment of X-ray data and substructure structure factor estimation. CCP4 Newsletter. 2005;43:27. [Google Scholar]
- 26.Adams PD, et al. PHENIX: a comprehensive Python-based system for macromolecular structure solution. Acta crystallographica. Section D, Biological crystallography. 2010;66:213–221. doi: 10.1107/S0907444909052925. [DOI] [PMC free article] [PubMed] [Google Scholar]
- 27.Terwilliger TC, Berendzen J. Automated MAD and MIR structure solution. Acta crystallographica. Section D, Biological crystallography. 1999;55:849–861. doi: 10.1107/S0907444999000839. [DOI] [PMC free article] [PubMed] [Google Scholar]
- 28.Schneider TR, Sheldrick GM. Substructure solution with SHELXD. Acta crystallographica. Section D, Biological crystallography. 2002;58:1772–1779. doi: 10.1107/s0907444902011678. [DOI] [PubMed] [Google Scholar]
- 29.McCoy AJ, et al. Phaser crystallographic software. Journal of Applied Crystallography. 2007;40:658–674. doi: 10.1107/S0021889807021206. [DOI] [PMC free article] [PubMed] [Google Scholar]
- 30.Cowtan K. DM: An automated procedure for phase improvement by density modification. JOINT CCP4 ESF EACBM. 1994;31:34. [Google Scholar]
- 31.Emsley P, Cowtan K. Coot: model-building tools for molecular graphics. Acta crystallographica. Section D, Biological crystallography. 2004;60:2126–2132. doi: 10.1107/S0907444904019158. [DOI] [PubMed] [Google Scholar]
- 32.Chen VB, et al. MolProbity: all-atom structure validation for macromolecular crystallography. Acta crystallographica. Section D, Biological crystallography. 2010;66:12–21. doi: 10.1107/S0907444909042073. [DOI] [PMC free article] [PubMed] [Google Scholar]
- 33.Fiser A, Sali A. Modeller: generation and refinement of homology-based protein structure models. Methods in enzymology. 2003;374:461–491. doi: 10.1016/S0076-6879(03)74020-8. [DOI] [PubMed] [Google Scholar]
- 34.Thompson JD, Higgins DG, Gibson TJ. CLUSTAL W: improving the sensitivity of progressive multiple sequence alignment through sequence weighting, position-specific gap penalties and weight matrix choice. Nucleic Acids Res. 1994;22:4673–4680. doi: 10.1093/nar/22.22.4673. [DOI] [PMC free article] [PubMed] [Google Scholar]
- 35.Clayton P, et al. Mutations causing Greenberg dysplasia but not Pelger anomaly uncouple enzymatic from structural functions of a nuclear membrane protein. Nucleus. 2010;1:354–366. doi: 10.4161/nucl.1.4.12435. [DOI] [PMC free article] [PubMed] [Google Scholar]
- 36.Holm L, Rosenstrom P. Dali server: conservation mapping in 3D. Nucleic Acids Res. 2010;38:W545–549. doi: 10.1093/nar/gkq366. [DOI] [PMC free article] [PubMed] [Google Scholar]


