Abstract
We developed a reflection-mode subwavelength-resolution photoacoustic microscopy system capable of imaging optical absorption contrast in vivo. The simultaneous high-resolution and reflection-mode imaging capacity of the system was enabled by delicately configuring a miniature high-frequency ultrasonic transducer tightly under a water-immersion objective with numerical aperture of 1.0. At 532-nm laser illumination, the lateral resolution of the system was measured to be ~320 nm. With this system, subcellular structures of red blood cells and B16 melanoma cells were resolved ex vivo; microvessels, including individual capillaries, in a mouse ear were clearly imaged label-freely in vivo, using the intrinsic optical absorption from hemoglobin. The current study suggests that, the optical-absorption contrast, subwavelength resolution, and reflection-mode ability of the developed photoacoustic microscopy may empower a wide range of biomedical studies for visualizing cellular and/or subcellular structures.
OCIS codes: (170.5120) Photoacoustic imaging, (180.0180) Microscopy, (170.3880) Medical and biological imaging
1. Introduction
Photoacoustic imaging is capable of noninvasively mapping the optical absorption properties of biological tissue, by detecting transient thermo-elastic expansion induced acoustic (photoacoustic) waves from the absorption of pulsed optical energy [1,2]. Optical-resolution photoacoustic microscopy (OR-PAM) refers to the form of photoacoustic imaging that utilizes tightly focused light for photoacoustic excitation, which thus enables optical-diffraction limited lateral (transverse) resolution down to micrometer or even submicrometer scale [3–6]. Therefore, OR-PAM can label-freely image microvasculature at the capillary level based on the intrinsic optical absorption from hemoglobin; in addition, using spectroscopic photoacoustic measurement, it can spectrally identify a variety of endogenous and/or exogenous chromophores [7–9]. To date, OR-PAM has successfully demonstrated the capability of providing optical-absorption-based anatomic, functional, and molecular information, and found broad applications in vascular biology [10], neurology [11], and ophthalmology [12].
According to the detection configuration of photoacoustic signals, OR-PAM can be further classified into transmission mode and reflection mode [3–6]. In transmission-mode OR-PAM, the photoacoustic excitation (laser illumination) and ultrasonic detection are at the opposite sides of the imaging target, which limits its application to only in vitro cell samples or thin biological tissue of body extremities (e.g., the ear) [3,5]. In contrast, OR-PAM in reflection mode configures its laser illumination and ultrasonic detection at the same side of the imaging target [4,6]. As a result, it allows the imaging of many more anatomic sites, including the brain and the eye. However, it is quite challenging for reflection-mode systems to realize fine subwavelength resolution due to the very limited working distance of optical objectives with high numerical aperture (NA) [3,13]. Until now, the reported highest resolution of reflection-mode OR-PAM is about 500 nm with an optical objective of 0.63 NA at 532-nm laser illumination [6].
Here, we designed and implemented a simple and compact optical-acoustic configuration to realize subwavelength (~1/2 of the laser wavelength) resolution for reflection-mode OR-PAM. The combined advantages of reflection-mode imaging and subwavelength resolution were enabled by delicately configuring a miniature high-frequency ultrasonic transducer tightly under a water-immersion optical objective with a NA of 1.0. Using the system, both ex vivo imaging of subcellular structures in cell samples and in vivo label-free imaging of mouse skin microvasculature were demonstrated.
2. Methods and materials
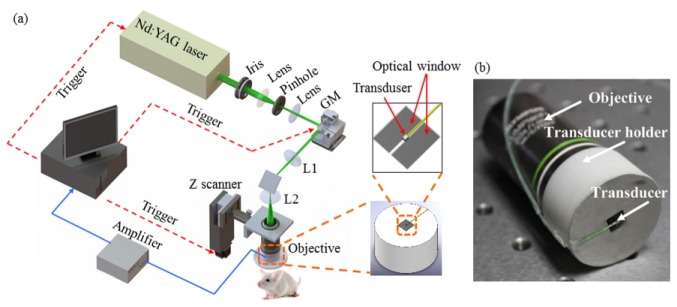
Figure 1(a) shows the schematic diagram of the reflection-mode subwavelength-resolution PAM system. As the photoacoustic excitation source, a pulsed Nd:YAG laser (SPOT-532, Elforlight; wavelength: 532 nm; pulse duration: 1.8 ns) was used. The output laser beam was reshaped to about 2.0 mm in diameter by an iris, and spatially filtered through a 5-μm pinhole. After collimated by a collimator, the laser beam was steered by a two-dimensional (2D) galvanometer scanner (6210H, Cambridge Technology), and delivered through a scan lens [f = 35 mm, L1 in Fig. 1(a)] and a tube lens [f = 200 mm, L2 in Fig. 1(a)] to a water-immersion objective (XLUMPLFLN 20XW, Olympus; NA = 1.0).
Fig. 1.

(a) Schematic diagram of the reflection-mode subwavelength-resolution photoacoustic microscopy system. (b) Photograph of the configured imaging probe consisting of a high-NA objective and a miniature high-frequency ultrasonic transducer. GM: galvanometer scanner; L1: scan lens; L2: tube lens.
In order to achieve coaxial photoacoustic excitation and detection (for optimizing the detection sensitivity), we designed and implemented a compact optical-acoustic configuration as shown in Fig. 1(b). A customized miniature ultrasonic transducer (PZT ceramic composite; central frequency: 42.6 MHz; fractional bandwidth: 60%; length × width × thickness: 0.6 mm × 0.5 mm × 0.2 mm; Blatek, State College, USA) was placed tightly under the center of the optical objective to detect the excited photoacoustic waves. Using a home-made transducer holder [the right panel of Fig. 1(a)], the transducer and objective were combined compactly as shown in Fig. 1(b), enabling coaxial photoacoustic excitation and detection. At the center of the holder bottom [the upper right panel of Fig. 1(a)], we created a rectangular optical window (larger than the output optical aperture of the objective) for delivering the illuminating laser beam for photoacoustic excitation, and a thin stainless steel bridge (width: 0.3 mm; thickness: 0.1 mm) for holding the ultrasonic transducer. Both the objective and the ultrasonic transducer were immersed in a water-filled dish, with an imaging window made of a thin layer of low-density polyethylene (LDPE) film at its bottom.
The detected photoacoustic signals were amplified by a low-noise amplifier (ZFL-500LN-BNC + , Mini-Circuits), and digitized by a data acquisition card at a sampling rate of 250 MS/s (12 bit; ATS9325, Alazar). The entire imaging probe, consisting of both the objective and the ultrasonic transducer, was mounted at a motorized z scanner (MTS25, Thorlabs) for depth scanning. A National Instruments card (PCIe-6320) was used to trigger the photoacoustic laser firing and data acquisition, as well as to control the scanning of the galvanometer and the z scanner.
With the developed photoacoustic microscopy, in vivo imaging of the microvasculature in mouse ears (BALB/c, 25 g, female) was performed. Before imaging, the mouse was anesthetized by intraperitoneal (i.p.) injection of a cocktail of Ketamine (87 mg/kg body weight) and Xylazine (13 mg/kg body weight); then, the hair of the mouse ear was gently depilated, and the skin was cleaned with deionized water. All experimental animal procedures were carried out in compliance with the laboratory animal protocols approved by the Animal Studies Committee of the Shenzhen Institutes of Advanced Technology, the Chinese Academy of Sciences. For ex vivo imaging, the photoacoustic excitation laser irradiated onto the cell samples was ~15 nJ per pulse. The laser energy delivered onto the animal skin for photoacoustic excitation was measured to be ~80 nJ per pulse. Assuming the laser was focused ~50 µm beneath the skin surface, the light intensity on the tissue surface is about 0.7 mJ/cm2, which is well below the laser safety limit defined by the American National Standards Institute.
3. Results and discussions
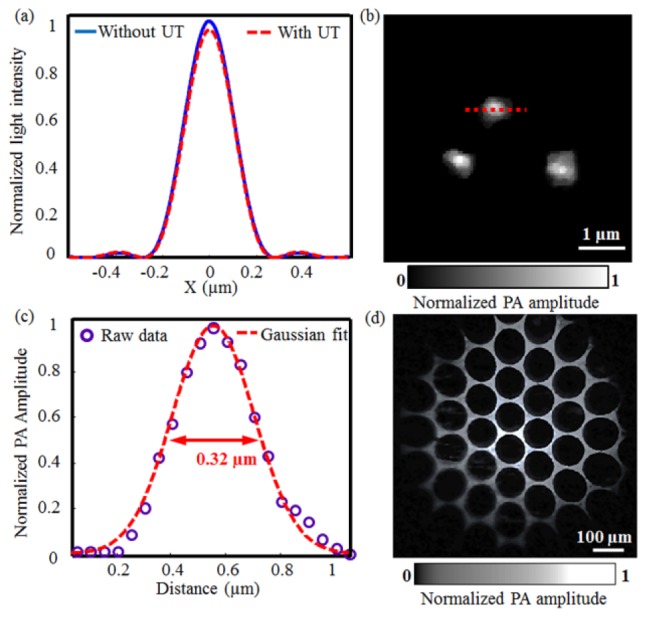
Because the ultrasonic transducer and the bridge of the holder stopped part of the photoacoustic excitation light, we simulated its influence on laser focusing based on the Fraunhofer diffraction theory. Figure 2(a) shows the light intensity profiles in the focal plane with and without the ultrasonic transducer, respectively. Compared with the optical energy distribution without the ultrasonic transducer, the inserted miniature transducer led to a slightly decreased light intensity peak and a slightly narrowed full width at half maximum (FWHM) (note that both changes are extremely small though), which is consistent with the results from the optical apodization effect [14–16]. The simulation suggests that the insertion of the miniature ultrasonic transducer under the objective has essentially negligible influence on the laser focusing.
Fig. 2.

(a) Theoretical optical diffraction profiles with and without the ultrasonic transducer (UT) under the objective; (b) Subwavelength-resolution PAM image of graphite nanoparticles of a mean diameter of ~80 nm; (c) Lateral resolution of subwavelength-resolution PAM estimated by Gaussian fitting of the photoacoustic amplitude along the red dot-line in Fig. 2(b); (d) Subwavelength-resolution PAM imaging of a copper net with holes of 95 µm in diameter and bars of ~30 μm in width.
To measure the lateral resolution of subwavelength-resolution PAM, we imaged graphite nanoparticles with a mean diameter of ~80 nm. Figure 2(b) shows three representative individual nanoparticles imaged by subwavelength-resolution PAM. In Fig. 2(c), the photoacoustic amplitude values of a typical nanoparticle [along the dotted line in Fig. 2(b)] were fitted by a Gaussian function, defining the lateral resolution of subwavelength-resolution PAM at ~320 nm according to its FWHM. On the other hand, the axial resolution of the system was measured to be ~29 µm, determined primarily by the ultrasonic detection bandwidth.
To estimate the field of view (FOV) of subwavelength-resolution PAM, we imaged a copper net with holes of 95 μm in diameter and bars of ~30 μm in width, as shown in Fig. 2(d). From the image, the FOV of subwavelength-resolution PAM is estimated to be roughly 700 μm in diameter, slightly smaller than the nominal FOV of the objective (1.1 mm). This is presumably due to both a relatively small ultrasonic detection FOV [17,18] and the restrictions from the scan lens and the tube lens. Note that, a slight distortion is observed in the edges of the image, due to the use of a doublet scan lens without aberration corrections.
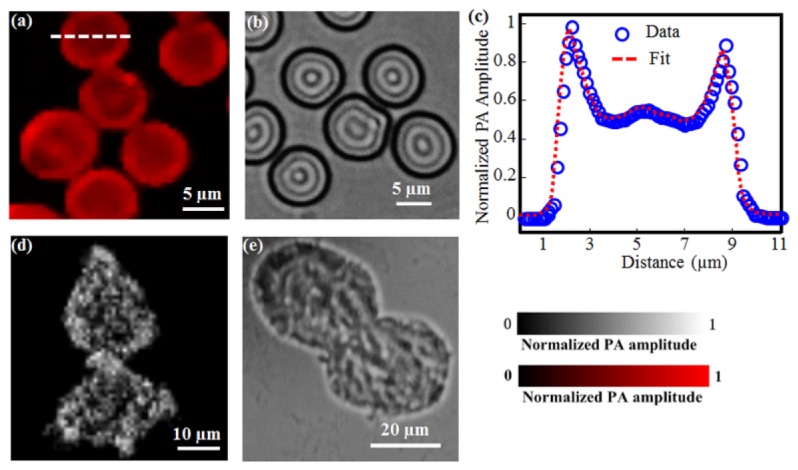
To demonstrate the subcellular resolution capability of subwavelength-resolution PAM, we imaged red blood cell (RBC) and B16 melanoma cell samples (Fig. 3 ). Because of the strong optical absorption of hemoglobin in RBCs, subwavelength-resolution PAM offers very high contrast for RBC imaging [Fig. 3(a)]. Moreover, the donut shape of individual RBCs was clearly resolved, owing to the high resolution of our system. The photoacoustic amplitudes along the dotted line in one RBC in Fig. 3(a) were plotted in Fig. 3(c), showing a dual-peak profile consistent with the donut structure visualized in Fig. 3(a). In addition, the photoacoustic amplitude profile of the RBC shows a sharp edge, further validating the high lateral resolution of subwavelength-resolution PAM. Compared with the RBCs image [Fig. 3(b)] from a conventional bright-field optical microscope (OM) with a NA of 0.65 from Olympus, subwavelength-resolution PAM demonstrates ~25-dB better contrast-to-noise ratio. This difference comes from their respective imaging contrast mechanism. Subwavelength-resolution PAM is specifically sensitive to optical absorption, while OM does not differentiate absorption and scattering. Note that the two images of subwavelength-resolution PAM and OM are not from the same FOV in the sample.
Fig. 3.

Subwavelength-resolution PAM imaging of individual RBCs and B16 melanoma cells ex vivo. (a) and (b) show the subwavelength-resolution PAM and OM images of RBCs, respectively; (c) Photoacoustic amplitude profile of one RBC along the marked dotted line; (d) and (e) show the subwavelength-resolution PAM and OM images of B16 melanoma cells, respectively.
Figures 3(d) and 3(e) show the subwavelength-resolution PAM and OM images of the B16 melanoma cells, respectively. Before imaging, the cells were cultured on a glass slide and then fixed by polyoxymethylene for 20 minutes. In the subwavelength-resolution PAM image [Fig. 3(d)], the bright dots correspond to the melanosomes that contain melanin, which can produce high-amplitude photoacoustic signals as a result of the strong melanin optical absorption [19]. In contrast, the melanosomes appear dark in the OM image because of relatively weak light transmission. Similarly, the imaging contrast of melanin with subwavelength-resolution PAM is significantly improved over that with OM. In these experiments, the imaging areas were limited to ~50 µm × 50 µm within the center of the FOV. As a result, no obvious image distortions are observed in the results shown in Fig. 3.
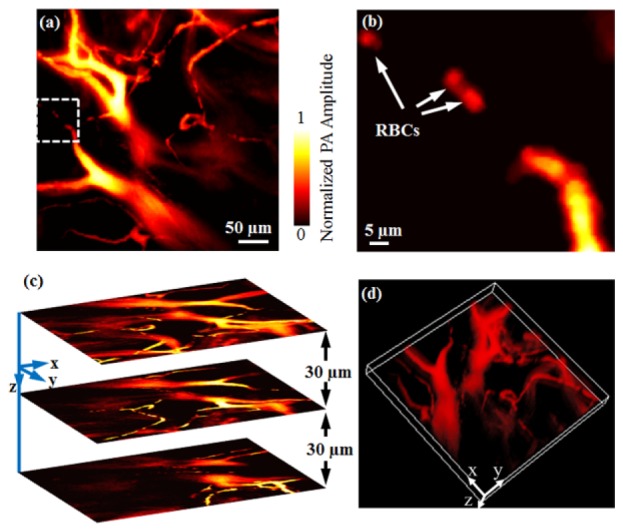
The in vivo image of the mouse ear acquired by subwavelength-resolution PAM is shown in Fig. 4 . In Fig. 4(a), the microvasculature, including both major blood vessels and capillaries, can be clearly visualized. In the region marked by the white dashed square in Fig. 4(a), we can identify some discrete RBCs traveling along a capillary. Figure 4(b) shows the close-up image of those RBCs with estimated diameters of ~6-7 µm. Since subwavelength-resolution PAM enables well-resolved individual RBCs in vivo, the system, in conjunction with spectroscopic photoacoustic measurement, has the potential to provide important functional information in vivo, such as sickle cell disease, blood flow in capillaries, and even dynamic oxygen consumption at the single-cell level [20].
Fig. 4.

In vivo subwavelength-resolution PAM of a mouse ear. (a) Maximum amplitude projection (MAP) subwavelength-resolution PAM image of the mouse ear microvasculature; (b) Close-up of the white dashed square area in Fig. 4(a) where individual RBCs can be identified; (c) Representative cross-sectional images at different depths; (d) Volumetric rendering of the data set ( Media 1 (7MB, AVI) ).
In photoacoustic imaging, the depth information is usually derived from the time of flight of the photoacoustic waves. However, the high-NA objective in subwavelength-resolution PAM has led to an optical focal zone (~1 µm) much smaller than the desired imaging range. As a result, if only x-y raster scanning is performed, some vessels will be out of focus, or even missing. Here, to maintain high lateral resolution over a relatively large imaging depth, we introduced a motorized z scanner in the system [Fig. 1(a)]. As a result, as shown in Fig. 4(c), a series of cross-sectional subwavelength-resolution PAM images can be obtained by scanning the imaging probe to focus the laser at different depths of interest. By stacking these cross-sectional images together, a three-dimensional (3D) subwavelength-resolution PAM image can then be formed, as shown in Fig. 4(d).
The total imaging acquisition time increases due to the additional z scanning. Fortunately, the 2D laser scanning enabled by the galvanometer is much faster over conventional mechanical scanning. In this work, the subwavelength-resolution PAM microvascular image at each depth of interest consists of 400 × 400 pixels, taking 4 seconds with a laser pulse repetition rate of 40 kHz (as used in this study). To acquire a volumetric data set, cross-sectional images from twenty layers were obtained through z scanning with a 5-µm step. Thus, the total imaging duration for acquiring a 3D image was only ~80 seconds, representing a significant improvement over previously reported OR-PAM systems based on mechanical scanning [2,3,13].
4. Conclusions
In the future, to improve the field of view (FOV) of the system, we are planning to develop a hybrid scanning method for subwavelength-resolution PAM [21], for example, to translate the entire imaging probe (including the galvanometer scanners, the optical objective, and the ultrasonic transducer) with a motorized scanner.
In subwavelength-resolution PAM, the compact optical-acoustic configuration allows laser focusing at high NA and photoacoustic signal detection in reflection mode. Therefore, in principle, subwavelength-resolution PAM can be readily integrated with other widely used biomedical optical imaging technologies, such as optical coherence tomography (OCT), confocal microscopy, and multi-photon microscopy. OCT relies on back-scattering photons from the tissue, and is able to non-invasively visualize fine cross-sectional layers based on its high axial resolution [17]; confocal/multi-photon microscopic technologies demonstrate extraordinary sensitivity to fluorescence contrasts, and are capable of acquiring structural, functional, and molecular imaging at cellular and sub-cellular levels [22]. Therefore, the integration of subwavelength-resolution PAM with these sophisticated optical imaging techniques is expected to provide comprehensive physiological and pathological information of biological tissue in vivo, by revealing multiple complementary optical contrasts.
Acknowledgments
This work was supported in part by the National Natural Science Foundation of China grant: 61205203, 81201123, 81427804; the International Science and Technology Cooperation Program of China: 2014DFG32800; the National Key Basic Research (973) Program of China: 2014CB744503, 2015CB755502; the Shenzhen Science and Technology Innovation Committee grants: ZDSY20130401165820357, KQCX20120816155844962, KQCX20120816155352228, CXZZ20120617113635699, and JCYJ20120615125857842; the Guangdong Innovation Research Team Fund for Low-cost Healthcare Technologies (GIRTF-LCHT) [2011].
References and links
- 1.Wang L. V., Hu S., “Photoacoustic tomography: in vivo imaging from organelles to organs,” Science 335(6075), 1458–1462 (2012). 10.1126/science.1216210 [DOI] [PMC free article] [PubMed] [Google Scholar]
- 2.Hu S., Wang L. V., “Optical-resolution photoacoustic microscopy: auscultation of biological systems at the cellular level,” Biophys. J. 105(4), 841–847 (2013). 10.1016/j.bpj.2013.07.017 [DOI] [PMC free article] [PubMed] [Google Scholar]
- 3.Zhang C., Maslov K., Wang L. V., “Subwavelength-resolution label-free photoacoustic microscopy of optical absorption in vivo,” Opt. Lett. 35(19), 3195–3197 (2010). 10.1364/OL.35.003195 [DOI] [PMC free article] [PubMed] [Google Scholar]
- 4.Chen J., Lin R., Wang H., Meng J., Zheng H., Song L., “Blind-deconvolution optical-resolution photoacoustic microscopy in vivo,” Opt. Express 21(6), 7316–7327 (2013). 10.1364/OE.21.007316 [DOI] [PubMed] [Google Scholar]
- 5.Yuan Y., Yang S., Xing D., “Optical-resolution photoacoustic microscopy based on two-dimensional scanning galvanometer,” Appl. Phys. Lett. 100(2), 023702 (2012). 10.1063/1.3675907 [DOI] [Google Scholar]
- 6.Zhang C., Maslov K., Hu S., Chen R., Zhou Q., Shung K. K., Wang L. V., “Reflection-mode submicron-resolution in vivo photoacoustic microscopy,” J. Biomed. Opt. 17(2), 020501 (2012). 10.1117/1.JBO.17.2.020501 [DOI] [PMC free article] [PubMed] [Google Scholar]
- 7.Wang Y., Hu S., Maslov K., Zhang Y., Xia Y., Wang L. V., “In vivo integrated photoacoustic and confocal microscopy of hemoglobin oxygen saturation and oxygen partial pressure,” Opt. Lett. 36(7), 1029–1031 (2011). 10.1364/OL.36.001029 [DOI] [PMC free article] [PubMed] [Google Scholar]
- 8.Yao J., Maslov K. I., Zhang Y., Xia Y., Wang L. V., “Label-free oxygen-metabolic photoacoustic microscopy in vivo,” J. Biomed. Opt. 16(7), 076003 (2011). 10.1117/1.3594786 [DOI] [PMC free article] [PubMed] [Google Scholar]
- 9.Hu S., Maslov K., Tsytsarev V., Wang L. V., “Functional transcranial brain imaging by optical-resolution photoacoustic microscopy,” J. Biomed. Opt. 14(4), 040503 (2009). 10.1117/1.3194136 [DOI] [PMC free article] [PubMed] [Google Scholar]
- 10.Oladipupo S., Hu S., Kovalski J., Yao J., Santeford A. C., Sohn R. E., Shohet R. V., Maslov K., Wang L. V., Arbeit J. M., “VEGF is essential for hypoxia-inducible factor-mediated neovascularization but dispensable for endothelial sprouting,” Proc. Natl. Acad. Sci. U.S.A. 108(32), 13264–13269 (2011). 10.1073/pnas.1101321108 [DOI] [PMC free article] [PubMed] [Google Scholar]
- 11.Matthews T. P., Zhang C., Yao D. K., Maslov K., Wang L. V., “Label-free photoacoustic microscopy of peripheral nerves,” J. Biomed. Opt. 19(1), 016004 (2014). 10.1117/1.JBO.19.1.016004 [DOI] [PMC free article] [PubMed] [Google Scholar]
- 12.Jiao S., Jiang M., Hu J., Fawzi A., Zhou Q., Shung K. K., Puliafito C. A., Zhang H. F., “Photoacoustic ophthalmoscopy for in vivo retinal imaging,” Opt. Express 18(4), 3967–3972 (2010). 10.1364/OE.18.003967 [DOI] [PMC free article] [PubMed] [Google Scholar]
- 13.Wang H., Yang X., Liu Y., Jiang B., Luo Q., “Reflection-mode optical-resolution photoacoustic microscopy based on a reflective objective,” Opt. Express 21(20), 24210–24218 (2013). 10.1364/OE.21.024210 [DOI] [PubMed] [Google Scholar]
- 14.Lerman G. M., Levy U., “Effect of radial polarization and apodization on spot size under tight focusing conditions,” Opt. Express 16(7), 4567–4581 (2008). 10.1364/OE.16.004567 [DOI] [PubMed] [Google Scholar]
- 15.Gong W., Si K., Sheppard C. J., “Optimization of axial resolution in a confocal microscope with D-shaped apertures,” Appl. Opt. 48(20), 3998–4002 (2009). 10.1364/AO.48.003998 [DOI] [PubMed] [Google Scholar]
- 16.Sheppard C. J., Choudhury A., “Annular pupils, radial polarization, and superresolution,” Appl. Opt. 43(22), 4322–4327 (2004). 10.1364/AO.43.004322 [DOI] [PubMed] [Google Scholar]
- 17.Song W., Wei Q., Liu T., Kuai D., Burke J. M., Jiao S., Zhang H. F., “Integrating photoacoustic ophthalmoscopy with scanning laser ophthalmoscopy, optical coherence tomography, and fluorescein angiography for a multimodal retinal imaging platform,” J. Biomed. Opt. 17(6), 061206 (2012). 10.1117/1.JBO.17.6.061206 [DOI] [PMC free article] [PubMed] [Google Scholar]
- 18.Xie Z., Jiao S., Zhang H. F., Puliafito C. A., “Laser-scanning optical-resolution photoacoustic microscopy,” Opt. Lett. 34(12), 1771–1773 (2009). 10.1364/OL.34.001771 [DOI] [PubMed] [Google Scholar]
- 19.Jacques S. L., “Optical properties of biological tissues: a review,” Phys. Med. Biol. 58(11), R37–R61 (2013). 10.1088/0031-9155/58/11/R37 [DOI] [PubMed] [Google Scholar]
- 20.Wang L., Maslov K., Wang L. V., “Single-cell label-free photoacoustic flowoxigraphy in vivo,” Proc. Natl. Acad. Sci. U.S.A. 110(15), 5759–5764 (2013). 10.1073/pnas.1215578110 [DOI] [PMC free article] [PubMed] [Google Scholar]
- 21.Li L., Yeh C., Hu S., Wang L., Soetikno B. T., Chen R., Zhou Q., Shung K. K., Maslov K. I., Wang L. V., “Fully motorized optical-resolution photoacoustic microscopy,” Opt. Lett. 39(7), 2117–2120 (2014). 10.1364/OL.39.002117 [DOI] [PMC free article] [PubMed] [Google Scholar]
- 22.Weissleder R., Pittet M. J., “Imaging in the era of molecular oncology,” Nature 452(7187), 580–589 (2008). 10.1038/nature06917 [DOI] [PMC free article] [PubMed] [Google Scholar]


