Abstract
Background:
Orthosiphon stamineus Benth. (Lamiaceae) is a traditional medicinal plant which has been used in treating various ailments such as kidney diseases, bladder inflammation, arthritis and diabetes. The leaves contain high concentration of phenolic compounds, thus, rosmarinic acid (RA), 3’-hydroxy-5, 6, 7, 4’-tetramethoxyflavone (TMF), sinensetin (SIN) and eupatorin (EUP) were chosen as a marker compounds for standardization of various O. stamineus leaf extracts.
Objective:
The aim was to develop and validate a new high-performance liquid chromatography (HPLC) method for quantification of 4 marker compounds (RA, TMF, SIN, EUP) in various O. stamineus leaf extracts.
Materials and Methods:
The method was developed and validated using RP-HPLC-diode-array detection at 320 nm for accuracy, precision and limits of detection and was applied for quantification of it markers in five different extracts prepared in solvents with increasing polarity, using a gradient mobile phase 0.1% formic acid: Acetonitrile at a flow rate of 1 ml/min on reverse phase acclaim polar advantage II C18 column (3 μm, 3 × 150 mm) with 18 min separation time.
Results:
The developed method provided satisfactory precision, and the accuracy of this method was in the range of 90.2% to 105.5%. All of 4 compounds showed good linearity at R2 > 0.999.
Conclusion:
The developed method is a simple, cost effective with shorter run time (18 min) in comparison to previous methods (30 min) and utilization of environmental-friendly solvents system. Therefore, this method has the potential to replace currently used methods in the routine standardization work of O. stamineus extracts, raw materials and its commercial products.
Keywords: 3’-hydroxy-5, 6, 7, 4’-tetramethoxyflavone; eupatorin; Orthosiphon stamineus; rosmarinic acid; sinensetin
INTRODUCTION
Orthosiphon stamineus Benth. (Lamiaceae) is locally known as “Misai Kucing”, and has been traditionally used in the treatment of various ailments including eruptive fever, epilepsy, gallstones, hepatitis, rheumatism, hypertension, syphilis and renal calculus. In Malaysia, the leaves are usually prepared as tea and consumed to improve health, and for treatment of kidney and bladder inflammation, gout and diabetes.[1,2] This herb has gained a great interest nowadays due to its wide range of pharmacological effects such as antioxidant activity,[3,4,5,6] antiangiogenic activity,[7,8,10] diuretic and hypoglycemic effects.[11,12,13] O. stamineus was listed in some pharmacopoeias including The Malaysian Herbal Monograph,[14] British Pharmacopoeia,[15] and Materia Medika Indonesia.[16] Previous phytochemical studies on O. stamineus have reported the leaves contain a high concentration of phenolic compounds; Sumaryono et al.[17] isolated twenty phenolic compounds including nine lipophilic flavones, two flavonol glycosides, and nine caffeic acid derivatives which includes rosmarinic acid (RA) and 2,3-dicaffeoyltartaric acid. This plant was also found to contain other compounds such as isopimarane-type diterpenes, highly oxygenated staminane-type diterpenes, and the pentacyclic triterpenes such as betulinic acid, oleanolic acid, ursolic acid and b-sitosterol.[18] Literature survey reveals few high-performance liquid chromatography (HPLC) methods for the quantification of polyphenols in this plant extracts[3,17,19,20,21] but these methods suffered from drawbacks like time consuming for HPLC separation, use of buffer which may deteriorate efficiency of column or HPLC system and use of unfriendly solvent system. Thus, there is a great need for a faster, reproducible and reliable method for routine standardization work[22] of O. stamineus extracts as well as raw leaves and commercial products for quality control purposes. In that sense, this present study has been undertaken to develop and validate a novel RP-HPLC-diode-array detection (DAD) method for the analysis of four marker compounds which include RA, 3’-hydroxy-5, 6, 7, 4’-tetramethoxyflavone (TMF), sinensetin (SIN) and eupatorin (EUP) [Figure 1] with a shorter run time and using environmental-friendly solvent system and to suit to mass spectrometry (MS) analysis as well as application in pharmacokinetic study in future research.
Figure 1.
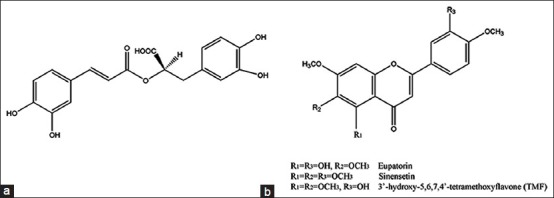
Chemical structure of (a) rosmarinic acid; (b) 3’-hydroxy-5, 6, 7, 4’-tetramethoxyflavone, sinensetin and eupatorin Chemical structure
MATERIALS AND METHODS
Chemicals and reagents
High-performance liquid chromatography-grade acetonitrile and formic acid were purchased from Merck (Petaling Jaya, Selangor, Malaysia). The reference compounds RA, TMF, SIN and EUP were purchased from ChromaDex (USA). Deionized water for HPLC was prepared using ultra-pure water purifier system (Thermo Scientific Barnstead). The reverse phase Acclaim Polar Advantage II C18 column used (3 μm, 3 × 150 mm) was purchased from Dionex (Thermo Scientific).
Collection and authentication of plant
Orthosiphon stamineus was cultivated and propagated under controlled conditions in a joint venture of Universiti Sains Malaysia (USM) - Universiti Malaysia Perlis (UNIMAP) at Titi Tinggi, Perlis, Malaysia. The plant material was authenticated by the Herbarium, School of Biological Sciences, USM, where a voucher specimen (no. 11009) was deposited. The leaves were oven-dried at 40°C and powdered using a milling machine (Restch, Germany). The powdered leaves were stored in a tight container at room temperature and in dry area.
Extraction of plant material for analysis
Fine powdered material of 500 g was extracted with methanol, ethanol, methanol: Water (1:1) and ethanol: Water (1:1) using Soxhlet extraction method at 60°C for 8 h, while the water extract was extracted using reflux extractor for 8 h. The process was repeated thrice in both extraction methods, then extracts were bulked, concentrated using a rotary evaporator under vacuum at 60°C (Buchi, Germany), and finally freeze-dried (Scanvac coolsafe, Denmark). The lyophilized extracts were kept in a freezer at −20°C prior to use.
Preparation of the standard mixtures
Stock solutions of RA, TMF, SIN and EUP were prepared at 1 mg in 1 ml of HPLC-grade methanol: Water (1:1). The stock solution was diluted with the same solvent into 10 concentrations range from 0.195 to 100 μg/ml to make a working standard solution. These standard solutions were stored at 4°C prior to use.
Preparation of the sample solution
The different extracts were prepared by dissolving the freeze dried powder at 10 mg/1 ml in a mixture of methanol: Water (1:1) and sonicated for 30 min as a stock solution. The stock solution was then diluted in the same solvent to 1 mg/ml as a sample solution. The sample solutions were then filtered through 0.45 μm syringe filters and transferred into HPLC vial.
Instrumentation and chromatographic conditions
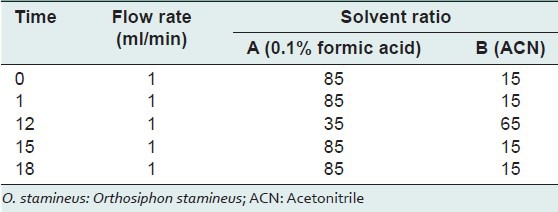
The instrument consisted of a Dionex-Ultimate® 3000 Rapid Separation LC system, which was equipped with an auto sampler, a quaternary pump, a degasser, a column oven, and a DAD detector.[22,23] The chromatographic analysis was carried out using a reverse phase Acclaim Polar Advantage II C18 column. The column temperature was maintained at 40°C. The mobile phase was consisted of 0.1% formic acid solution (A) and acetonitrile (B) with gradient elution system as shown in Table 1 at a flow rate of 1 ml/min while the separation time was 18 min and the injection volume was 5 μl. The spectral data from the DAD-3000RS DAD was set at 210, 254 and 320 nm. For quantitative analysis, the wavelength was set at 320 nm. The peak identification was based on the retention time and the DAD spectrum against the standard presented in the chromatogram. The data acquisition was performed by Chromeleon software version 6.8 (Dionex, Thermo Fisher Scientific Inc.).
Table 1.
Gradient elution program used in separation of O. stamineus marker compounds
Method validation
The method was validated according to the International Conference on Harmonization guidelines.[24] The following validation characteristics were evaluated: Selectivity, linearity, precision, accuracy and the limits of detection and quantification (LOD and LOQ).[24,25]
Selectivity
The selectivity of the method was determined by comparing the retention time and the ultraviolet–visible spectroscopy (UV-Vis spectra) of RA, TMF, SIN and EUP obtained in the sample extracts with those of the reference compounds. The UV-Vis spectra were analyzed at three levels (beginning, middle and end) of each peak investigated.
Linearity
Linearity was determined by injecting 5 μl of the standard mixture in 10 concentrations ranges from 0.195 to 100 μg/ml in triplicate. The calibration curves were obtained for each individual compound by plotting the peak area versus concentration. Regression analysis was performed in order to determine the linearity (R2) of the calibration graphs.
Precision
Precision was performed according to International Conference on Harmonization guidelines that included repeatability and intermediate precision.[24] The reproducibility is not normally expected if intermediate precision is performed.[25] For repeatability (intra-day assay precision), five concentrations of the marker compounds from 6.25 to 100 μg/ml were injected in six replicates on the same day and under the same experimental conditions. The intermediate precision was performed by same analyst using a different HPLC system (Agilent) and five concentrations (6.25-100 μg/ml) of marker compounds were injected in three different days in triplicate. The precision method was reported as a percentage of relative standard deviation (%RSD) of peak concentration and retention time.
Accuracy
Accuracy was determined as a percentage recovery of RA, TMF, SIN and EUP by the standard addition method. The marker compounds were added at 12.5 and 25 μg/ml to the EtOH extract at 1000 μg/ml and were analyzed by HPLC. The peak area of the compounds in the EtOH extract (B), the individual reference compounds (C) and their combinations (A) was recorded. The percentage recovery was calculated as the following:
Percentage recovery = ([A-B)/C] ×100). The results are presented average ± standard deviation (SD) (n = 3).
Limits of detection and quantification
The LOD and LOQ were calculated through the slope and SD method[24] using the following formula;
LOD = (3.3× δ)/S, and LOQ = (10× δ)/S,
Where:
δ: Is the SD of the Y intercept of the linear regression equations.
S: Is the slope of the linear regression equations.
Quantification of rosmarinic acid, 3’-hydroxy-5, 6, 7, 4’-tetramethoxyflavone, sinensetin and eupatorin from different Orthosiphon stamineus extracts
O. stamineus extracts (5 μl) were injected at 1 mg/ml and the peak area corresponding to RA, TMF, SIN and EUP were recorded. Concentration of the marker compounds in the samples was then calculated by applying the linear regression equations of the standards calibration curves (n = 3). The content of these four marker compounds were presented as a w/w percentage (% w/w) of the dried extract.
RESULTS AND DISCUSSIONS
A reverse phase HPLC-DAD method for simultaneously determining of four marker compounds was successfully developed and validated for routine standardization of O. stamineus extracts. This method can be applied for herbal industries to detect and quantify all of the markers in raw leaves and commercial products for quality control purposes. All these marker compounds were detectable with a better peak shape and good resolution within 10 min. The scanned UV spectra of all compounds between 200 and 400 nm by DAD were showed in Figure 2. The spectrum showed that RA was absorbed in 195.7 nm and 327.9 nm while TMF and SIN were absorbed at 211.4 nm, 238.9 nm and 329.9 nm. EUP was absorbed in 210 nm, 274.4 nm and 340 nm. All the components were strongly absorbed in 320 nm and this considering the developed chromatographic condition is suitable to detect and quantify all of the markers with optimized wavelength at 320 nm. The peaks of the 4 marker compounds were scanned at their start, apex and tail.
Figure 2.
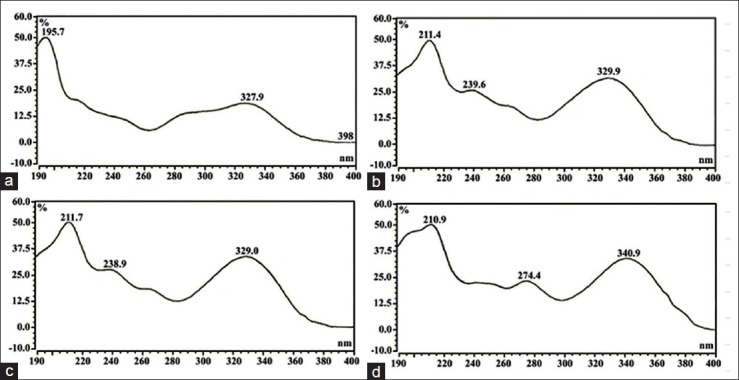
Ultraviolet–visible spectroscopy of the reference compounds: Rosmarinic acid (a), 3’-hydroxy-5, 6, 7, 4’-tetramethoxyflavone (b), sinensetin (c) and eupatorin (d). The spectra were collected by scanning the peaks at their start, apex and end
Method validation
Selectivity
Selectivity of the method was determined by comparing the retention time of compounds obtained in the sample extracts with those of the reference compounds. The retention time of RA, TMF, SIN and EUP were 6.44 ± 0.003, 8.30 ± 0.002, 9.09 ± 0.002 and 9.93 ± 0.003 min, respectively. The retention time of the same compounds in O. stamineus extracts were 6.45 ± 0.004, 8.30 ± 0.002, 9.09 ± 0.000 and 9.93 ± 0.001 min, respectively. This indicates that the present HPLC method is rapid, precise and accurate. The UV-Vis spectra of the compounds in O. stamineus extracts were also compared with the reference compounds [Figure 2]. These spectra were used to check the purity of the peaks in the extracts. The spectra of RA, TMF, SIN and EUP detected in the different extracts [Figure 3] were found to match those of the reference compounds. These findings confirm identity of the compounds, purity of the peaks, and selectivity of the developed method.
Figure 3.
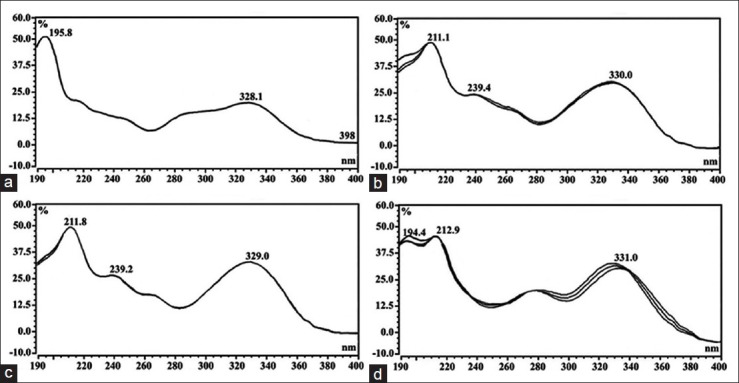
Ultraviolet–visible spectroscopy of the marker compounds in Orthosiphon stamineus extracts: Rosmarinic acid (a), 3’-hydroxy-5,6,7,4’-tetramethoxyflavone (b), sinensetin (c) and eupatorin (d). The spectra were collected by scanning the peaks at their start, apex and end
Linearity, limit of detection and limit of quantification
Mixtures of standard solutions were diluted in MeOH: Water (1:1) to make a ten series of concentrations range from 0.195 to 100 μg/ml to establish a calibration curve. The calibration curve for four marker compounds was constructed by plotting the individual peak area (Y) versus concentration (μg/ml). Linearity of the developed method was presented in terms of correlation coefficient (R2). The LOD and LOQ in chromatographic condition were determined at signal-to-noise ratio (S/N) of 3 and 10, respectively. The regression equation with correlation equation (R2), LOD and LOQ were showed in Table 2. All of the compounds showed good linearity with correlation equation (R2) range from 0.9990 to 1.000 and RSD of < 0.25%. The LOD was < 0.24 μg/ml and LOQ was < 0.73 μg/ml. Though LOD and LOQ values in this method are slightly higher than in previous methods[3,21] the compounds can still be detected and quantified at a very low concentration (<1.0 μg/ml), which indicates good sensitivity of the present method.
Table 2.
The linearity, correlation coefficient (R2), LOD and LOQ of the compounds studied

Precision
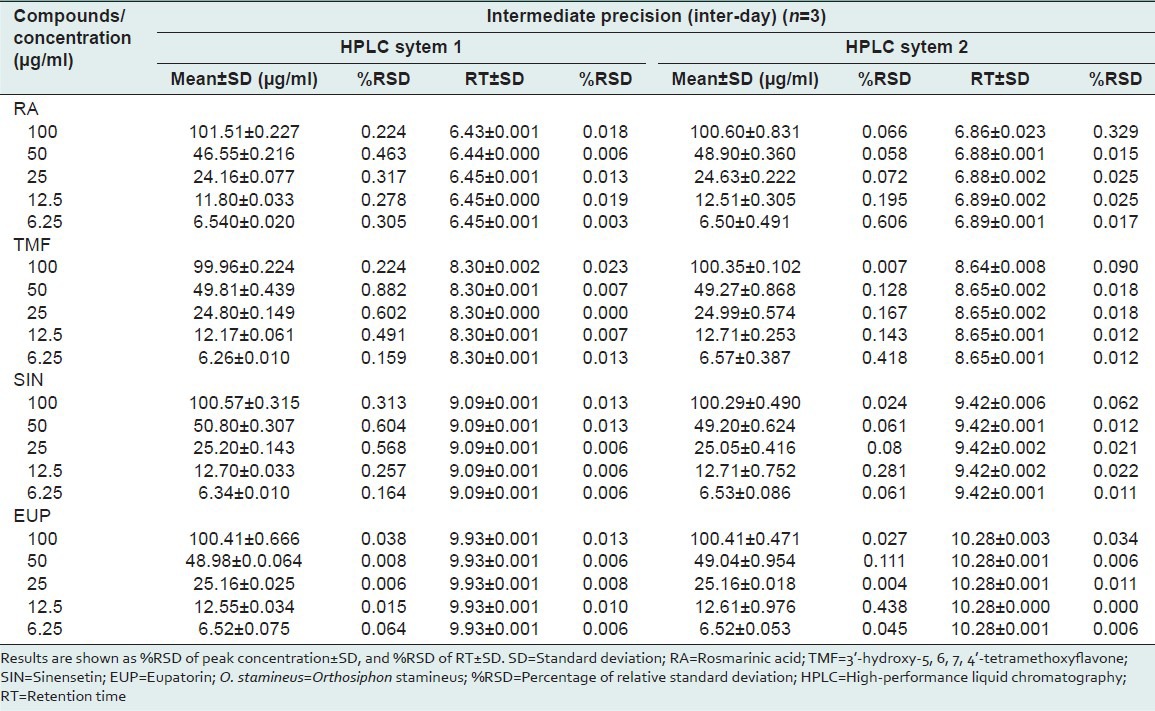
Precision was measured in accordance with ICH recommendations.[24] The RSD values for repeatability (intra-day precision) were investigated to be within the range of 0.099-0.721% for peak concentration and 0.088-0.046% for retention time. An intermediate precision (inter-day precision) was investigated using different HPLC system by same analyst with three different days. The RSD values for HPLC system 1 (Dionex) were in the range of 0.006-0.882% for peak concentration and 0-0.023% for retention time while for HPLC system 2 (Agilent) showed RSD values for peak concentration and retention time were in the range of 0.007-0.606% and 0-0.329%, respectively. The RSD values for all compounds were within the prescribed limits of the ICH guidelines (RSD < 2%).[21] These results were confirmed that the present method is precise and reproducible even the method was transferred to other HPLC system with the used of the same column and the same chromatographic condition. Tables 3 and 4 depicts the average %RSD values of the four reference compounds.
Table 3.
Analytical results for repeatability (intra-day precision) of compounds studied
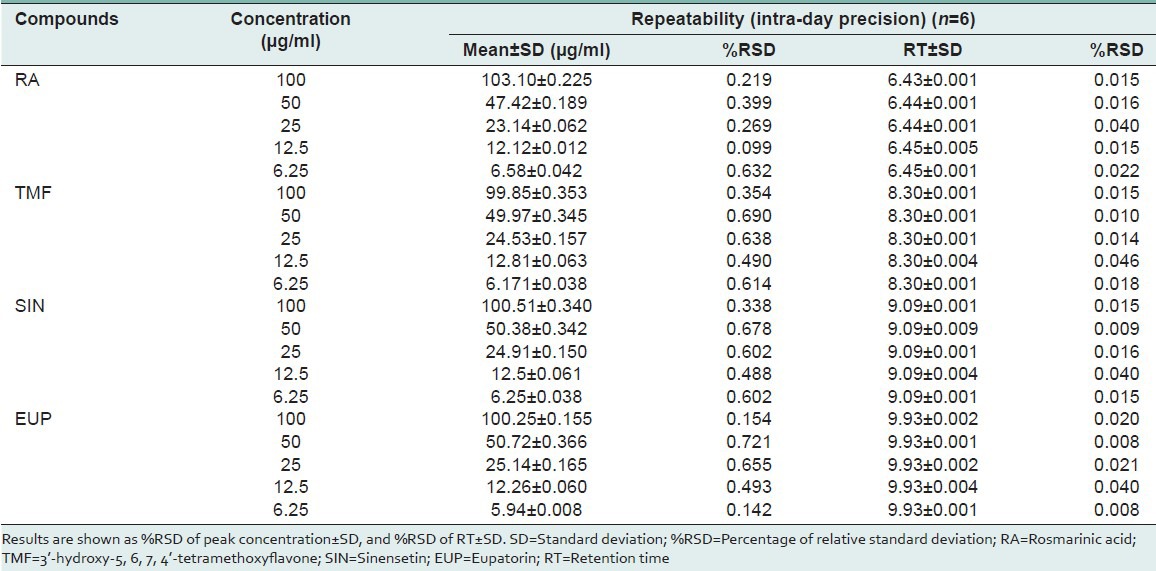
Table 4.
Analytical results for intermediate (inter-day precision) of compounds studied
Accuracy
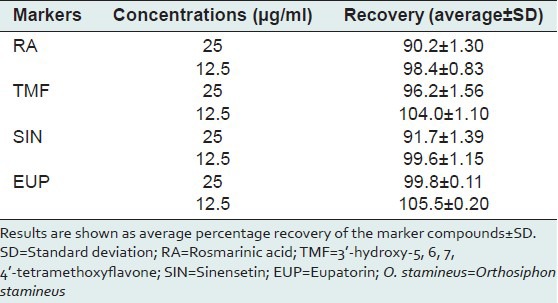
Accuracy of the method was evaluated by performing a recovery study at concentrations of 12.5 and 25 μg/ml. The results are presented as average percentage recovery ± SD [Table 5]. The results showed a good accuracy, which indicates that the method is reliable and reproducible for determination of the marker compounds in O. stamineus leaf extracts.
Table 5.
Analytical results for accuracy tests
Quantification of rosmarinic acid, 3’-hydroxy-5, 6, 7, 4’-tetramethoxyflavone, sinensetin and Eupatorin in Orthosiphon stamineus extracts
The developed method was applied to a simultaneously determination of four marker compounds in five different extracts of O. stamineus. The result showed good separation of the 4 marker compounds in 5 extracts as shown in Figure 4. RA, TMF, SIN and EUP in O. stamineus extracts were then quantified by applying the regression equations of the reference compounds. The results are presented as average w/w% ±SD in Table 6. Methanolic extract contained the highest amount of SIN (1.80 ± 0.003%) and TMF (0.28 ± 0.005%), while the RA content is the highest (4.78 ± 0.219%) in methanol: Water extract. The methanolic and ethanolic extracts were found to contain high EUP of 5.27 ± 0.321% and 5.36 ± 0.215%, respectively. Water extract however, showed the lowest content of all marker compounds. The results showed that the content of marker compounds is varying from different extracts of the same plant.
Figure 4.
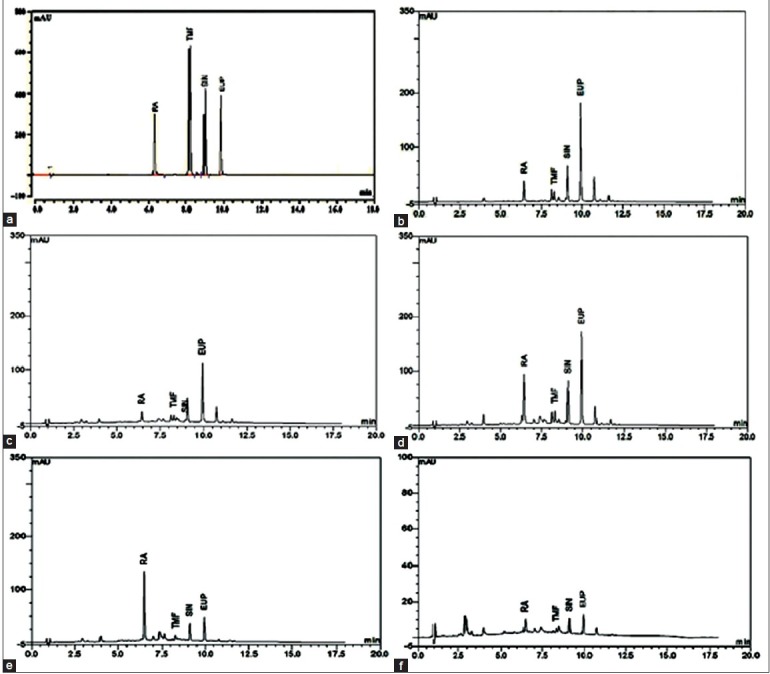
High-performance liquid chromatography chromatograms of Orthosiphon stamineus extracts at 320 nm. Standard mixture of rosmarinic acid, 3’-hydroxy-5, 6, 7, 4’-tetramethoxyflavone, sinensetin and eupatorin (a), methanolic extract (b), methanol:water extract (1:1) (c), ethanolic extract (d), ethanol:water extract (1:1) (e) and water extract (f)
Table 6.
Concentration of RA, TMF, EUP and SIN marker compounds in various leaf extracts of O. stamineus

CONCLUSIONS
Rosmarinic acid, TMF, SIN and EUP were selected as reference compounds for standardization of the O. stamineus extracts due to their various pharmacological effects reported. Several methods have been reported for quantification of these markers in O. stamineus leaf extracts;[3,20,21] however these methods are either time consuming or require the use of complex mobile phase, which may limit their routine application in standardization of O. stamineus extracts, raw leaves and commercial products. Therefore, still there is a need for easier, faster, reliable and versatile methods for the qualitative and quantitative evaluation of the O. stamineus extracts. In this work, an improved method was developed for simultaneous detection of four marker compounds including RA, TMF, SIN and EUP. The method was validated based on ICH guidelines[24] and all of the parameters used were compatible to the guidelines. The present method has several advantages over the existing methods such as shorter run time, use of an environmental friendly mobile phase and the method is reproducible when applied to other HPLC system. Previous methods reported a total run time of 30 min to separate the marker compounds (RA, TMF, SIN, and EUP).[3,20] In another method the run time was improved to < 20 min,[21] but all of these studies have used unfriendly solvent systems which consist of phosphate buffer and tetrahydrofuran that cannot be used directly in the MS analysis. The use of phosphate buffer is not encouraged because it may lead to salt precipitation at the interface, contamination of the needle electrode for atmospheric pressure ionization or interference with creation of fine charged droplets and reduced sensitivity for electrospray ionization. Comprehensive information can be found at website cited below.[26] Our improved method uses 0.1% formic acid as a buffer system which is friendly for MS analysis, because it improves ionization of the compounds. This makes our method suitable for MS analysis of unknown compounds as well, besides the reported marker compounds. We believe that this method is suitable for routine standardization of O. stamineus extracts, raw leaves and commercial products for herbal industries due to its short running time, low cost, high precision, accuracy, sensitivity and hope this method can be applied for future research in pharmacokinetic study.
ACKNOWLEDGMENTS
The authors would like to thank the Universiti Sains Malaysia (USM) for providing the facilities to do the research and for providing financial funding of the project (Grant name: USM-RU-PGRS, and grant number 1001/PFARMASI/843114). We also would like to thank the Ministry of Science, Technology and Innovation (MOSTI) for the scholarship reward. Finally, we would like to thank Mr. Shanmugan A/C Vellosamy, School of Biological Sciences, for authentication of the plant samples and Mr Razak Hamdan for the sharing of the information regarding the LCMS system.
Footnotes
Source of Support: Nil
Conflict of Interest: None declared.
REFERENCES
- 1.Hegnauer R. IV. Stuggart: Birkha¨User Verlag; 1966. Chemotaxonomic Der Planzen; pp. 314–6. [Google Scholar]
- 2.Wagner H. 2nd ed. Stuggart: Gustav Fischer Verlag; 1982. Parmazietische Biologie: Drogen und ihre Inhaltsstoff; pp. 49–50. [Google Scholar]
- 3.Akowuah G, Zhari I, Norhayati I, Sadikun A, Khamsah S. Sinensetin, eupatorin, 3′-hydroxy-5, 6, 7, 4′-tetramethoxyflavone and rosmarinic acid contents and antioxidative effect of Orthosiphon stamineus from Malaysia. Food Chem. 2004;87:559–66. [Google Scholar]
- 4.Akowuah GA, Ismail Z, Norhayati I, Sadikun A. The effects of different extraction solvents of varying polarities on polyphenols of Orthosiphon stamineus and evaluation of the free radical-scavenging activity. Food Chem. 2005;93:311–7. [Google Scholar]
- 5.Khamsah SM, Akowah G, Zhari I. Antioxidant activity and phenolic content of Orthosiphon stamineus benth from different geographical origin. J Sustain Sci Manag. 2006;1:14–20. [Google Scholar]
- 6.Ho CH, Noryati I, Sulaiman SF, Rosma A. In vitro antibacterial and antioxidant activities of Orthosiphon stamineus Benth. extracts against food-borne bacteria. Food Chem. 2010;122:1168–72. [Google Scholar]
- 7.Sahib HB, Aisha AF, Yam MF, Asmawi MZ, Ismail Z, Salhimi SM. NHO and AMSAM. Anti-angiogenic and anti oxidant properties of Orthosiphon stamineus Benth. Methanolic leaves extract. Int J Pharmacol. 2009;5:162–7. [Google Scholar]
- 8.Siddiqui MJ, Hafizoh SN, Ism Z, Sahib HB, Helal MH, Majid AM. Analysis of total proteins, polysaccharides and glycosaponins contents of Orthosiphon stamineus Benth. In Spray and Freeze Dried Methanol: Water (1:1) extract and its contribution to cytotoxic and antiangiogenic activities introduction. Pharmacognosy Res. 2014;1:5–8. [Google Scholar]
- 9.Hussain K, Ismail Z, Sadikun A, Shah AM, Latif A, Hashmi FK. Antiangiogenic activity and bioassay-guided isolation of aqueous extract of Orthosiphon stamineus. J Chin Chem Soc. 2012;59:1137–43. [Google Scholar]
- 10.Dolecková I, Rárová L, Grúz J, Vondrusová M, Strnad M, Kryštof V. Antiproliferative and antiangiogenic effects of flavone eupatorin, an active constituent of chloroform extract of Orthosiphon stamineus leaves. Fitoterapia. 2012;83:1000–7. doi: 10.1016/j.fitote.2012.06.002. [DOI] [PubMed] [Google Scholar]
- 11.Arafat OM, Tham SY, Sadikun A, Zhari I, Haughton PJ, Asmawi MZ. Studies on diuretic and hypouricemic effects of Orthosiphon stamineus methanol extracts in rats. J Ethnopharmacol. 2008;118:354–60. doi: 10.1016/j.jep.2008.04.015. [DOI] [PubMed] [Google Scholar]
- 12.Adam Y, Somchit MN, Sulaiman MR, Nasaruddin AA, Zuraini A, Bustamam AA, et al. Diuretic properties of Orthosiphon stamineus Benth. J Ethnopharmacol. 2009;124:154–8. doi: 10.1016/j.jep.2009.04.014. [DOI] [PubMed] [Google Scholar]
- 13.Wijaya H, Winarno W. Antihyperglycemic activity of functional drinks based on Java Tea (Orthosiphon aristatus) in streptozotocin induced diabetic mice. International Food Research Journal. 2014;21:349–55. [Google Scholar]
- 14.Committee on Malaysian Herbal Monograph. Kuala Lumpur: Malaysian Herbal Monograph; 2009. [Google Scholar]
- 15.British Pharmacopoeia Commission. British Pharmacopoeia. ISBN-13: 9. In: Commission BP, editor. London, UK: The Stationary Office; 2008. [Google Scholar]
- 16.Jakarta: 1980. Health Department of Indonesia. Materia Medika Indonesia. [Google Scholar]
- 17.Sumaryono W, Proksch P, Wray V, Witte L, Hartmann T. Qualitative and Quantitative Analysis of the Phenolic Constituents from Orthosiphon aristatus. Planta Med. 1991;57:176–80. doi: 10.1055/s-2006-960060. [DOI] [PubMed] [Google Scholar]
- 18.Tezuka Y, Stampoulis P, Banskota AH, Awale S, Tran KQ, Saiki I, et al. Constituents of the Vietnamese medicinal plant Orthosiphon stamineus. Chem Pharm Bull (Tokyo) 2000;48:1711–9. doi: 10.1248/cpb.48.1711. [DOI] [PubMed] [Google Scholar]
- 19.Pietta PG, Mauri PL, Gardana C, Bruno A. High-performance liquid chromatography with diode-array ultraviolet detection of methoxylated flavones in Orthosiphon leaves. J Chromatogr A. 1991;547:439–42. [Google Scholar]
- 20.Siddiqui MJ, Ismail Z. Simultaneous analysis of bioactive markers from Orthosiphon stamineus Benth leaves extracts by reverse phase high performance liquid chromatography. Trop J Pharm Res. 2011;10:97–103. [Google Scholar]
- 21.Yam MF, Mohamed EA, Ang LF, Pei L, Darwis Y, Mahmud R, et al. A simple isocratic HPLC method for the simultaneous determination of sinensetin, eupatorin, and 3’- hydroxy-5,6,7,4’- tetramethoxyflavone in Orthosiphon stamineus extracts. J Acupunct Meridian Stud. 2012;5:176–82. doi: 10.1016/j.jams.2012.05.005. [DOI] [PubMed] [Google Scholar]
- 22.Won JB, Ma JY, Um YR, Ma CJ. Simultaneous determination of five marker constituents in Ssanghwa tang by HPLC/DAD. Pharmacogn Mag. 2010;6:111–5. doi: 10.4103/0973-1296.62896. [DOI] [PMC free article] [PubMed] [Google Scholar]
- 23.Weon JB, Ma JY, Yang HJ, Lee B, Yun BR, Ma CJ. Qualitative and quantitative analysis of nine major compounds in the Bozhougyiqi-Tang using a high-performance liquid chromatography coupled with a diode array detector and electrospray ionization mass spectrometer. Pharmacogn Mag. 2013;9:271–82. doi: 10.4103/0973-1296.113291. [DOI] [PMC free article] [PubMed] [Google Scholar]
- 24.FDA. Guidance for Industry Q2B Validation of Analytical Procedures: Methodology Guidance for Industry Q2B Validation of Analytical Procedures: Methodology: FDA. 1996 [Google Scholar]
- 25.Shabir GA. A practical approach to validation of HPLC methods under current good manufacturing practices. Journal of Validation Technology. 2004:29–37. [Google Scholar]
- 26.Introduction to LC-MS Part 4: SHIMADZU (Shimadzu Corporation) [Last cited on 2014 Jun 09]. Available from: http://www.shimadzu.com/an/lcms/support/intro/lib/lctalk/57/57intro.html .


