

Abstract
While the antigenic specificity and pathogenic relevance of immunologic reactivity to gluten in celiac disease have been extensively researched, the immune response to nongluten proteins of wheat has not been characterized. We aimed to investigate the level and molecular specificity of antibody response to wheat nongluten proteins in celiac disease. Serum samples from patients and controls were screened for IgG and IgA antibody reactivity to a nongluten protein extract from the wheat cultivar Triticum aestivum Butte 86. Antibodies were further analyzed for reactivity to specific nongluten proteins by two-dimensional gel electrophoresis and immunoblotting. Immunoreactive molecules were identified by tandem mass spectrometry. Compared with healthy controls, patients exhibited significantly higher levels of antibody reactivity to nongluten proteins. The main immunoreactive nongluten antibody target proteins were identified as serpins, purinins, α-amylase/protease inhibitors, globulins, and farinins. Assessment of reactivity toward purified recombinant proteins further confirmed the presence of antibody response to specific antigens. The results demonstrate that, in addition to the well-recognized immune reaction to gluten, celiac disease is associated with a robust humoral response directed at a specific subset of the nongluten proteins of wheat.
Keywords: Celiac disease, immune response, antibody, serpin, purinin, α-amylase/protease inhibitor, globulin, farinin
Introduction
Celiac disease is a prevalent autoimmune disorder, with documented presence in populations of North and South America, Europe, north Africa, south and west Asia, and Australia.1,2 The symptoms of the disease are triggered in genetically susceptible individuals by ingestion of wheat and related cereal proteins of rye and barley. The ensuing innate and adaptive immune responses to the ingested proteins are responsible for inflammation, villous atrophy, and crypt hyperplasia in the small intestine, as well as the production of autoantibodies against the transglutaminase 2 (TG2) enzyme.3 In addition to intestinal symptoms, celiac disease may involve extra-intestinal complications.4 Dermatitis herpetiformis is the skin manifestation of celiac disease, affecting about 10–20% of celiac disease patients and is characterized by papulovesicular lesions and presence of granular deposits of IgA in the dermal papillae.5,6 Elimination of the offending cereals from diet is currently the only effective mode of treatment for celiac disease.
Willem Karel Dicke was the first to recognize the importance of the removal of wheat and related cereals from diets of celiac disease patients in 1950.7 Shortly after that, the alcohol-soluble subfraction containing the gliadin proteins was determined to contain the main “toxic factor” in the offending grains.8 Gliadin proteins were found to trigger B and T cell-mediated immune responses, which were thought to play a significant role in the inflammatory cascade in celiac disease.9,10 Antibodies against gliadin proteins were demonstrated to be closely associated with celiac disease and were widely utilized as serologic markers of the condition prior to the discovery of anti-TG2 autoantibodies.11,12 Antibodies against specific deamidated sequences of gliadin were eventually found to be more specifically associated with celiac disease than those against unmodified native gliadin.13 In addition to the gliadins, glutenin proteins of wheat, initially thought to be harmless, were later reported to trigger antibody and T cell immune responses in celiac disease patients.14−17
Together, gliadins and glutenins comprise approximately 70 different proteins, collectively referred to as gluten. They are the major storage proteins of wheat and related cereals, representing about 75% of the total protein content of wheat grain.18 An important property of the gluten proteins is their poor solubility in water. The nongluten proteins comprise the remainder of the wheat proteome and include several minor storage proteins, α-amylase/protease inhibitors, and a variety of other enzymes.18 These proteins are generally much more soluble in water or aqueous salt solutions than gluten proteins and have been historically referred to as albumins/globulins. Several nongluten proteins, including α-amylase/protease inhibitor, thiol reductase, serine protease inhibitor (serpin), and β-amylase have been identified as potent allergens in IgE-mediated wheat allergy and/or baker’s asthma.19−21 However, the nongluten proteins of wheat and related cereals generally have been considered to be nontoxic and to lack immunogenic potential in the context of celiac disease. A few studies on small numbers of patients have examined immune reactivity to crude albumin/globulin extracts in celiac disease, with divergent results. The earliest of these investigated antibody reactivities in 24 untreated celiac disease patients (but no healthy controls) by an immunodiffusion assay, reporting antibodies to gliadin in six and to a crude PBS extract of wheat flour in seven patients.22 A subsequently published article reported elevated IgG reactivity to both gliadin and albumin/globulin protein extracts in 15 untreated celiac disease patients when compared with three normal controls, although the patients exhibited significantly lower titers of antibody to the albumin/globulin extract than to gliadin.23 Another report on three patients with celiac disease described increased antibodies to an extract of albumins/globulins in comparison to two controls, but the utilized extract appeared to contain gluten contamination.24 A study of six children with celiac disease found increased antibodies to albumin and globulin fractions in comparison to six unaffected controls, although information about the relative purity of the antigenic mixtures used in the immunoassays was not provided.25 In contrast, the latest of these studies with 10 celiac disease patients found no significant cellular or humoral response to the total extracts of albumins or globulins in comparison to 10 unaffected controls.26 The authors of this study attributed the contradiction between their and others’ observations to the presence of extensive gluten contamination in the earlier studies. A recently published report suggested that the nongluten α-amylase/protease inhibitor proteins play a role in triggering the inflammatory response associated with celiac disease as innate immune activators through the engagement of the TLR4-MD2-CD14 complex, but probably without concomitant B or T cell involvement.27 Apart from these specific studies, the nongluten proteins of wheat and related cereals have not been examined in the context of celiac disease, and their potential for immunogenicity remains unclear. In this study, we use high-resolution two-dimensional gel electrophoresis, immunoblotting, proteome mapping, and tandem mass spectrometry (MS/MS) to show that specific nongluten proteins of wheat trigger a robust humoral immune response in patients with celiac disease or dermatitis herpetiformis.
Materials and Methods
Patients and Controls
Serum samples were from 120 individuals, including 50 patients with celiac disease (18 male, 46 white race, mean [SD] age 44.6 [17.5] years), 20 patients with dermatitis herpetiformis (11 male, 20 white race, mean age 43.1 [20.8] years), and 50 unaffected controls (20 male, 46 white race, mean age 37.1 [11.3] years). All cases of celiac disease were biopsy-proven and diagnosed according to previously described criteria.4 All patients with dermatitis herpetiformis had biopsies demonstrating classic histology, as well as the characteristic immunofluorescence pattern showing clear granular IgA deposits in the dermal papillae. The celiac disease and dermatitis herpetiformis patients were on a gluten-containing diet. Screening questionnaires were used to evaluate the general health of controls. Serum samples were obtained from patients and healthy controls under institutional review board-approved protocols at Columbia University and at University of Utah. This study was approved by the Institutional Review Board of Columbia University Medical Center. All serum samples were maintained at −80 °C for stability.
Protein Extraction
One hundred milligrams of the U.S. hard red spring wheat Triticum aestivum Butte 86 flour was suspended in 1 mL of 40% ethanol and mixed for 30 min at room temperature. The suspension was centrifuged at 10,000 × g for 15 min. The supernate was removed, chilled at 4 °C for 1 h, combined with 1.9 mL of 1.5 M NaCl, and stored at 4 °C overnight. The precipitate was removed by centrifugation, rinsed with H2O, and dissolved in 0.2 mL of 0.1 M glacial acetic acid. The solution, containing gluten proteins, was lyophilized and stored at −20 °C.
The nongluten proteins of Butte 86 wheat flour were extracted as previously described.28 Fifty milligrams of flour was suspended in 200 μL of buffer (50 mM Tris-HCl, 100 mM KCl, 5 mM EDTA, pH 7.8) at 4 °C and incubated for 5 min with intermittent vortex mixing. Samples were centrifuged at 4 °C for 15 min at 14,500 × g. The supernate was collected, and proteins were precipitated by the addition of 4 volumes of cold (−20 °C) acetone. Following incubation overnight at −20 °C, samples were centrifuged at 14,000 × g for 15 min at 4 °C. The pellet was rinsed with cold acetone, air-dried, and stored at −20 °C.
Measurement of Antibody Levels
All patients and controls were tested for the currently recommended full panel of the most sensitive and specific serologic markers of celiac disease, including IgA antibody to TG2, IgG antibody to deamidated gliadin, and IgA antibody to deamidated gliadin. IgA antibody to recombinant human TG2 was measured by ELISA, according to the manufacturer’s protocol (Euroimmun AG, Luebeck, Germany). IgG and IgA antibody reactivities to deamidated gliadin, as represented by a previously described glutamine–glutamate substituted trimer of a fusion peptide containing the sequences PLQPEQPFP and PEQLPQFEE,29 were measured by separate ELISAs, according to the manufacturer’s protocols (Euroimmun AG).
Serum IgG and IgA antibodies to the gluten and nongluten protein extracts were measured separately by ELISA as previously described,30,31 with some modifications. Prior to the ELISA analyses, the protein profile of each extract was assessed by SDS-PAGE, using the XCell SureLock Mini-Cell electrophoresis system, 4–12% NuPAGE Bis-Tris precast gels, and 2-(N-morpholino)ethanesulfonic acid (MES) buffer (Life Technologies, Carlsbad, Calif.). A 2 mg/mL stock solution of the gluten extract in 70% ethanol or the nongluten protein extract in PBS was prepared. Wells of 96-well Maxisorp round-bottom polystyrene plates (Nunc, Roskilde, Denmark) were coated with 50 μL/well of a 0.01 mg/mL solution of protein extract in 0.1 M carbonate buffer (pH 9.6) or left uncoated to serve as controls. After incubation at 37 °C for 1 h, all wells were washed and blocked by incubation with 1% bovine serum albumin (BSA) in PBS containing 0.05% Tween-20 (PBST) for 1.5 h at room temperature. Serum samples were diluted at 1:200 for IgA and at 1:800 for IgG measurement, added at 50 μL/well in duplicate, and incubated for 1 h. Each plate contained a positive control sample from a patient with biopsy-proven celiac disease and elevated IgG and IgA antibodies to each protein extract. After washing, the wells were incubated with HRP-conjugated antihuman IgG (GE Healthcare, Piscataway, N.J.) or IgA (MP Biomedicals, Santa Ana, Calif.) secondary antibodies for 50 min. The plates were washed and 50 μL of developing solution, containing 27 mM citric acid, 50 mM Na2HPO4, 5.5 mM o-phenylenediamine, and 0.01% H2O2 (pH 5), was added to each well. After incubating the plates at room temperature for 20 min, absorbance was measured at 450 nm. All serum samples were tested in duplicate. Absorbance values were corrected for nonspecific binding by subtraction of the mean absorbance of the associated uncoated wells. The corrected values were first normalized according to the mean value of the positive control duplicate on each plate. The mean antibody level for the unrelated healthy control cohort was then set as 1.0 AU, and all other results were normalized accordingly.
Two-Dimensional Gel Electrophoresis
The KCl-soluble proteins were separated by two-dimensional electrophoresis as previously described.18,32 The dried protein was solubilized at 1.2 mg/mL in a solution containing 9 M urea, 4% Nonidet P-40, 1% dithiothreitol, and 2% Servalyt 3-10 Iso-Dalt (Crescent Chemical Co., Islandia, N.Y.). The first dimension capillary tube gels contained 9.2 M urea, 4% (total monomer) acrylamide/Bis, 2% Nonidet P-40, 2% Servalyt 3-10 Iso-Dalt, 0.015% ammonium persulfate, and 0.125% TEMED. Isoelectric focusing was performed using a Mini Protean II Tube Cell (Bio-Rad, Hercules, Calif.). Eighteen micrograms of protein was loaded for gels that were to be Coomassie-stained for visualization of the separated proteins, while 3.6 μg of protein was loaded for gels that were to be used for subsequent transfer and immunoblotting. Proteins were separated in the second dimension by SDS polyacrylamide gel electrophoresis, using the XCell SureLock Mini-Cell electrophoresis system, 4–12% NuPAGE Bis-Tris precast gels, and MES buffer.
Immunoblotting
Protein transfer onto nitrocellulose membranes was carried out with the iBlot Dry Blotting System (Life Technologies). The membranes were incubated for 1 h in a blocking solution made of 5% milk and 0.5% BSA in a solution of Tris-buffered saline containing 0.05% Tween-20 (TBST). Incubation with patient and control serum specimens (1:2000 for IgA and 1:4000 for IgG determination in dilution buffer containing 10% blocking solution and 10% fetal bovine serum in TBST) was done for 1 h. Serum samples from celiac disease (n = 14) and dermatitis herpetiformis (n = 6) patients with elevated IgA and/or IgG antibody reactivity to nongluten proteins, in addition to 5 healthy controls, were included. HRP-conjugated antihuman IgA and IgG were used as secondary antibodies. Detection of bound antibodies was by the ECL system (Millipore, Billerica, Mass.) and autoradiography film (Crystalgen, Commack, N.Y.). Following immunodetection, bound antibodies were removed from the nitrocellulose membranes with Restore Western blot stripping buffer (Thermo Scientific, Rockford, Ill.), and the membrane proteins were visualized using colloidal gold stain (Bio-Rad). Each immunoblot was aligned to its corresponding colloidal gold-stained membrane using the SameSpots software (version 4.5) (TotalLab Ltd., Newcastle upon Tyne, United Kingdom).
Identification of Target Proteins
Proteins in the two-dimensional electrophoresis spots that were the main targets of the antibody response were identified initially by comparison to a previously generated proteomic map of Butte 86 flour.18 Identities of individual spots were then confirmed by MS/MS. Spots were excised from gels and placed in wells of a 96-well reaction plate, leaving a blank well between each sample. Proteins in each sample-well were reduced, alkylated, and then digested with trypsin using a DigestPro instrument (Intavis, Koeln, Germany) according to the manufacturer’s instructions. The resulting tryptic peptides were eluted into a collection tray that was then placed into the autosampler compartment of an EASY-nLC II (Thermo Scientific, Waltham, Mass.) that was interfaced by a nanoelectrospray source to an Orbitrap Elite mass spectrometer (Thermo Scientific). Four microliter fractions were loaded by the autosampler onto an IntegraFrit trap column (100 μm × 200 mm, with 5 μm, 120 Å, ReproSil-Pur C18 AQ packing) (New Objective, Woburn, Mass.), washed with 20 μL of solvent A to remove salts, then switched in-line with the analytical column (75 μm × 10 cm of 3 μm, 120 Å, ReproSil-Pur C18 AQ packing) (New Objective) and eluted with a gradient of 100% solvent A to 30% solvent B over 30 min into the Orbitrap Elite mass spectrometer. Solvent A was water and solvent B was acetonitrile, both Optima LC/MS grade, containing 0.1% formic acid (Thermo Scientific). Peptides were detected in the Orbitrap with the FT survey scan set to scan a range from 300 to 2000 m/z at a resolution of 60,000. The 10 most intense peaks were automatically subjected to collision-induced dissociation (CID). The mass range for the CID scans was set to high and the minimal signal threshold to 10,000. Dynamic exclusion with a repeat count of 1 was enabled for a duration of 10 s. Normalized collision energy was set to 35.
Processing of raw files to mascot generic format (MGF) files was carried out using MSconvert from the ProteoWizard open-source project [http://proteowizard.sourceforge.net/downloads.shtml]. A first pass search of the MS/MS spectra was conducted against the “SuperWheat” database (version #140828). For this study, the “SuperWheat” database (version #100211) described in Dupont et al.18 was updated with NCBI Triticeae (taxid: 147389) protein sequences (download date: 08/28/2014) as well as with the translated sequences of 137 ESTs, contigs, or PCR products from Butte 86 (Supplemental File 1). Mascot version 2.3 [www.matrixscience.com] and X! Tandem version 2010.12.01.1 [http://www.thegpm.org/tandem/] were used to match instrument-generated spectra to FASTA sequences in the “SuperWheat” database. For the first and second pass search, the parent mass tolerance was set to 15 ppm and the fragment error to 0.4 Da. Charge state screening allowed +1, +2, and +3 charge states to be selected, and one missed cleavage was allowed. Analysis, validation, and display of the data were carried out using Scaffold version 4.3.2 [http://www.proteomesoftware.com]. The output results files from the two different search engines were combined in individual folders and analyzed as separate MudPIT experiments. A second database of FASTA files was generated from the first pass search by exporting from Scaffold all proteins that contained one peptide hit and had a protein probability of 20% and peptide probability of 0%. A reverse-concatenated database was created from these sequences. The resulting subset database, containing 14,776 sequences, was used for the second pass search. Criteria for protein acceptance in the second pass search was set in the Scaffold validation software package to a protein probability of 99% and a requirement for four matching peptides having a parent peptide mass accuracy of 2 ppm and a calculated 95% probability. The list of proteins identified in each spot is shown in Supplemental File 2. The protein with the greatest number of exclusive unique spectra was deemed to be the most abundant in each spot. Peptide data for the predominant protein in each spot were extracted from Scaffold. Sequence coverages determined by Scaffold were adjusted for the presence of the signal peptides as predicted by SignalP 4.1 [http://www.cbs.dtu.dk/services/SignalP/]. The data files associated with this study were archived at UCSD Center for Computational Mass Spectrometry in the MassIVE data set project. The raw mass spectrum files, the sequence database files, and the Scaffold results report can be downloaded from ftp://MSV000078887:a@massive.ucsd.edu/. In order to visualize Scaffold report results, a free viewer can be downloaded from http://www.proteomesoftware.com/products/free-viewer. To visualize the instrument raw files, a viewer can be downloaded from the ProteoWizard project at http://proteowizard.sourceforge.net/downloads.shtml. A suitable text editor for viewing the database file is available at http://www.vim.org/download.php.
Expression of Recombinant Proteins
The cDNAs encoding the identified serpin protein in spot 1a (GI: 224589270) and the purinin protein in spot 2a (BU_purinin#3) (Table 2) were synthesized (after codon optimization for an E. coli expression system) based on amino acid sequences shown in Supplemental File 4. For the purinin, a potential signal peptide cleavage site was detected at position 19 and amino acids 1–19 were therefore excluded. The synthesized genes were inserted between the restriction sites NdeI and HindIII of the tag-free vector E3 to create the E. coli expression vectors E3-224589270 and E3-BU_purinin#3. Linearized vectors were transformed into E. coli, and protein expression was induced by adding 100 mM isopropyl β-d-1-thiogalactopyranoside to the culture for 4 h at 37 °C. Cells were lysed in lysis buffer (50 mM Tris, 1 mM PMSF, pH 8.0), and inclusion bodies, containing insoluble proteins, were collected for purification. After washing (50 mM Tris, 1% Triton X-100, 300 mM NaCl, 2 mM DTT, 1 mM EDTA, pH 8.0), pellets were dissolved in 8 M urea. The purified proteins were suspended in refolding buffer (50 mM Tris, 10% glycerol, 150 mM NaCl, pH 8.0). The molecular weight and relative purity of the proteins were assessed by SDS-PAGE, following the above protocol. The identity of each protein was confirmed by mass spectrometry-assisted peptide mass mapping, as previously explained.30
Table 2. Specific Nongluten Proteins Identified by MS/MS as Targets of IgG and/or IgA Antibody Reactivity in Patients with Celiac Disease or Dermatitis Herpetiformis.
| spota | predominant protein typeb | protein IDc | exclusive unique spectrum count | total spectrum count | percent coveraged | total number of patient sera with reactivity to spot (n = 20)e | number of celiac disease sera with reactivity to spot (n = 14)e | number of dermatitis herpetiformis sera with reactivity to spot (n = 6)e |
|---|---|---|---|---|---|---|---|---|
| 1a | serpin | GI: 224589270 | 70 | 122 | 88 | 15 | 9 | 6 |
| 1b | serpin | BU_serpin #2 | 97 | 194 | 92 | 13 | 7 | 6 |
| 1c | serpin | GI: 224589270 | 53 | 96 | 75 | 10 | 5 | 5 |
| 1d | serpin | BU_serpin #2 | 48 | 90 | 68 | 10 | 6 | 4 |
| 1e | serpin | GI: 475621781 | 49 | 173 | 79 | 7 | 3 | 4 |
| 1f | serpin | GI: 871551 | 47 | 85 | 82 | 7 | 3 | 4 |
| 1g | serpin | GI: 475621781 | 48 | 137 | 77 | 2 | 1 | 1 |
| 2a | purinin | BU_purinin #3 | 33 | 55 | 61 | 10 | 7 | 3 |
| 2b | purinin | BU_purinin #2 | 77 | 129 | 77 | 9 | 6 | 3 |
| 2c | 1-cys peroxiredoxinf | RS_UWI_15510 | 61 | 114 | 75 | 6 | 4 | 2 |
| 2d | proteasome subunitg | GI: 475538570 | 22 | 33 | 58 | 1 | 1 | 0 |
| 2e | purininh | BU_purinin #3 | 20 | 20 | 51 | 1 | 1 | 0 |
| 3a | α-amylase/protease inhibitor | GI: 56480630 | 61 | 147 | 100 | 10 | 6 | 4 |
| 3b | α-amylase/protease inhibitor | GI: 253783731 | 41 | 90 | 88 | 10 | 6 | 4 |
| 3c | α-amylase/protease inhibitor | GI: 134034637 | 34 | 89 | 100 | 9 | 7 | 2 |
| 3d | α-amylase/protease inhibitor | GI: 134034637 | 42 | 164 | 100 | 9 | 7 | 2 |
| 3e | α-amylase/protease inhibitor | GI: 123956 | 27 | 62 | 71 | 7 | 4 | 3 |
| 3f | α-amylase/protease inhibitor | GI: 54778511 | 45 | 88 | 94 | 7 | 5 | 2 |
| 3g | α-amylase/protease inhibitor | GI: 123958 | 36 | 99 | 91 | 3 | 3 | 0 |
| 3h | α-amylase/protease inhibitor | GI: 123957 | 37 | 123 | 96 | 1 | 1 | 0 |
| 3i | α-amylase/protease inhibitor | GI: 123957 | 29 | 68 | 96 | 1 | 1 | 0 |
| 4a | globulin | GI: 390979705 | 35 | 53 | 43 | 8 | 5 | 3 |
| 4b | globulin | GI: 390979705 | 46 | 72 | 43 | 8 | 5 | 3 |
| 4c | globulin | GI: 390979705 | 40 | 53 | 47 | 8 | 5 | 3 |
| 4d | globulin | RS_UWI_15518 | 22 | 28 | 27 | 5 | 3 | 2 |
| 5a | farinin | GI: 475609166 | 24 | 71 | 29 | 6 | 5 | 1 |
| 5b | farinin | GI: 475609166 | 15 | 44 | 32 | 4 | 3 | 1 |
| 5c | farinin | GI: 475609166 | 12 | 34 | 23 | 2 | 2 | 0 |
Numbers refer to the specific immunoreactive spots as marked in Figure 3A.
Protein in each spot for which the highest number of exclusive unique spectra were obtained. All proteins identified for each spot are listed in Supplemental File 2.
GI number from NCBI is shown if available. Protein sequences derived from the translation of Butte 86 ESTs or contigs are indicated by “BU”. Protein sequences derived from the translation of contigs from HarvEST 1.14 EST assembly [http://harvest.ucr.edu/] are indicated by “RS_UWI” and were annotated by BLAST searches against NCBI. Sequences of all identified proteins in the table are provided in Supplemental File 4.
Determined after removal of signal peptides predicted by SignalP 4.1 [http://www.cbs.dtu.dk/services/SignalP/]. MS/MS coverage is shown in Supplemental File 3.
Number of sera found to have IgG and/or IgA antibody reactivity to each protein spot, as described in the Materials and Methods section.
MS/MS data indicate that the spot also contains a purinin, BU_purinin #1 (Supplemental Files 2 and 3).
MS/MS data indicate that the spot also contains a purinin, BU_purinin #2 (Supplemental Files 2 and 3).
In this spot, a similar number of exclusive unique spectra were obtained for globulin-2, BU_globulin-2_contig_18428, but a greater number of total spectra were obtained for BU_purinin #3 (Supplemental Files 2 and 3).
Antibody Reactivity to Recombinant Proteins
Antibody reactivity to the generated recombinant serpin and purinin proteins was assessed by immunoblotting. Recombinant proteins (0.2 μg) were separated by SDS-PAGE and transferred onto nitrocellulose membrane. The immunoblotting protocol was as described above. Detection of bound HRP-conjugated secondary antibodies was by ECL and the FluoroChem M imaging system (Protein Simple, Santa Clara, Calif.).
Data Analysis
Differences between groups were analyzed by parametric or nonparametric one-way analysis of variance (ANOVA) with posthoc testing for multiple comparisons. Differences with p values of <0.05 were considered to be statistically significant. Statistical analyses were performed with Prism 6 (GraphPad, San Diego, Calif.).
Results
Measurement of Antibody Levels
IgA antibody to TG2 and IgG/IgA antibodies to deamidated gliadin, which are considered to be highly specific and sensitive for celiac disease, were measured in all patients and controls. Celiac disease and dermatitis herpetiformis groups displayed significantly higher mean levels of IgA anti-TG2 antibody (Figure 1A), IgA antideamidated gliadin antibody (Figure 1B), and IgG antideamidated gliadin antibody (Figure 1B) than those of healthy controls (p < 0.0001 for all comparisons).
Figure 1.

Mean levels of antibody to (A) human TG2 (IgA) and (B) deamidated gliadin fusion peptide (IgA and IgG) in patients with celiac disease and dermatitis herpetiformis in comparison with unaffected controls, as determined by ELISA. Error bars represent the standard error of the mean.
The gel electrophoresis profiles of the gluten and nongluten protein extracts used for the ELISA analyses are shown in Figure 2A. Levels of IgA and IgG class antibodies to the extracted gluten and nongluten protein fractions were measured in all patients and controls. Compared with healthy controls, the two patient groups displayed significantly higher mean levels of IgA (p < 0.0001 for celiac disease; p < 0.001 for dermatitis herpetiformis) and IgG (p < 0.0001 for both) antibody to gluten proteins (Figure 2B). In addition, compared with healthy controls, the celiac disease and dermatitis herpetiformis patient cohorts exhibited significantly increased serum IgA (p < 0.0001 for both) and IgG (p < 0.0001 for both) antibody reactivity to the proteins of the nongluten extract (Figure 2C).
Figure 2.
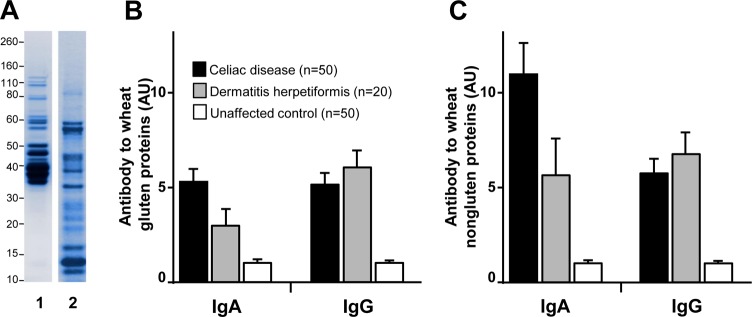
Antibody reactivity to gluten and to nongluten proteins of wheat. (A) Gel electrophoresis profile of the Butte 86 protein preparations used for the antibody assays: (1) gluten extract (5 μg) and (2) nongluten protein extract (5 μg). Molecular weight markers, shown to the left of the panel, are in kDa. (B,C) Comparison of mean levels of IgA and IgG antibodies to gluten (B) and nongluten (C) proteins in patients with celiac disease or dermatitis herpetiformis in comparison with unaffected controls, as determined by ELISA. Error bars represent the standard error of the mean.
Immunoblotting and Identification of Target Proteins
In order to identify the molecular targets of the detected increased antibody response to nongluten proteins in celiac disease and dermatitis herpetiformis patients, a randomly selected subset of antibody-positive sera was further analyzed. Antibody reactivity was characterized by immunoblotting following two-dimensional separation of the nongluten proteins of the wheat cultivar Butte 86. The two-dimensional electrophoresis pattern of the nongluten proteins following Coomassie staining is shown in Figure 3A. The immunoblotting analyses demonstrated antibody reactivity to specific nongluten proteins of wheat in 19 of 20 analyzed patient sera. These included 10 of 11 celiac disease and 2 of 3 dermatitis herpetiformis samples tested for IgA reactivity, and 9 of 9 celiac disease and 6 of 6 dermatitis herpetiformis samples tested for IgG reactivity. None of the control sera exhibited antibody binding to any proteins at the dilutions and exposures tested. Immunoblot images from representative patients and controls are shown in Figure 3B–G.
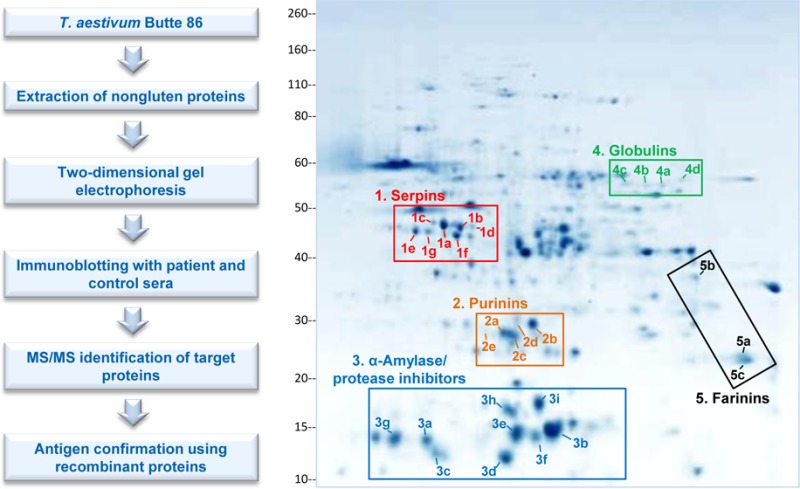
Figure 3.

Identification of specific nongluten proteins targeted by antibody response in celiac disease. (A) Pattern of proteins of the nongluten extract after separation by two-dimensional gel electrophoresis and Coomassie staining. Numbered spots refer to proteins identified as antibody targets in patients. Proteins in five groups, shown in boxes, were found to be the main nongluten antigen targets of the antibody response: serpins, purinins, α-amylase/protease inhibitors, globulins, and farinins. Group numbers correspond to those in Table 1. Individual protein spot numbers correspond to those in Table 2. (B–E) Immunoblots showing serum antibody reactivity to the two-dimensionally separated proteins in representative patients and healthy controls: (B) IgG reactivity to serpins, purinins, α-amylase/protease inhibitors, globulins, and farinins in a patient with celiac disease; (C) IgG reactivity to serpins, purinins, and α-amylase/protease inhibitors in a patient with celiac disease; (D) IgG reactivity to serpins and globulins in a patient with dermatitis herpetiformis; (E) IgA reactivity to serpins and farinins in a patient with dermatitis herpetiformis; (F) IgG and (G) IgA reactivity in healthy controls, indicating lack of binding to nongluten proteins. Molecular weight markers (in kDa) are shown to the left of each panel.
Proteins within five regions of the two-dimensional gels reacted with patient sera (Figure 3). Comparison of the positions of the reactive proteins with a proteomic map of Butte 86 flour18 suggested that the reactive proteins belonged to the following distinct protein groups: serpins, purinins, α-amylase/protease inhibitors, globulins, and farinins (Figure 3 and Table 1). Identities of proteins in individual spots that reacted with sera were verified by MS/MS using an Orbitrap Elite mass spectrometer and subsequent database search. The generated data files are archived as described in Materials and Methods. The predominant protein in each target spot is reported in Table 2. Peptide data for the predominant protein in each spot are displayed in Supplemental File 3, along with the sequence coverage of each protein. Supplemental File 4 contains the amino acid sequences of the identified target proteins from Table 2. Because of the sensitivity of the instrument, the analysis indicated that most spots contained multiple proteins (Supplemental File 2). However, the majority of the spectra obtained from each spot corresponded to a specific protein that was deemed the predominant protein in the spot (Table 2 and Supplemental Files 2 and 3). The MS/MS data confirmed the presence of the five protein types that had been initially identified through comparison of spot positions with the proteomic map of Butte 86 flour. For spots 2c and 2d, the MS/MS data indicated that the spots contained purinin proteins (BU_purinin#1 and BU_purinin#2) (Supplemental Files 2 and 3 and Table 2), even though nonpurinin type proteins in those spots had the highest exclusive unique spectrum count.
Table 1. Nongluten Protein Types Identified as Targets of IgG and/or IgA Antibody Reactivity in Patients with Celiac Disease or Dermatitis Herpetiformis.a.
| protein groupb | number of reactive spots in group | protein typec | total number of patient sera with reactivity to spots in group (n = 20)c | number of celiac disease sera with reactivity to spots in group (n = 14)c | number of dermatitis herpetiformis sera with reactivity to spots in group (n = 6)c |
|---|---|---|---|---|---|
| 1 | 7 | serpin | 15 | 9 | 6 |
| 2 | 5 | purinin | 13 | 10 | 3 |
| 3 | 9 | α-amylase/protease inhibitor | 12 | 7 | 5 |
| 4 | 4 | globulin | 8 | 5 | 3 |
| 5 | 3 | farinin | 7 | 6 | 1 |
Five distinct protein groups were identified as the main targets of the antibody response through comparison of the positions of the reactive proteins with a proteomic map of Butte 86 flour: serpins, purinins, α-amylase/protease inhibitors, globulins, and farinins.
Numbers refer to the specific immunoreactive protein groups, as marked in Figure 3A.
Number of sera found to have IgG and/or IgA antibody reactivity to spots in each protein type group, as described in the Materials and Methods section.
Description of results according to patient group is presented in Tables 1 and 2. Patients were most frequently reactive to serpins (75% of tested celiac disease and dermatitis herpetiformis patient samples), followed by purinins (65%), α-amylase/protease inhibitors (60%), globulins (40%), and farinins (35%). The most frequently reactive individual protein spot was identified as a serpin (spot 1a in Figure 3A; GI: 224589270) (Table 2). Fifteen of the 20 patients (75%) and none of the controls exhibited antibody reactivity to this protein spot. Within the purinin group, the most reactive spot (2a) was identified as BU_purinin #3; 10 of 20 patients (50%) displayed antibody reactivity to it. Frequencies of reactivity to the identified proteins did not appear to be substantially different between the celiac disease and dermatitis herpetiformis groups.
Antibody Reactivity to Recombinant Proteins
In order to further confirm the presence of antibody reactivity to selected nongluten antigens identified in this study, we generated proteins by recombinant expression based on the available amino acid sequences for the serpin in spot 1a and the purinin in spot 2a. Immunoblotting with the recombinant proteins confirmed the presence of IgG and/or IgA antibody reactivity to the specific serpin and purinin proteins in patients with celiac disease or dermatitis herpetiformis who had been found to be positive for antibodies to spot 1a and/or spot 2a (Figure 4). Healthy controls did not display any reactivity at the serum dilutions and image acquisition exposures used.
Figure 4.
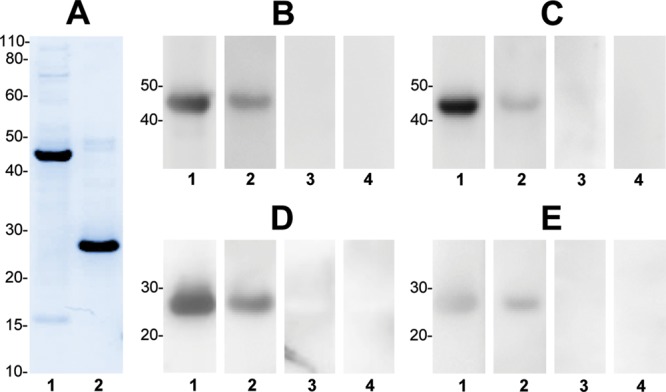
Serum antibody reactivity to a recombinant serpin, representing spot 1a (GI: 224589270), and a recombinant purinin representing spot 2a (BU_purinin #3). (A) SDS-PAGE profile of the purified recombinant serpin (lane 1) and purinin (lane 2) proteins, following Coomassie staining. (B–E) Immunoblotting with the recombinant proteins, demonstrating IgA (B,D) and IgG (C,E) antibody reactivity to serpin (B,C) and purinin (D,E). Lanes 1 and 2 correspond to sera from two representative patients, while lanes 3 and 4 represent sera from two healthy controls. Molecular weight markers are shown to the left of each panel (in kDa).
Discussion
Heightened adaptive immune response to ingested gluten proteins of wheat and related cereals is a hallmark of celiac disease. A few earlier studies, carried out on small numbers of celiac disease patients, had attempted to assess immune reactivity to nongluten proteins of wheat.22−26 However, the results were inconsistent, and the purity of the antigenic mixture in the crude nongluten protein extracts used for detecting immune reactivity was later questioned.26 Here, we have demonstrated the presence of a robust humoral response to specific nongluten proteins of wheat in patients with celiac disease and dermatitis herpetiformis. The detailed analysis of antibody reactivity through two-dimensional immunoblotting and MS/MS identification of target proteins provides unequivocal confirmation that the main targets of the antibody response are, in fact, specific proteins that have not been categorized as gluten or previously recognized as triggers of humoral response in celiac disease. A serpin protein was the most reactive nongluten antigen identified. Wheat serpin proteins belong to the large family of serine protease inhibitors that are present in many organisms, most of them acting as suicide substrate inhibitors of chymotrypsin-like proteases.33 Other nongluten target antigens of wheat included purinin, α-amylase/protease inhibitor, globulin, and farinin proteins.
The mechanism responsible for generating antibodies against proteins that are generally thought of as nontoxic in the context of celiac disease is not clear. The elevated antibody reactivity to nongluten proteins may be driven by the enhanced inflammatory environment in the gut, brought on by the villous damage and ensuing epithelial barrier dysfunction that are triggered by gluten in celiac disease. However, it should be noted that we did not detect antibodies against a broad array of nongluten proteins. For example, no antibody reactivity to triticin proteins, which are present at similar or higher concentration in wheat flour as serpins, globulins, farinins, and purinins, was found.18 Also, serpins make up a substantially lower percentage of total protein content of Butte 86 flour than the α-amylase/protease inhibitors but were a more frequent target of patient antibody response. Therefore, the elevated antibody reactivity to nongluten proteins appears to be directed at a rather specific set of antigens.
Another possibility is that the peripheral antibody response to gluten proteins in celiac disease may cross-react with specific nongluten antigens that contain similar epitopes, thus contributing to the detected levels of antibodies against nongluten proteins. A homology analysis indicates that the newly named purinin proteins34 are close in sequence to γ-gliadins. In addition, there are short sequences in the identified α-amylase/protease inhibitors and another newly characterized group of proteins, the farinins,34 which are similar to those in certain γ-gliadin and low molecular weight glutenin proteins. In addition, the reactive centers of some of the identified serpin antigens resemble the glutamine-rich repeats in gluten proteins.35 Whether these particular shared sequences are actually immunogenic and capable of contributing to the presence of cross-reactive antibodies, however, is not obvious at this point and needs further investigation.
The observed increase in IgA and IgG antibody responses to specific nongluten proteins brings up the obvious question of whether the identified immune response might be relevant to the pathogenic mechanism of celiac disease. Similar to gluten proteins, serpins and α-amylase/protease inhibitors are resistant to proteolytic digestion and are therefore likely to be present in the form of long stretches of incompletely digested, and potentially immunogenic, sequences in the small intestine. The observed IgA, along with IgG, reactivity to the identified nongluten proteins points to a mucosal origin for the immune-triggering event. However, it remains to be seen whether the mucosal B cell response is accompanied by a corresponding intestinal CD4+ T cell reactivity to the nongluten proteins. Presence of lamina propria CD4+ T cells with specificity for sequences of the identified nongluten proteins may contribute to the celiac disease-associated pathways in the gut, for example, by providing additional help to the autoreactive CD8+ intraepithelial cytotoxic T cells that drive epithelial cell damage. It is also possible that the detected antibodies to nongluten proteins would themselves contribute to the mucosal lesion. Similar to the effect shown for antigluten antibodies, the antibodies against the nongluten proteins may be involved in inducing local complement activation and mucosal damage.36 They may also contribute to recruitment of various leukocytes that lead to antibody-dependent cell-mediated cytotoxicity, a process that has been previously demonstrated for antibodies to gluten.37 However, the observed immune response to nongluten proteins, as was mentioned earlier, may be the result and a bystander marker of intestinal barrier damage and inflammation, without playing a role in the pathogenic mechanism of celiac disease.
In conclusion, the results of this study clearly demonstrate that the humoral response to wheat in celiac disease is not limited to gluten antigens but is also directed at specific nongluten proteins. While direct conclusions cannot be drawn about the pathogenic effects of the identified nongluten proteins, these findings should prompt further research into their potential role in contributing to the inflammatory processes that result in mucosal damage in patients with celiac disease. The possibility of such a role for these proteins is worthy of attention, especially as therapies other than gluten exclusion from the diet are under development.38 For example, proteolytic enzymes with specificity for the toxic fragments of gluten,39 may be insufficiently active against other immunogenic proteins. In addition, further investigation of the utility of the identified antibodies as potential biomarkers in celiac disease or other gluten-related disorders may be warranted.
Acknowledgments
We would like to thank Dr. Carolina Arguelles-Grande and Ms. Maria Minaya of Columbia University for their involvement in specimen collection and organization. We are grateful to the research participants involved. Mention of trade names or commercial products in this report is solely for the purpose of providing specific information and does not imply endorsement by the USDA. The USDA is an equal opportunity provider and employer. Funding was provided by National Center for Advancing Translational Sciences, NIH, through Grant Number UL1 TR000040. Study sponsor had no role in study design or in collection, analysis, and interpretation of data.
Supporting Information Available
Supplemental file 1. Translated sequences of 137 ESTs, contigs, or PCR products from Butte 86 that were included in the “SuperWheat” database. Supplemental file 2. Data extracted from Scaffold showing the proteins identified in each spot. Supplemental file 3. Peptide data and sequence coverage for the predominant protein in each spot. Supplemental file 4. Amino acid sequences of the identified target proteins from Table 2. This material is available free of charge via the Internet at http://pubs.acs.org.
The authors declare no competing financial interest.
Funding Statement
National Institutes of Health, United States
Supplementary Material
References
- Fasano A.; Catassi C. Current approaches to diagnosis and treatment of celiac disease: an evolving spectrum. Gastroenterology 2001, 1203636–651. [DOI] [PubMed] [Google Scholar]
- Green P. H.; Jabri B. Coeliac Disease. Lancet 2003, 362, 383–391. [DOI] [PubMed] [Google Scholar]
- Briani C.; Samaroo D.; Alaedini A. Celiac disease: from gluten to autoimmunity. Autoimmun. Rev. 2008, 78644–650. [DOI] [PubMed] [Google Scholar]
- Alaedini A.; Green P. H. Narrative review: celiac disease: understanding a complex autoimmune disorder. Ann. Int. Med. 2005, 1424289–298. [DOI] [PubMed] [Google Scholar]
- Reunala T. L. Dermatitis herpetiformis. Clin. Dermatol. 2001, 196728–736. [DOI] [PubMed] [Google Scholar]
- Fry L. Dermatitis herpetiformis: problems, progress and prospects. Eur. J. Dermatol. 2002, 126523–531. [PubMed] [Google Scholar]
- Dicke W. K.Investigation of the harmful effects of certain types of cereal on patients with coeliac disease. Ph.D. Thesis, University of Utrecht, 1950. [Google Scholar]
- Van De Kamer J. H.; Weijers H. A.; Dicke W. K. Coeliac disease. IV. An investigation into the injurious constituents of wheat in connection with their action on patients with coeliac disease. Acta Paediatr. 1953, 423223–231. [DOI] [PubMed] [Google Scholar]
- Berger E.; Buergin-Wolff A.; Freudenberg E. Diagnostic value of the demonstration of gliadin antibodies in celiac disease. Klin. Wochenschr. 1964, 42, 788–790. [DOI] [PubMed] [Google Scholar]
- Ferguson A.; MacDonald T. T.; McClure J. P.; Holden R. J. Cell-mediated immunity to gliadin within the small-intestinal mucosa in coeliac disease. Lancet 1975, 17912895–897. [DOI] [PubMed] [Google Scholar]
- Signer E.; Burgin-Wolff A.; Berger R.; Birbaumer A.; Just M. Antibodies to gliadin as a screening test for coeliac disease. A prospective study. Helv. Paediatr. Acta 1979, 34141–52. [PubMed] [Google Scholar]
- Unsworth D. J.; Kieffer M.; Holborow E. J.; Coombs R. R.; Walker-Smith J. A. IgA anti-gliadin antibodies in coeliac disease. Clin. Exp. Immunol. 1981, 462286–293. [PMC free article] [PubMed] [Google Scholar]
- Mothes T. Deamidated gliadin peptides as targets for celiac disease-specific antibodies. Adv. Clin. Chem. 2007, 44, 35–63. [DOI] [PubMed] [Google Scholar]
- van de Wal Y.; Kooy Y. M.; van Veelen P.; Vader W.; August S. A.; Drijfhout J. W.; Pena S. A.; Koning F. Glutenin is involved in the gluten-driven mucosal T cell response. Eur. J. Immunol. 1999, 29103133–3139. [DOI] [PubMed] [Google Scholar]
- Skerritt J. H.; Devery J. M.; Penttila I. A.; LaBrooy J. T. Cellular and humoral responses in coeliac disease. 2. Protein extracts from different cereals. Clin. Chim. Acta 1991, 2041–3109–122. [DOI] [PubMed] [Google Scholar]
- Vader W.; Kooy Y.; Van Veelen P.; De Ru A.; Harris D.; Benckhuijsen W.; Pena S.; Mearin L.; Drijfhout J. W.; Koning F. The gluten response in children with celiac disease is directed toward multiple gliadin and glutenin peptides. Gastroenterology 2002, 12271729–1737. [DOI] [PubMed] [Google Scholar]
- Ellis H. J.; Lozano-Sanchez P.; Bermudo Redondo C.; Suligoj T.; Biagi F.; Bianchi P. I.; Corazza G. R.; De Silvestri A.; Bravi E.; Katakis I.; O’Sullivan C. K.; Ciclitira P. J. Antibodies to wheat high-molecular-weight glutenin subunits in patients with celiac disease. Int. Arch. Allergy Immunol. 2012, 1594428–434. [DOI] [PubMed] [Google Scholar]
- Dupont F. M.; Vensel W. H.; Tanaka C. K.; Hurkman W. J.; Altenbach S. B. Deciphering the complexities of the wheat flour proteome using quantitative two-dimensional electrophoresis, three proteases and tandem mass spectrometry. Proteome Sci. 2011, 9, 10. [DOI] [PMC free article] [PubMed] [Google Scholar]
- Sander I.; Rozynek P.; Rihs H. P.; van Kampen V.; Chew F. T.; Lee W. S.; Kotschy-Lang N.; Merget R.; Bruning T.; Raulf-Heimsoth M. Multiple wheat flour allergens and cross-reactive carbohydrate determinants bind IgE in baker’s asthma. Allergy 2011, 6691208–1215. [DOI] [PubMed] [Google Scholar]
- Sotkovsky P.; Hubalek M.; Hernychova L.; Novak P.; Havranova M.; Setinova I.; Kitanovicova A.; Fuchs M.; Stulik J.; Tuckova L. Proteomic analysis of wheat proteins recognized by IgE antibodies of allergic patients. Proteomics 2008, 881677–1691. [DOI] [PubMed] [Google Scholar]
- Larre C.; Lupi R.; Gombaud G.; Brossard C.; Branlard G.; Moneret-Vautrin D. A.; Rogniaux H.; Denery-Papini S. Assessment of allergenicity of diploid and hexaploid wheat genotypes: identification of allergens in the albumin/globulin fraction. J. Proteomics 2011, 7481279–1289. [DOI] [PubMed] [Google Scholar]
- Kenrick K. G.; Walker-Smith J. A. Immunoglobulins and dietary protein antibodies in childhood coeliac disease. Gut 1970, 118635–640. [DOI] [PMC free article] [PubMed] [Google Scholar]
- Stern M.; Fischer K.; Gruttner R. Immunofluorescent serum gliadin antibodies in children with coeliac disease and various malabsorptive disorders. II. Specificity of Gliadin antibodies: immunoglobulin classes, immunogenic properties of wheat protein fractions, and pathogenic significance of food antibodies in coeliac disease. Eur. J. Pediatr. 1979, 1303165–172. [DOI] [PubMed] [Google Scholar]
- Kieffer M.; Frazier P. J.; Daniels N. W.; Coombs R. R. Wheat gliadin fractions and other cereal antigens reactive with antibodies in the sera of coeliac patients. Clin. Exp. Immunol. 1982, 503651–660. [PMC free article] [PubMed] [Google Scholar]
- Troncone R.; Auricchio S.; De Vincenzi M.; Donatiello A.; Farris E.; Silano V. An analysis of cereals that react with serum antibodies in patients with coeliac disease. J. Pediatr. Gastroenterol. Nutr. 1987, 63346–350. [DOI] [PubMed] [Google Scholar]
- Penttila I. A.; Devery J. M.; Gibson C. E.; LaBrooy J. T.; Skerritt J. H. Cellular and humoral responses in coeliac disease. 1. Wheat protein fractions. Clin. Chim. Acta 1991, 2041–395–107. [DOI] [PubMed] [Google Scholar]
- Junker Y.; Zeissig S.; Kim S. J.; Barisani D.; Wieser H.; Leffler D. A.; Zevallos V.; Libermann T. A.; Dillon S.; Freitag T. L.; Kelly C. P.; Schuppan D. Wheat amylase trypsin inhibitors drive intestinal inflammation via activation of toll-like receptor 4. J. Exp. Med. 2012, 209132395–2408. [DOI] [PMC free article] [PubMed] [Google Scholar]
- Vensel W. H.; Tanaka C. K.; Cai N.; Wong J. H.; Buchanan B. B.; Hurkman W. J. Developmental changes in the metabolic protein profiles of wheat endosperm. Proteomics 2005, 561594–1611. [DOI] [PubMed] [Google Scholar]
- Schwertz E.; Kahlenberg F.; Sack U.; Richter T.; Stern M.; Conrad K.; Zimmer K. P.; Mothes T. Serologic assay based on gliadin-related nonapeptides as a highly sensitive and specific diagnostic aid in celiac disease. Clin. Chem. 2004, 50122370–2375. [DOI] [PubMed] [Google Scholar]
- Alaedini A.; Okamoto H.; Briani C.; Wollenberg K.; Shill H. A.; Bushara K. O.; Sander H. W.; Green P. H.; Hallett M.; Latov N. Immune cross-reactivity in celiac disease: anti-gliadin antibodies bind to neuronal synapsin I. J. Immunol. 2007, 178106590–6595. [DOI] [PubMed] [Google Scholar]
- Samaroo D.; Dickerson F.; Kasarda D. D.; Green P. H.; Briani C.; Yolken R. H.; Alaedini A. Novel immune response to gluten in individuals with schizophrenia. Schizophr. Res. 2010, 1181–3248–255. [DOI] [PMC free article] [PubMed] [Google Scholar]
- Hurkman W. J.; Tanaka C. K. Improved methods for separation of wheat endosperm proteins and analysis by two-dimensional gel electrophoresis. J. Cereal Sci. 2004, 40, 295–299. [Google Scholar]
- Gatto M.; Iaccarino L.; Ghirardello A.; Bassi N.; Pontisso P.; Punzi L.; Shoenfeld Y.; Doria A. Serpins, immunity and autoimmunity: old molecules, new functions. Clin. Rev. Allergy Immunol. 2013, 452267–280. [DOI] [PubMed] [Google Scholar]
- Kasarda D. D.; Adalsteins E.; Lew E. J.; Lazo G. R.; Altenbach S. B. Farinin: Characterization of a novel wheat endosperm protein belonging to the prolamin superfamily. J. Agric. Food Chem. 2013, 61, 2407–2417. [DOI] [PubMed] [Google Scholar]
- Ostergaard H.; Rasmussen S. K.; Roberts T. H.; Hejgaard J. Inhibitory serpins from wheat grain with reactive centers resembling glutamine-rich repeats of prolamin storage proteins. Cloning and characterization of five major molecular forms. J. Biol. Chem. 2000, 2754333272–33279. [DOI] [PubMed] [Google Scholar]
- Halstensen T. S.; Hvatum M.; Scott H.; Fausa O.; Brandtzaeg P. Association of subepithelial deposition of activated complement and immunoglobulin G and M response to gluten in celiac disease. Gastroenterology 1992, 1023751–759. [DOI] [PubMed] [Google Scholar]
- Saalman R.; Dahlgren U. I.; Fallstrom S. P.; Hanson L. A.; Ahlstedt S.; Wold A. E. IgG subclass profile of serum antigliadin antibodies and antibody-dependent cell-mediated cytotoxicity in young children with coeliac disease. Scand. J. Immunol 2001, 53192–98. [DOI] [PubMed] [Google Scholar]
- Rashtak S.; Murray J. A. Review article: coeliac disease, new approaches to therapy. Aliment Pharmacol. Ther. 2012, 357768–781. [DOI] [PMC free article] [PubMed] [Google Scholar]
- Mukherjee R.; Kelly C. P.; Schuppan D. Nondietary therapies for celiac disease. Gastrointest. Endosc. Clin. N. Am. 2012, 224811–831. [DOI] [PubMed] [Google Scholar]
Associated Data
This section collects any data citations, data availability statements, or supplementary materials included in this article.