

Abstract
Background & Aims
Proinflammatory and profibrotic cytokines such as osteopontin (OPN) and tumor necrosis factor-alpha receptor 1 (TNFR1) may be critically involved in the pathogenesis of cholangiopathies and biliary fibrosis. We therefore aimed to determine the role of genetic loss of either OPN or TNFR1 in 3,5-diethoxycarbonyl-1,4-dihydrocollidine (DDC)-fed mice as a model of xenobiotic-induced sclerosing cholangitis with biliary-type liver fibrosis using respective knock-out mice.
Methods
OPN and TNFR1 knock-out mice were fed a 0.1% DDC-supplemented diet for 4 weeks and compared to corresponding wild type (WT) controls. Liver morphology (H&E staining), serum markers of liver injury and cholestasis (ALT, AP, bilirubin), markers of inflammation in liver (CD11b and F4/80 immunostaining, mRNA expression of iNOS, MCP-1, IL-1β, INF-γ, TNF-α, and OPN), degree of ductular reaction (immunohistochemistry with morphometric analysis and Western blotting for cholangiocyte specific marker keratin 19) and degree of liver fibrosis (Sirius red-staining, hepatic hydroxyproline content for quantification) were compared between groups.
Results
DDC feeding in OPN and TNFR1 knock-out mice and respective WT controls resulted in comparable extent of liver injury, inflammatory response, ductular reaction, and liver fibrosis.
Summary & Conclusions
Our data indicate that genetic loss of neither OPN nor TNFR1 significantly impacts on the pathogenesis of DDC-induced sclerosing cholangitis, ductular reaction and resulting biliary fibrosis.
Keywords: biliary fibrosis, bile acids, cholangiocytes, cholestasis, cholestatic liver disease, cytokines, ductular reaction, epithelial mesenchymal transition (EMT), osteopontin, tumor necrosis factor alpha, sclerosing cholangitis
Introduction
Cholangiopathies such as primary sclerosing cholangitits (PSC), secondary sclerosing cholangitis (SSC), primary biliary cirrhosis (PBC), and drug-induced bile duct damage may result in a vanishing bile duct syndrome that can progress to biliary cirrhosis; these disorders represent a major indication for liver transplantation and cause of liver-related death 1. Despite profound differences among cholangiopathies in regard to their pathogenesis, pathological features and clinical presentation, these disorders share several common features since (i) bile duct epithelial cells (BECs) represent major victims in cholangiopathies, (ii) the inflammatory infiltrate is focused to portal fields and especially to bile ducts, and (iii) ductular reaction as well as (iv) biliary fibrosis with characteristic porto-portal bridging and broadened fibrotic portal fields are frequently observed (for review please see1–4). More specifically, the distinct bile duct lesion in PSC and SSC is characterized by a fibro-obliterative reaction with onion-skin type periductal fibrosis of the medium sized and large bile ducts. Chronic 3,5-diethoxycarbonyl-1,4-dihydrocollidine (DDC) feeding in mice is a well established model to study Mallory-Denk body formation, which are hepatocellular inclusion bodies characteristically associated with alcoholic and non-alcoholic steatohepatitis, metabolic liver diseases (e.g. Wilson’s disease and other forms of copper toxicities) and chronic cholestatic liver diseases 5. In addition, we have previously demonstrated that DDC feeding in mice results in cholangitis with pronounced ductular reaction, onion-skin type like periductal fibrosis, and finally liver fibrosis of the biliary type 6. Therefore, the model of DDC-induced cholangiopathy and biliary fibrosis in mice shares several specific pathological hallmarks with at least some human cholangiopathies associated with biliary type of liver fibrosis, in particular PSC and SSC. This model may thus be useful to investigate the mechanisms of chronic cholangiopathies and their sequels including liver fibrosis of the biliary type.
Specific cytokines may play a pivotal role in the orchestrated interplay activated bile duct epithelial cells (BECs), extracellular matrix-producing cells such between as hepatic stellate cells and periductal myofibroblasts, inflammatory cells (e.g. neutrophils, natural killer cells, Kupffer cells), and vascular smooth muscle cells localized in vessel walls, ultimately causing a cholangiopathy-related biliary fibrosis 7–10. Hepatic osteopontin (OPN) expression strongly correlates with ductular reaction and the degree of liver fibrosis in patients with biliary atresia 11. In addition, OPN was demonstrated to be critically engaged in the hepatic inflammatory response and fibrogenesis in alcoholic steatohepatitis (ASH) 6,12. Interestingly enough, expression of OPN in renal tubular epithelial cells is considered a central mediator and marker of epithelial-mesenchymal transition (EMT), a term that refers to the phenotypic conversion of tubular epithelial cells to differentiated matrix producing cells. The process of EMT has received great attention and its role in kidney fibrosis has been studied extensively in recent years 13,14. Moreover, the EMT concept has been successfully translated to liver fibrogenesis 15–21. Especially in cholestatic liver diseases and their corresponding animal models EMT, namely from bile duct epithelial cells into myofibroblasts, is supposed to play a pivotal role in the initiation and perpetuation of liver fibrosis 15,17. As such, previous studies in the DDC-fed mouse model showed pronounced induction of hepatic OPN in BECs (including BECs in reactive ductules) and hepatocytes in acinar zone 1 according to those lobular regions where adjacent porto-portal septa develop in later in the disease course 6. These findings pointed toward a potential pathogenetic role of OPN in DDC-induced biliary type of liver fibrosis. However the relative contribution of EMT to liver fibrosis is still a matter of active debate and little is known about the specific role of OPN in the initiation and progression of liver fibrosis of the biliary type.
Tumor necrosis factor alpha and its receptor-1 (TNFR1) represent key molecules critically engaged in the pathogenesis of numerous liver diseases including viral or toxin-induced hepatitis and its sequel liver fibrosis 22–24. In addition, anti-TNF-α antibodies were shown to reduce hepatic inflammation and fibrosis 25,26. We have recently demonstrated induction of TNF-α mRNA expression in Kupffer cells, endothelial cells, and interestingly in reactive BECs in DDC-fed mice 6 suggesting that activation of TNF receptor pathways may also be critically engaged in the pathogenesis of DDC-induced cholangiopathy and resulting biliary fibrosis. However, the relative contribution of TNFR1 activation in the pathobiology of cholangitis and biliary fibrosis in the DDC model remains elusive.
Based on these findings and unresolved questions we hypothesized that TNFR1 and OPN are critically engaged in the pathogenesis of DDC-induced cholangiopathy with biliary fibrosis. This hypothesis was addressed by studying the inflammatory and fibrotic response to DDC in TNFR1 and OPN knock-out mice in comparison to their corresponding wild type (WT) controls.
Materials and Methods
Animals
Experiments were performed with 2-month-old male mice weighing 25 to 30 g. OPN (stock # 004936; congenic C57BL/6) and TNFR1 (stock # 003242; C57BL/6J) knockout mice (from Jackson Laboratory) and respective WT mice were fed a 0.1% DDC-supplemented diet for 4 weeks, housed with a 12:12 hour light:dark cycle, and permitted water ad libitum. Controls where fed a standard mouse diet (Sniff, Soest, Germany). The experimental protocols where approved by the local Animal Care and Use Committee according to criteria outlined in the Guide for the Care and Use of Laboratory Animals prepared by the National Academy of Sciences, as published by the National Institutes of Health (NIH publication 86-23, revised 1985).
Serum biochemical analysis and liver histology
Serum samples were stored at −70°C until analysis of alanine transaminase (ALT) and alkaline phosphatase (AP) and bilirubin by a Hitachi 917 analyzer (Boehringer Mannheim, Mannheim, Germany). For conventional light microscopy, livers were fixed in 4% neutral buffered formaldehyde solution and embedded in paraffin. Sections (4 μm thick) were stained with H&E.
Immunohistochemical studies
Antibodies and conditions for immunohistochemical staining of Kupffer cells (F4/80), BECs (keratin 19; K19), inflammatory cells such as neutrophil granulocytes and macrophages (CD11b), vascular cell adhesion molecule (VCAM), and α-smooth muscle antigen (α-SMA) are summarized in Suppl. Table 1. For morphometry of K19-positive bile ducts, the measurements were performed using of a semiautomatic system for image analysis. This consisted of a microscope (Nikon E600; Nikon, Osaka, Japan), a video camera (Sony DXC-930P; Sony, Tokyo, Japan), a frame grabber (Integral Tech. Intrigue Pro, Indianapolis, IN) and a personal computer with image analysis software (Optimas 6.51; Media Cybernetics Inc, Carlsbad, CA) installed. Approximate borders of a portal field were traced with a mouse by the operator at 20x objective magnification. A specially developed macro command served for automatic identification and measurement of the total area of cells positive for K19 within the given portal field. In addition, the area of the corresponding portal vein was also measured and used in statistical analysis for adjustment for the size of the portal fields. All portal fields within each sample were measured (9 to 35 portal fields per slide). Obvious artefacts such as unspecific staining of necrotic areas, as well as incompletely cut portal fields at the edges of the specimens, were excluded from analysis.
Measurement of hepatic hydroxyproline content
Quantification of liver fibrosis was done by measurement of hepatic hydroxyproline concentration by a calorimetric method. In brief, mouse liver lobe 3 (left liver lobe) was homogenized in 6 N HCl and hydrolysed overnight at 110°C. Afterwards hydrolysates were filtered, neutralized with NaOH and oxidized with chloramine-T. This was followed by a reaction with perchloric acid and p-dimethylbaminobenzaldehyde resulting in the formation of a chromophore quantified photometrically at 565 nm wavelength.
Determination of hepatic mRNA levels using Q-PCR
RNA was extracted and reversely transcribed into cDNA. PCR reaction (20μl) contained 12.5ng cDNA, 330nM of each primer and 10.5μl of SYBR Green Master mix (Applied Biosystems). Expression levels were normalized to 18sRNA. Primers used are summarized in Suppl. Table 2. In addition, thirty cycles of PCR were performed and 10μl loaded on a 3% agarose gel to determine the size and specificity of the PCR product. This step describes the validation of primer specificity used for Q-PCR.
Western Blotting
Antibodies against VCAM, K19, β-actin, and α-SMA as well as conditions for Western blotting are summarized in Suppl. Table 3. In short, liver homogenates (30 μg of protein) were run on 10% sodium dodecyl sulphate polyacrylamide gels, transferred to nitrocellulose, and blotted with the respective monoclonal antibodies given in Suppl. Table 3. Binding was detected by using peroxidase-conjugated rabbit immunglobulins against mouse and rat immunglobulins (Dako), and peroxidase activity was visualized by using the enhanced chemiluminescence method (ECL) Western blotting detection system.
Statistical analysis
Data are reported as arithmetic means ± SD of 5 animals in each group. Statistical analysis included Student’s t-test when appropriate or analysis of variance with Bonferroni posttesting when three or more groups were compared, using the Sigmastat statistics (Jandel Scientific, San Rafael, CA). A P value <0.05 was considered significant. Morphometric data for K19 represented a hierarchical structure, were portal fields (level 1 observation units) were nested within mice (level 2 observation units). Therefore, a special kind of statistical method, namely multilevel models and corresponding software (MlwinN 1.1) were employed. A linear regression models with bootstrap-corrected estimates was fitted to calculate means and confidence intervals for K19-positive areas in each of the study groups and to test the significance of the effects of genotype and diet on the amount of bile ducts. Portal vein areas were included in the model as a baseline parameter to account for the size of the portal fields. To fulfil the normality assumption, bile duct and portal vein areas were logarithmically transformed.
Results
Genetic loss of OPN and TNFR1 has no major impact on the hepatic inflammatory response in DDC-fed mice
DDC feeding in WT mice led to a pronounced hepatic inflammatory response characterized by a mixed inflammatory infiltrate accentuated in portal fields, especially near bile ducts, with predominating neutrophil granulocytes (shown in Supplementary Figures 1 and 2). This was accompanied by the induction of a reactive phenotype of bile duct epithelial cells (BECs) characterized by overexpression of proinflammatory cyto- and chemokines (e.g. TNF-α, VCAM, OPN) 6. In addition, we previously observed substantial induction of cholangiocellular and hepatocellular OPN expression along the margins of the liver acinus representing the lobular region with the highest inflammatory activity 6. Based on these findings we hypothesized that this inflammatory response is blunted in OPN−/− and TNFR1−/− mice. Immunohistochemistry for the Kupffer cell marker F4/80 revealed similar intensity in response to DDC-feeding in all genotypes tested (Figure 1B–D). The lobular distribution and staining pattern was also comparable. In addition, CD11b immunohistochemistry (staining cells of the monocytic lineage including neutrophil granulocytes but also dendritic cells and NK cells) revealed a comparable staining pattern in response to DDC-feeding irrespective of presence or absence of OPN and TNFR1 (Figure 1F–H). In contrast to the observed even panlobular F4/80 staining pattern, positivity for CD11b was concentrated to portal fields and the margins of the adjacent hepatocytes. We also observed no genotype-specific changes in respect to the composition of the portal infiltrate since neutrophil granulocytes were next to macrophages the predominant cell type also in the studied knock-out strains as observed on H&E-stained liver sections (shown for TNFR1−/− mice in Suppl. Figure 3). This assumption is also in line with the dissimilar lobular staining pattern in regard to F4/80 and CD11b positivity in DDC-fed mice (Figure 1). Taken together these findings indicated a comparable inflammatory response in all DDC-fed genotypes.
Figure 1. Genetic loss of osteopontin (OPN) and tumor necrosis factor-α receptor-1 (TNFR1) has no impact on the composition and density of the inflammatory infiltrate in response to DDC feeding.

Immunohistochemistry for F4/80 (A–D) and CD11b (E–H) in chow-fed wild type (WT/chow), WT 4 weeks DDC-fed (WT/DDC), OPN knock-out 4 weeks DDC-fed (OPN/DDC), and TNFR1 knock-out 4 weeks DDC-fed (TNFR/DDC) mice. (B–D) Please note that despite OPN or TNFR1 loss 4 weeks DDC-fed knock-out mice show a pronounced hepatic inflammation with no differences in regard to density and lobular distribution of the immunoreactivity. (E–H) In contrast to the observed F4/80 staining pattern the CD11b signal is concentrated and accentuated to portal fields and bile ducts again demonstrating no reduction of the inflammatory response in 4 weeks DDC-fed knock-out mice indicating a comparable inflammatory response compared to WT controls. pv, portal vein; bd, bile duct. Original magnification x20.
For further quantification of the inflammatory response induction of F4/80, iNOS, IL1-β, and IFNγ mRNA expression was compared and revealed no significant differences between groups (Table 1). MCP-1 and TNF-α mRNA levels were significantly increased in all genotypes in response to DDC feeding (Table 1). Interestingly MCP-1 expression was lower (without reaching statistical significance due to high standard deviation in DDC-fed mice) and TNF-α expression was significantly reduced in TNFR1−/− mice when compared to respective WT controls (Table 1), suggesting an at least in part reduced inflammatory response in this genotype. Induction of inflammatory genes was comparable between OPN−/− mice and respective WT controls in response to DDC apart from the expected undetectable OPN mRNA levels in OPN−/− mice (Table 1). We next compared hepatic VCAM expression as a parameter for the hepatic inflammatory response in our model system since induction of VCAM expression in response to DDC feeding is robust and parallels the development of the inflammatory infiltrate 6. In contrast to chow-fed controls, VCAM expression was significantly induced in reactive BECs, endothelial cells and Kupffer cells in DDC-fed mice and we again observed no differences in the staining pattern between genotypes (Figure 2B–D). Western blotting to quantify VCAM protein levels (Figure 2E) confirmed these findings showing no significant differences between DDC-fed OPN−/−, TNFR1−/− mice, and their respective WT controls. Thus, despite some differences in the induction of proinflammatory genes (i.e. TNF-α and MCP-1 mRNA expression levels in DDC-fed TNFR1−/− mice) these findings suggest that a single genetic loss of OPN or TNFR1 signalling has no major impact on the inflammatory response in DDC-fed mice.
Table 1.
ALT and AP serum levels under various experimental conditions
| Experimental Group | ALT (U/L) | AP (U/L) | Bilirubin (mg per 100 ml) |
|---|---|---|---|
| WT/chow | 31±7 | 85±14 | 0.11±0.06 |
| WT/DDC | 1271±521* | 2559±834* | 22.59±4.04* |
| OPN/chow | 23±3 | 113±7 | 0.13±0.12 |
| OPN/DDC | 1093±312* | 2456±474* | 16.26±2.77* |
| TNFR/DDC | 1046±200* | 2130±177* | 14.25±1.20*# |
n=5 animals in each group;
indicates p<0.05 chow-fed wild type (WT) animals versus DDC-fed WT, osteopontin knock-out mice (OPN), and tumor necrosis factor alpha receptor 1 knock out mice (TNFR);
Indicates P<0.05 DDC-fed wild-type (WT) animals vs DDC-fed TNFR1 knock out mice.
Figure 2. Genetic loss of osteopontin (OPN) and tumor necrosis factor-α receptor-1 (TNFR1) has no impact on hepatic F4/80 and iNOS mRNA expression.

PCR for quantification of hepatic F4/80 and iNOS mRNA levels in chow-fed wild type (WT/chow), WT DDC-fed (WT/DDC), OPN knock-out DDC-fed (OPN/DDC), and TNFR1 knock-out DDC-fed (TNFR/DDC) mice using SYBR Green. Please note that despite OPN and TNFR1 loss, DDC-fed mice show comparable expression levels. n = 5 in each group; *P<0.05 chow-fed vs DDC-fed mice.
Genetic loss of OPN and TNFR1 has no impact on the degree of ductular reaction and biliary fibrosis in DDC-fed mice
Previous studies revealed substantial overexpression of OPN and TNF-α in BECs of reactive ductules in the DDC model 6, leading us to hypothesize that these molecules may be critically engaged in the ductular reaction typically associated with liver fibrosis of the biliary type. More specifically, induction of OPN in DDC-fed mice was preferentially observed in hepatocytes along the margins of the liver acinus where porto-portal septa are formed later on 6, suggesting a possible direct role for OPN in the development of biliary fibrosis. We therefore compared the degree of ductular reaction immunohistochemically and quantified ductular mass by morphometric analysis and Western blotting using the cholangiocyte-specific marker K19. Immunohistochemistry for K19 revealed a comparable amount of ductular reaction in all genotypes tested (Figure 3B–D). The estimated bile duct area as revealed by morphometric analysis showed significant increased bile duct area in all DDC-fed genotypes compared to chow-fed controls (chow-fed WT 1.9±0.3; DDC-fed WT 4.8±0.3; DDC-fed OPN−/− 4.3±0.4; DDC-fed TNFR1−/− 5.0±0.3; differences between chow-fed and DDC-fed groups statistically significant). However, the increase in bile duct area in the different genotypes in response to DDC was similar. These data were further confirmed by similar hepatic K19 protein levels (Figure 3E). The finding of comparable hepatic ductular mass in all genotypes stressed with DDC-supplemented diet indicates that single genetic loss of OPN or TNFR1 has no major direct impact on ductular reaction in this model. This assumption was further supported by a comparable proliferative response in all DDC-treated genotypes as revealed by immunohistochemistry using the proliferation marker Ki-67 (data not shown).
Figure 3. Genetic loss of osteopontin (OPN) and tumor necrosis factor-α receptor-1 (TNFR1) has no impact on hepatic expression of vascular cell adhesion molecule (VCAM) in response to DDC feeding.

Immunohistochemistry for VCAM (A–D) and VCAM protein measurement by Western blotting (E) in chow-fed wild type (WT/chow), WT 4 weeks DDC-fed (WT/DDC), OPN knock-out 4 weeks DDC-fed (OPN/DDC), and TNFR1 knock-out 4 weeks DDC-fed (TNFR/DDC) mice. (B–D) Please note that despite OPN and TNFR1 loss, DDC-fed mice show a comparable hepatic VCAM induction most pronounced in reactive bile ductules (indicated by asterisks), endothelial cells, and Kupffer cells. (E) Hepatic VCAM protein quantification by Western blotting in 4 weeks DDC-fed mice revealed significant induction in all genotypes. * indicates P<0.05 chow-fed mice vs. DDC-fed mice. pv, portal vein. Original magnification x20.
Biliary fibrosis in DDC-fed mice is accompanied by proliferation and activation of periductal myofibroblasts of medium-sized and large bile ducts, which typically goes hand in hand with induced α-SMA expression 6. Comparing immunohistochemistry for α-SMA revealed no differences between DDC-fed genotypes (Figure 4B–D). Hepatic α-SMA protein levels were equal between DDC-fed WT and TNFR1−/− mice (Figure 4B–D). Induction of α-SMA protein expression however was even more pronounced in DDC-fed OPN−/− mice compared to DDC-fed TNFR1−/− mice (Figure 4E). These findings suggest that OPN and TNFR1 signalling may not have a pivotal role for the induction of the proliferative response and activation of periductal myofibroblasts in the DDC model. In addition, Sirius red stain and hepatic hydroxyproline levels also failed to reveal any significant differences between DDC-fed genotypes (Figure 5). Taken together the finding of a comparable fibrotic response in all DDC-fed genotypes make a direct or unique role of OPN or TNFR1 for the pathogenesis of biliary fibrosis in this model rather unlikely. Assessment of liver injury on H&E-stained liver sections and by serum ALT also revealed no significant differences between DDC-fed knockout mice and respective WT controls (Tabel 2). In addition, we found no significant differences in regard to serum AP levels indicating a comparable degree of cholestasis (Table 2). Interestingly TNFR1−/− mice showed significantly lower serum bilirubin levels in response to DDC suggesting a decreased susceptibility of this genotype to cholestasis in this model (Table 2). It is tempting to hypothesize that this finding could be linked to differences in canalicular Mrp2 expression (known to be cytokine sensitive 27 which deserves further investigations. Together these findings suggest that genetic loss of OPN or TNFR1 has no major impact on the toxic response and defense as well as the degree of cholestasis in DDC-fed mice.
Figure 4. Genetic loss of osteopontin (OPN) and tumor necrosis factor-α receptor (TNFR1) has no impact on the degree of ductular reaction in response to DDC-feeding.

Immunohistochemistry of keratin 19 (K19) (A–D) and K19 protein measurement by Western blotting (E) in chow-fed wild type (WT/chow), WT 4 weeks DDC-fed (WT/DDC), OPN knock-out 4 weeks DDC-fed (OPN/DDC), and TNFR1 knock-out 4 weeks DDC-fed (TNFR/DDC) mice. (B–D) Please note that OPN and TNFR1 loss do not reduce ductular reaction in 4 weeks DDC-fed mice. (E) Hepatic K19 protein quantification by Western blotting in 4 weeks DDC-fed mice revealed significant and comparable induction in all genotypes. * indicates P<0.05 chow-fed mice vs. DDC-fed mice. (pv, portal vein. Original magnification x20.
Figure 5. Effect of osteopontin (OPN) and tumor necrosis factor-α receptor (TNFR1) deficiency on the degree of α-SMA expression in DDC-fed mice.

Immunohistochemistry for α-SMA (A-D) and α-SMA protein measurement by Western blotting (E) in chow-fed wild type (WT/chow), WT 4 weeks DDC-fed (WT/DDC), OPN knock-out 4 weeks DDC-fed (OPN/DDC), and TNFR1 knock-out 4 weeks DDC-fed (TNFR/DDC) mice. (B–D) Please note that OPN and TNFR1 loss do not reduce hepatic α-SMA expression in 4 weeks DDC-fed mice. (E) Hepatic α-SMA protein quantification by Western blotting in 4 weeks DDC-fed mice revealed significant induction in all genotypes which was more pronounced in DDC-fed OPN knock-out mice. * indicates P<0.05 chow-fed mice vs. DDC-fed mice. # indicates P<0.05 DDC-fed OPN knock-out mice vs. DDC-fed WT and DDC-fed TNFR1 knockout mice. Ha, hepatic artery; pv, portal vein. Original magnification x20.
Discussion
Proinflammatory cytokines and their receptors may be critically engaged in the pathobiology of several cholangiopathies 28,29,30 and these molecules may represent attractive therapeutic targets 3,31. We therefore aimed to model the specific effects of genetic OPN and TNFR1 loss in DDC-fed mice with sclerosing cholangitis and biliary type of liver fibrosis, since this cholangiopathy model was previously shown to share several pathogenetic and morphological hallmarks of sclerosing cholangitis in humans and is associated with pronounced induction and activation of these inflammatory pathways 6. Taken together, our data largely dismiss a direct and pivotal role for OPN and TNFR1 signalling for the initiation and perpetuation of biliary fibrosis in a mouse model of xenobiotic-induced liver injury.
Proinflammatory cytokines and chemokines and their corresponding receptors play a critical role in the initiation and perpetuation of various types of liver fibrosis 32. As such, the potential role of OPN in the pathogenesis of liver fibrosis gained substantial interest and is currently under debate 11,12,33–37. We have previously demonstrated pronounced induction of hepatic OPN expression in DDC-fed mice and immunohistochemical studies have revealed that OPN is primarily expressed in BECs (including BECs in reactive ductules) and hepatocytes in acinar zone 1 6. In addition, OPN staining was most pronounced in periportal lobular regions where adjacent porto-portal septa develop in DDC-fed mice 6. OPN expression levels were shown to also reflect the disease activity of sclerosing cholangitis in Abcb4 (Mdr2) knockout mice 38. These findings led us to hypothesize that the observed DDC-induced OPN expression may represent a main trigger for the pronounced ductular reaction and following biliary fibrosis in DDC-fed mice. In addition these findings could indicate a potential role of OPN-induced EMT in this model. The role of OPN in EMT has raised considerable interest, especially in regard to its impact on kidney fibrosis 13,14. In addition, the concept of EMT has recently also gained great attention in the pathogenesis of liver fibrosis 15–21. Together these findings led us to hypothesize that OPN may be critically involved in ductular proliferation and fibrosis of the biliary type. The findings of the current study clearly demonstrate, however, that genetic loss of OPN has no major impact on the degree of ductular reaction and liver fibrosis in DDC-fed mice and in consequence, we also dismiss a central pathogenetic role for OPN-induced EMT as a major cause for biliary fibrosis in the applied model system.
However several important and critical aspects, including limitations of the used mouse models, have to been taken into account. As such, gene knock-out technology in mice frequently involves the risk of adaptive and compensatory processes. Probably even more important in the case of OPN, cytokines habitually act within redundant networks and pathways. Our experimental findings obtained in the DDC-fed mouse model therefore do not allow the direct conclusion that OPN has no role in biliary fibrosis induced under different experimental conditions. An additional question is the unknown trigger for the induction of cholangiocelluar OPN expression in DDC-fed mice. Candidates include potentially toxic bile acids (e.g. cholic acid) or a biliary excreted DDC metabolite. However, experiments using isolated BECs failed to show induced OPN expression in response to bile acid treatment (unpublished observation). Alternatively increased biliary pressure, which is a well defined trigger for ductular proliferation 39–42, may be causative since sheare stress was shown to induce OPN expression in various cell types including osteoblasts 43, periodontal cells 44, aortic smooth muscle cells 45, and podocytes 46. Taken together the findings of these interesting studies identified OPN as a stretch-adapting molecule in various cell types, which may also be the case for BECs under cholestatic conditions especially with an obstructive component.
TNF-α and its receptors are key molecules in the hepatic inflammatory response, execution of apoptosis, and regulation of liver regeneration. TNF-α may be critically involved especially in ASH/NASH pathobiology and several current therapeutic strategies (e.g. statin treatment, neutralizing antibodies) are aiming at modulation of this critical signalling pathway. In addition, members of the TNF superfamily may represent major players in the immunobiology of sclerosing cholangitis and associated biliary fibrosis 30,47 as such infiltrating lymphocytes could attack and destroy BECs via TNFR signalling. Moreover, increased levels of TNF-α may contribute to the oxidative damage to the biliary system. We have previously demonstrated profound induction of TNF-α mRNA, predominantly in portal fields with ductular reaction and in Kupffer cells using in situ hybridization 6. TNF-α was previously shown to induce hepatic VCAM expression in a murine endotoxic shock model 48. In addition, hepatic VCAM expression was also significantly induced in DDC-fed mice 6. We therefore hypothesized that TNF-α and its receptor pathways could be critically involved in the hepatic inflammatory response to DDC (e.g. induction of VCAM expression) and consequently the pathobiology of cholangitis and biliary fibrosis in this model. The findings of the current study, however, speak against a pivotal role for these molecules. Interestingly, our findings are also in line with the lack of a clinical benefit of anti-TNF strategies such as etanercept and pentoxyfilline in the treatment of cholangiopathies, e.g. PSC 49,50. Again our data need to be interpreted with caution, since our findings cannot dismiss a role for TNFR2-mediated pathways or alternative activation in DDC-fed TNFR1−/− mice. In addition, signalling via alternative TNF receptors was sufficient to induced cholangitis in chronic Cyryptosporidium parvum-infected mice in single TNFR knock-out mice 51. Alternative strategies to overcome inherent problems of these systems could lay in the generation of conditional knock-out mice.
Nevertheless based on the findings of the current study we conclude that previously observed OPN and TNF-α overexpression in DDC-fed mice may be more a consequence rather than the cause of the development of sclerosing cholangitis, ductular reaction and biliary fibrosis in DDC-fed mice. In addition, data presented put into question the concept that OPN and TNFR1 are critical to initiate or perpetuate liver fibrosis of the biliary type.
Supplementary Material
H&E stained liver section of 4 weeks DDC-fed WT mouse showing a pronounced inflammatory infiltrate around medium-sized bile duct. Arrows indicate neutrophil granulocytes. Original magnification x 60.
(A–D) H&E stained liver sections of 4 weeks DDC-fed WT mice. (A,B) Small bile ducts containing brown pigment plugs with pronounced pericholangitis. High numbers of neutrophils invading the portal field. (C,D) Ductular reaction of small bile ducts with pronounced pericholangitis. Bd, bile duct. Original magnification x 60.
(A–C) H&E stained liver sections of 4 weeks DDC-fed TNFR1−/− mice. (A) Small bile duct with pronounced pericholangitis. High numbers of neutrophils invading the portal field. (B,C) Ductular reaction of small bile ducts with pronounced pericholangitis. Bd, bile duct. Original magnification x 60.
Figure 6. Genetic loss of osteopontin (OPN) and tumor necrosis factor-α receptor-1 (TNFR1) does not decrease the degree of biliary fibrosis in DDC-fed mice.
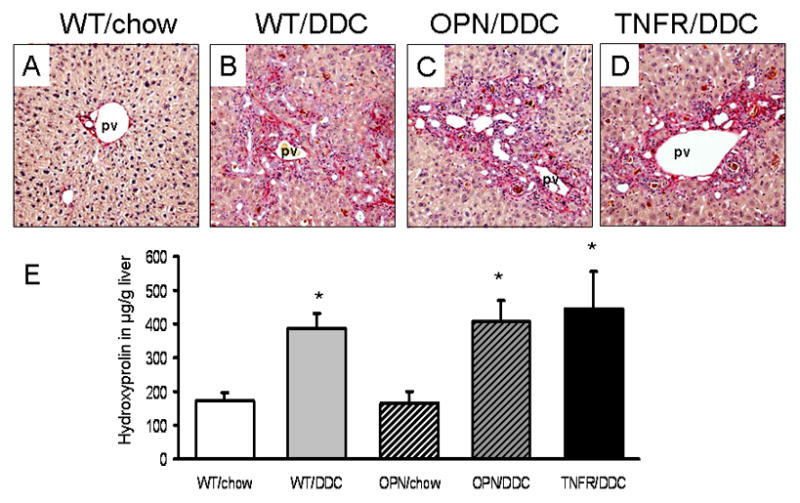
Sirius-red staining (A–D) and hepatic hydroxyproline measurement (E) in chow-fed wild type (WT/chow), WT 4 weeks DDC-fed (WT/DDC), OPN knock-out 4 weeks DDC-fed (OPN/DDC), and TNFR1 knock-out 4 weeks DDC-fed (TNFR/DDC) mice. (B–D) Sirius-red staining showed comparable staining pattern in all DDC-fed genotypes. (E) Biochemical quantification of liver fibrosis by hepatic hydroxyproline measurement demonstrating that genetic loss of OPN or TNFR1 does not reduce the degree of biliary fibrosis in DDC-fed mice. pv, portal vein. * indicates P<0.05 chow-fed mice vs. DDC-fed mice. Original magnification x20.
Acknowledgments
Supported by grants P-18613 and 19118 to M.T. from the Austrian Science Foundation and a GEN-AU project grant from the Austrian Ministry for Science to M.T., and the National Institutes of Health grant R01 AA12916 to H.J.
We gratefully acknowledge Dr. W. Erwa (Graz) and colleagues for performing the biochemical analysis of serum liver parameters.
Abbreviations
- ALT
alanine aminotransferase
- ASH
alcoholic steatohepatitis
- AP
alkaline phosphatase
- BECs
bile duct epithelial cells
- Bsep
bile salt export pump
- DDC
3,5-diethoxycarbonyl-1,4-dihydrocollidine
- OPN
osteopontin
- EMT
epithelial mesenchymal transition
- IL
interleukins
- IFN-γ
interferon gamma
- PBC
primary biliary cirrhosis
- PSC
primary sclerosing cholangitis
- SSC
secondary sclerosing cholangitis
- TGF-β
transforming growth factor beta
- TNFR1
tumor necrosis factor alpha receptor 1
- TNF-α
tumor necrosis factor alpha
References
- 1.Lazaridis KN, Strazzabosco M, LaRusso NF. The cholangiopathies: disorders of biliary epithelia. Gastroenterology. 2004;127(5):1565–1577. doi: 10.1053/j.gastro.2004.08.006. [DOI] [PubMed] [Google Scholar]
- 2.Lu BR, Mack CL. Inflammation and biliary tract injury. Curr Opin Gastroenterol. 2009;25(3):260–4. doi: 10.1097/mog.0b013e328325aa10. [DOI] [PubMed] [Google Scholar]
- 3.Strazzabosco M, Fabris L, Spirli C. Pathophysiology of cholangiopathies. J Clin Gastroenterol. 2005;39(4 Suppl 2):S90–S102. doi: 10.1097/01.mcg.0000155549.29643.ad. [DOI] [PubMed] [Google Scholar]
- 4.Xia X, Demorrow S, Francis H, et al. Cholangiocyte injury and ductopenic syndromes. Semin Liver Dis. 2007;27(4):401–12. doi: 10.1055/s-2007-991516. [DOI] [PubMed] [Google Scholar]
- 5.Zatloukal K, Stumptner C, Fuchsbichler A, et al. The keratin cytoskeleton in liver diseases. J Pathol. 2004;204(4):367–76. doi: 10.1002/path.1649. [DOI] [PubMed] [Google Scholar]
- 6.Fickert P, Stoger U, Fuchsbichler A, et al. A new xenobiotic-induced mouse model of sclerosing cholangitis and biliary fibrosis. Am J Pathol. 2007;171(2):525–36. doi: 10.2353/ajpath.2007.061133. [DOI] [PMC free article] [PubMed] [Google Scholar]
- 7.Friedman SL. Mechanisms of hepatic fibrogenesis. Gastroenterology. 2008;134(6):1655–69. doi: 10.1053/j.gastro.2008.03.003. [DOI] [PMC free article] [PubMed] [Google Scholar]
- 8.Notas G, Kisseleva T, Brenner D. NK and NKT cells in liver injury and fibrosis. Clin Immunol. 2009;130(1):16–26. doi: 10.1016/j.clim.2008.08.008. [DOI] [PubMed] [Google Scholar]
- 9.Parola M, Marra F, Pinzani M. Myofibroblast - like cells and liver fibrogenesis: Emerging concepts in a rapidly moving scenario. Mol Aspects Med. 2008;29(1–2):58–66. doi: 10.1016/j.mam.2007.09.002. [DOI] [PubMed] [Google Scholar]
- 10.Ramadori G, Saile B. Portal tract fibrogenesis in the liver. Lab Invest. 2004;84(2):153–9. doi: 10.1038/labinvest.3700030. [DOI] [PubMed] [Google Scholar]
- 11.Whitington PF, Malladi P, Melin-Aldana H, Azzam R, Mack CL, Sahai A. Expression of osteopontin correlates with portal biliary proliferation and fibrosis in biliary atresia. Pediatr Res. 2005;57(6):837–44. doi: 10.1203/01.PDR.0000161414.99181.61. [DOI] [PubMed] [Google Scholar]
- 12.Apte UM, Banerjee A, McRee R, Wellberg E, Ramaiah SK. Role of osteopontin in hepatic neutrophil infiltration during alcoholic steatohepatitis. Toxicol Appl Pharmacol. 2005;207(1):25–38. doi: 10.1016/j.taap.2004.12.018. [DOI] [PubMed] [Google Scholar]
- 13.Zeisberg M, Kalluri R. The role of epithelial-to-mesenchymal transition in renal fibrosis. J Mol Med. 2004;82(3):175–81. doi: 10.1007/s00109-003-0517-9. [DOI] [PubMed] [Google Scholar]
- 14.Zeisberg M, Neilson EG. Biomarkers for epithelial-mesenchymal transitions. J Clin Invest. 2009;119(6):1429–37. doi: 10.1172/JCI36183. [DOI] [PMC free article] [PubMed] [Google Scholar]
- 15.Demetris AJ, Specht S, Nozaki I, et al. Small proline-rich proteins (SPRR) function as SH3 domain ligands, increase resistance to injury and are associated with epithelial-mesenchymal transition (EMT) in cholangiocytes. J Hepatol. 2008;48(2):276–88. doi: 10.1016/j.jhep.2007.09.019. [DOI] [PMC free article] [PubMed] [Google Scholar]
- 16.Omenetti A, Porrello A, Jung Y, et al. Hedgehog signaling regulates epithelial-mesenchymal transition during biliary fibrosis in rodents and humans. J Clin Invest. 2008;118(10):3331–42. doi: 10.1172/JCI35875. [DOI] [PMC free article] [PubMed] [Google Scholar]
- 17.Robertson H, Kirby JA, Yip WW, Jones DE, Burt AD. Biliary epithelial-mesenchymal transition in posttransplantation recurrence of primary biliary cirrhosis. Hepatology. 2007;45(4):977–81. doi: 10.1002/hep.21624. [DOI] [PubMed] [Google Scholar]
- 18.Rygiel KA, Robertson H, Marshall HL, et al. Epithelial-mesenchymal transition contributes to portal tract fibrogenesis during human chronic liver disease. Lab Invest. 2008;88(2):112–23. doi: 10.1038/labinvest.3700704. [DOI] [PubMed] [Google Scholar]
- 19.Syn WK, Jung Y, Omenetti A, et al. Hedgehog-Mediated Epithelial-to-Mesenchymal Transition and Fibrogenic Repair in Nonalcoholic Fatty Liver Disease. Gastroenterology. 2009 doi: 10.1053/j.gastro.2009.06.051. [DOI] [PMC free article] [PubMed] [Google Scholar]
- 20.Yue HY, Yin C, Hou JL, et al. Hepatocyte nuclear factor 4{alpha} attenuates hepatic fibrosis in rats. Gut. 2009 doi: 10.1136/gut.2008.174904. [DOI] [PubMed] [Google Scholar]
- 21.Zeisberg M, Yang C, Martino M, et al. Fibroblasts derive from hepatocytes in liver fibrosis via epithelial to mesenchymal transition. J Biol Chem. 2007;282(32):23337–47. doi: 10.1074/jbc.M700194200. [DOI] [PubMed] [Google Scholar]
- 22.Polyzos SA, Kountouras J, Zavos C. Nonalcoholic fatty liver disease: the pathogenetic roles of insulin resistance and adipocytokines. Curr Mol Med. 2009;9(3):299–314. doi: 10.2174/156652409787847191. [DOI] [PubMed] [Google Scholar]
- 23.Rutherford A, Chung RT. Acute liver failure: mechanisms of hepatocyte injury and regeneration. Semin Liver Dis. 2008;28(2):167–74. doi: 10.1055/s-2008-1073116. [DOI] [PubMed] [Google Scholar]
- 24.Sheikh MY, Choi J, Qadri I, Friedman JE, Sanyal AJ. Hepatitis C virus infection: molecular pathways to metabolic syndrome. Hepatology. 2008;47(6):2127–33. doi: 10.1002/hep.22269. [DOI] [PubMed] [Google Scholar]
- 25.Bahcecioglu IH, Koca SS, Poyrazoglu OK, et al. Hepatoprotective effect of infliximab, an anti-TNF-alpha agent, on carbon tetrachloride-induced hepatic fibrosis. Inflammation. 2008;31(4):215–21. doi: 10.1007/s10753-008-9067-1. [DOI] [PubMed] [Google Scholar]
- 26.Koca SS, Bahcecioglu IH, Poyrazoglu OK, Ozercan IH, Sahin K, Ustundag B. The treatment with antibody of TNF-alpha reduces the inflammation, necrosis and fibrosis in the non-alcoholic steatohepatitis induced by methionine- and choline-deficient diet. Inflammation. 2008;31(2):91–8. doi: 10.1007/s10753-007-9053-z. [DOI] [PubMed] [Google Scholar]
- 27.Trauner M, Arrese M, Soroka CJ, et al. The rat canalicular conjugate export pump (Mrp2) is down-regulated in intrahepatic and obstructive cholestasis. Gastroenterology. 1997;113(1):255–264. doi: 10.1016/s0016-5085(97)70103-3. [DOI] [PubMed] [Google Scholar]
- 28.Aron JH, Bowlus CL. The immunobiology of primary sclerosing cholangitis. Semin Immunopathol. 2009 doi: 10.1007/s00281-009-0154-7. [DOI] [PMC free article] [PubMed] [Google Scholar]
- 29.O’Mahony CA, Vierling JM. Etiopathogenesis of primary sclerosing cholangitis. Semin Liver Dis. 2006;26(1):3–21. doi: 10.1055/s-2006-933559. [DOI] [PubMed] [Google Scholar]
- 30.Aoki CA, Bowlus CL, Gershwin ME. The immunobiology of primary sclerosing cholangitis. Autoimmun Rev. 2005;4(3):137–43. doi: 10.1016/j.autrev.2004.09.003. [DOI] [PubMed] [Google Scholar]
- 31.Alvaro D, Mancino MG. New insights on the molecular and cell biology of human cholangiopathies. Mol Aspects Med. 2008;29(1–2):50–7. doi: 10.1016/j.mam.2007.09.007. [DOI] [PubMed] [Google Scholar]
- 32.Bataller R, Brenner DA. Liver fibrosis. J Clin Invest. 2005;115(2):209–18. doi: 10.1172/JCI24282. [DOI] [PMC free article] [PubMed] [Google Scholar]
- 33.Lorena D, Darby IA, Gadeau AP, et al. Osteopontin expression in normal and fibrotic liver. altered liver healing in osteopontin-deficient mice. J Hepatol. 2006;44(2):383–90. doi: 10.1016/j.jhep.2005.07.024. [DOI] [PubMed] [Google Scholar]
- 34.Zhao L, Li T, Wang Y, et al. Elevated plasma osteopontin level is predictive of cirrhosis in patients with hepatitis B infection. Int J Clin Pract. 2008;62(7):1056–62. doi: 10.1111/j.1742-1241.2007.01368.x. [DOI] [PubMed] [Google Scholar]
- 35.Sahai A, Malladi P, Melin-Aldana H, Green RM, Whitington PF. Upregulation of osteopontin expression is involved in the development of nonalcoholic steatohepatitis in a dietary murine model. Am J Physiol Gastrointest Liver Physiol. 2004;287(1):G264–73. doi: 10.1152/ajpgi.00002.2004. [DOI] [PubMed] [Google Scholar]
- 36.Sahai A, Malladi P, Pan X, et al. Obese and diabetic db/db mice develop marked liver fibrosis in a model of nonalcoholic steatohepatitis: role of short-form leptin receptors and osteopontin. Am J Physiol Gastrointest Liver Physiol. 2004;287(5):G1035–43. doi: 10.1152/ajpgi.00199.2004. [DOI] [PubMed] [Google Scholar]
- 37.Harada K, Ozaki S, Sudo Y, Tsuneyama K, Ohta H, Nakanuma Y. Osteopontin is involved in the formation of epithelioid granuloma and bile duct injury in primary biliary cirrhosis. Pathol Int. 2003;53(1):8–17. doi: 10.1046/j.1440-1827.2003.01426.x. [DOI] [PubMed] [Google Scholar]
- 38.Nakken KE, Nygard S, Haaland TK, et al. Gene expression profiles reflect sclerosing cholangitis activity in abcb4 (−/−) mice. Scand J Gastroenterol. 2009;44(2):211–8. doi: 10.1080/00365520802400867. [DOI] [PubMed] [Google Scholar]
- 39.Fickert P, Zollner G, Fuchsbichler A, et al. Ursodeoxycholic acid aggravates bile infarcts in bile duct-ligated and Mdr2 knockout mice via disruption of cholangioles. Gastroenterology. 2002;123(4):1238–51. doi: 10.1053/gast.2002.35948. [DOI] [PubMed] [Google Scholar]
- 40.Slott PA, Liu MH, Tavoloni N. Origin, pattern, and mechanism of bile duct proliferation following biliary obstruction in the rat. Gastroenterology. 1990;99(2):466–77. doi: 10.1016/0016-5085(90)91030-a. [DOI] [PubMed] [Google Scholar]
- 41.Wagner M, Fickert P, Zollner G, et al. Role of farnesoid X receptor in determining hepatic ABC transporter expression and liver injury in bile duct-ligated mice. Gastroenterology. 2003;125(3):825–38. doi: 10.1016/s0016-5085(03)01068-0. [DOI] [PubMed] [Google Scholar]
- 42.Wiener SM, Hoyt RF, Jr, Deleonardis JR, et al. Manometric changes during retrograde biliary infusion in mice. Am J Physiol Gastrointest Liver Physiol. 2000;279(1):G49–66. doi: 10.1152/ajpgi.2000.279.1.G49. [DOI] [PubMed] [Google Scholar]
- 43.You J, Reilly GC, Zhen X, et al. Osteopontin gene regulation by oscillatory fluid flow via intracellular calcium mobilization and activation of mitogen-activated protein kinase in MC3T3-E1 osteoblasts. J Biol Chem. 2001;276(16):13365–71. doi: 10.1074/jbc.M009846200. [DOI] [PubMed] [Google Scholar]
- 44.Wongkhantee S, Yongchaitrakul T, Pavasant P. Mechanical stress induces osteopontin via ATP/P2Y1 in periodontal cells. J Dent Res. 2008;87(6):564–8. doi: 10.1177/154405910808700601. [DOI] [PubMed] [Google Scholar]
- 45.Iizuka K, Murakami T, Kawaguchi H. Pure atmospheric pressure promotes an expression of osteopontin in human aortic smooth muscle cells. Biochem Biophys Res Commun. 2001;283(2):493–8. doi: 10.1006/bbrc.2001.4796. [DOI] [PubMed] [Google Scholar]
- 46.Endlich N, Sunohara M, Nietfeld W, et al. Analysis of differential gene expression in stretched podocytes: osteopontin enhances adaptation of podocytes to mechanical stress. Faseb J. 2002;16(13):1850–2. doi: 10.1096/fj.02-0125fje. [DOI] [PubMed] [Google Scholar]
- 47.Adams DH, Afford SC. The role of cholangiocytes in the development of chronic inflammatory liver disease. Front Biosci. 2002;7:e276–85. doi: 10.2741/a923. [DOI] [PubMed] [Google Scholar]
- 48.Essani NA, Bajt ML, Farhood A, Vonderfecht SL, Jaeschke H. Transcriptional activation of vascular cell adhesion molecule-1 gene in vivo and its role in the pathophysiology of neutrophil-induced liver injury in murine endotoxin shock. J Immunol. 1997;158(12):5941–8. [PubMed] [Google Scholar]
- 49.Barrie A, Regueiro M. Biologic therapy in the management of extraintestinal manifestations of inflammatory bowel disease. Inflamm Bowel Dis. 2007;13(11):1424–9. doi: 10.1002/ibd.20196. [DOI] [PubMed] [Google Scholar]
- 50.Silveira MG, Lindor KD. Clinical features and management of primary sclerosing cholangitis. World J Gastroenterol. 2008;14(21):3338–49. doi: 10.3748/wjg.14.3338. [DOI] [PMC free article] [PubMed] [Google Scholar]
- 51.Ponnuraj EM, Hayward AR. Requirement for TNF-Tnfrsf1 signalling for sclerosing cholangitis in mice chronically infected by Cryptosporidium parvum. Clin Exp Immunol. 2002;128(3):416–20. doi: 10.1046/j.1365-2249.2002.01861.x. [DOI] [PMC free article] [PubMed] [Google Scholar]
Associated Data
This section collects any data citations, data availability statements, or supplementary materials included in this article.
Supplementary Materials
H&E stained liver section of 4 weeks DDC-fed WT mouse showing a pronounced inflammatory infiltrate around medium-sized bile duct. Arrows indicate neutrophil granulocytes. Original magnification x 60.
(A–D) H&E stained liver sections of 4 weeks DDC-fed WT mice. (A,B) Small bile ducts containing brown pigment plugs with pronounced pericholangitis. High numbers of neutrophils invading the portal field. (C,D) Ductular reaction of small bile ducts with pronounced pericholangitis. Bd, bile duct. Original magnification x 60.
(A–C) H&E stained liver sections of 4 weeks DDC-fed TNFR1−/− mice. (A) Small bile duct with pronounced pericholangitis. High numbers of neutrophils invading the portal field. (B,C) Ductular reaction of small bile ducts with pronounced pericholangitis. Bd, bile duct. Original magnification x 60.