

Abstract
Objective
To evaluate the effects of canagliflozin, a sodium glucose co-transporter 2 inhibitor, on body weight in overweight and obese subjects (body mass index [BMI] ≥27 and <50 kg/m2).
Methods
This 12-week, Phase 2b, randomized, double-blind study enrolled 376 subjects without diabetes mellitus who received canagliflozin 50, 100, or 300 mg or placebo once daily. The primary endpoint was the percent change in body weight from baseline through Week 12.
Results
Canagliflozin increased urinary glucose excretion in a dose-dependent manner and produced statistically significant reductions in body weight compared with placebo (least squares mean percent changes from baseline of −2.2%, −2.9%, −2.7%, and −1.3% with canagliflozin 50, 100, and 300 mg and placebo; P < 0.05 for all comparisons). Overall adverse event (AE) rates were similar across groups. Canagliflozin was associated with higher rates of genital mycotic infections in women, which were generally mild and led to few study discontinuations. Osmotic diuresis-related AE rates were low and similar across groups.
Conclusions
In overweight and obese subjects without diabetes mellitus, canagliflozin significantly reduced body weight compared with placebo and was generally well tolerated.
Introduction
Canagliflozin is a sodium glucose co-transporter 2 (SGLT2) inhibitor shown to improve glycemic control and lower body weight in patients with type 2 diabetes mellitus (T2DM) (1–4). Inhibition of SGLT2 leads to decreased renal glucose reabsorption and increased urinary glucose excretion (UGE) (5). Lowering of the renal threshold for glucose excretion (RTG) and increasing UGE with canagliflozin is dose-dependent, leading to a net caloric loss in animal models, as well as in patients with and without diabetes mellitus (1,6–9). In a Phase 1 study of obese subjects without diabetes mellitus, canagliflozin increased UGE and reduced body weight, with no meaningful changes in plasma glucose or insulin levels and no reported hypoglycemia (10). This 12-week Phase 2b study evaluated the effects of various doses of canagliflozin compared with placebo on body weight in overweight and obese subjects without diabetes mellitus.
Methods
Subjects and study design
[This Methods section is abbreviated. Full details of the “Subjects and study design” can be found in the Supporting Information.]
This randomized, double-blind, placebo-controlled, parallel-group, dose-ranging, Phase 2b study was conducted at multiple sites in the United States and Puerto Rico from March 31, 2008 to September 18, 2008 (ClinicalTrials.gov: NCT00650806). Eligible subjects included men and women aged 18-65 years with body mass index (BMI) between ≥30 and <50 kg/m2 at screening if generally healthy, with a lower entry threshold of BMI ≥27 kg/m2 in the presence of comorbidities such as controlled hypertension (diastolic blood pressure [BP] < 100 mmHg and systolic BP < 160 mmHg while being treated with antihypertensive drug[s]) (11) and/or treated or untreated dyslipidemia (low-density lipoprotein cholesterol [LDL-C] ≥ 130 mg/dL [3.36 mmol/L], high-density lipoprotein cholesterol [HDL-C] < 40 mg/dL [1.03 mmol/L] for men and <50 mg/dL [1.29 mmol/L] for women, or triglycerides ≥ 150 mg/dL [1.68 mmol/L]) (12,13). The study consisted of three phases: (1) a pretreatment phase (7-day screening period and 4-week run-in period), (2) a 12-week double-blind treatment phase, and (3) a 14-day post-treatment phase. The study protocol was approved by institutional review boards at participating institutions. Subjects underwent the informed consent process, as evidenced by their written informed consent prior to participation. The study was conducted under the guidelines of Good Clinical Practices and the Declaration of Helsinki.
Study endpoints and assessments
The primary efficacy endpoint was percent change in body weight compared to placebo from baseline through Week 12. Secondary endpoints included absolute change in body weight, percent change in body weight, and change in BMI from baseline to Weeks 3, 6, 9, 12, and 14 (or 14 days after the end of treatment/early withdrawal); proportion of subjects who lost ≥5% or ≥10% of baseline body weight at Week 12; and change from baseline in waist and hip circumference and waist/hip ratio at Week 12. Exploratory evaluations performed in all subjects included changes from baseline in: UGE/creatinine ratio and RTG (Weeks 3, 6, and 12, obtained from overnight urine collections; RTG was calculated as previously reported (7,9)); fasting plasma glucose (FPG), triglycerides, HDL-C, LDL-C, and LDL-C/HDL-C ratio (Weeks 6 and 12); hemoglobin A1c (Week 12); and systolic and diastolic BP (Weeks 3, 6, 9, and 12). Subjects completed the Impact of Weight on Quality of Life-Lite questionnaire (IWQOL-Lite) (13,15), a 31-item, self-report, obesity-specific measure used to quantitatively assess individuals' perceptions of how their weight affects their day-to-day life. Changes from baseline in the total score, comprised of five domains (physical function, self-esteem, sexual life, public distress, and work), were assessed at Week 12.
Body weight was measured using the same calibrated scale at each visit at approximately the same time of the day, wearing underwear and a gown, without shoes. Subjects were instructed to empty their bladders before being weighed.
Safety and tolerability assessments included medical history, physical examinations, vital sign measurements, clinical laboratory tests, 12-lead electrocardiograms, and urinalysis. The analyses of safety parameters were performed to investigate potential safety signals, and no statistical testing was conducted. Adverse events (AEs) were recorded throughout the study. Subjects were educated on the symptoms and treatment of hypoglycemia. Self-administered vaginal swabs for Candida culture and urine samples for bacterial or Candida culture were collected at baseline, Week 12, and at the time of symptoms consistent with vulvovaginal candidiasis or urinary tract infection (UTI).
Statistical analyses
[Details of statistical analyses can be found in the Supporting Information.]
Results
Subject disposition and baseline characteristics
A total of 376 subjects were randomized (intent-to-treat analysis set; Figure 1). Demographic and baseline characteristics were generally balanced across groups (Table 1). Baseline mean body weight was 101.3 kg and mean BMI was 37.0 kg/m2, with 93% of subjects classified as obese (BMI ≥ 30 kg/m2). Mean weight loss during the nutrition/physical activity run-in phase was 1.6 kg (62% of subjects had run-in weight loss ≤2 kg). At baseline, the majority of subjects (79%) had normal FPG (<101 mg/dL [5.6 mmol/L]) and 20% had impaired fasting glucose (FPG ≥ 101 mg/dL [5.6 mmol/L] and <126 mg/dL [7.0 mmol/L]). A total of 94 (25%) subjects discontinued prior to study completion, with higher rates with canagliflozin 100 and 300 mg compared with canagliflozin 50 mg and placebo (Figure 1).
Figure 1.
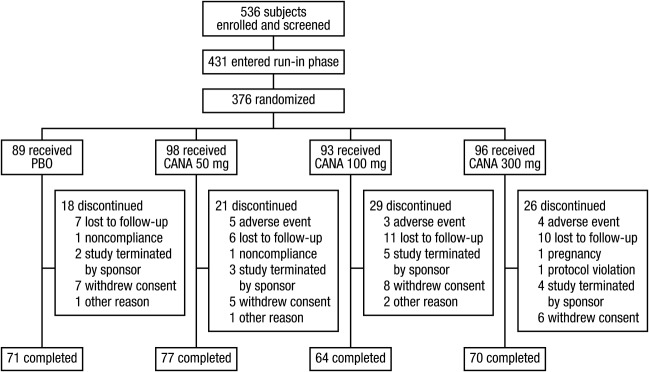
Study flow diagram. CANA, canagliflozin; PBO, placebo.
Table 1.
Baseline demographics and clinical characteristics
| Characteristic | PBO (n = 89) | CANA 50 mg qd (n = 98) | CANA 100 mg qd (n = 93) | CANA 300 mg qd (n = 96) | Total (N = 376) |
|---|---|---|---|---|---|
| Women, n (%) | 75 (84) | 86 (88) | 76 (82) | 86 (90) | 323 (86) |
| Age, y | 45.1 (11.9) | 44.9 (11.8) | 45.8 (11.0) | 43.5 (11.0) | 44.8 (11.4) |
| Race, n (%)a | |||||
| White | 69 (78) | 84 (86) | 79 (85) | 79 (82) | 311 (83) |
| Black or African-American | 18 (20) | 14 (14) | 10 (11) | 13 (14) | 55 (15) |
| Asian | 1 (1) | 0 | 1 (1) | 0 | 2 (1) |
| Other | 1 (1) | 0 | 3 (3) | 4 (4) | 8 (2) |
| Weight, kg | 102.2 (19.9) | 98.1 (16.0) | 105.0 (16.6) | 100.2 (18.0) | 101.3 (17.8) |
| BMI, kg/m2 | 36.6 (5.5) | 36.6 (5.3) | 37.9 (5.1) | 36.9 (5.3) | 37.0 (5.3) |
| Run-in weight loss, kg | 1.5 (2.0) | 1.7 (2.0) | 1.6 (2.5) | 1.5 (2.0) | 1.6 (2.1) |
| FPG status, n (%) | |||||
| Normalb | 77 (87) | 78 (80) | 68 (73) | 73 (76) | 296 (79) |
| Impairedc | 10 (11) | 19 (19) | 24 (26) | 23 (24) | 76 (20) |
| Single glucose value ≥126 mg/dL (7.0 mmol/L) at baseline | 2 (2) | 1 (1) | 1 (1) | 0 | 4 (1) |
Data are mean (SD) unless otherwise indicated.
BMI, body mass index; CANA, canagliflozin; FPG, fasting plasma glucose; PBO, placebo; SD, standard deviation.
Percentages may not total 100% due to rounding.
FPG < 101 mg/dL (5.6 mmol/L).
FPG ≥ 101 mg/dL (5.6 mmol/L) and <126 mg/dL (7.0 mmol/L).
Efficacy
Body weight
At Week 12 compared to baseline, subjects in the canagliflozin 50, 100, and 300 mg and placebo groups experienced percent body weight least squares (LS) mean changes of −2.2%, −2.9%, −2.7%, and −1.3%, respectively, with placebo-subtracted percent values of −0.9% (P = 0.031), −1.6% (P <0.001), and −1.4% (P <0.001), respectively, and greater absolute weight loss with differences in LS mean changes of −0.8 kg (P = 0.045), −1.6 kg (P <0.001), and −1.3 kg (P = 0.001), respectively (Figure 2 and Table 2). All canagliflozin groups achieved decreases in body weight at the earliest post-randomization visit, with the weight loss progressively continuing through Week 12, and with weight loss greater than placebo at all time points (Figure 2). Compared to placebo-treated subjects at Week 12, canagliflozin 50, 100, and 300 mg produced a greater proportion of subjects with ≥5% loss in body weight from baseline (8%, 13%, 19%, and 17%, respectively; P = 0.027 for canagliflozin 300 mg vs placebo). Few subjects achieved ≥10% loss in body weight from baseline (3%, 2%, 1%, and 0% with canagliflozin 50, 100, and 300 mg and placebo, respectively).
Figure 2.
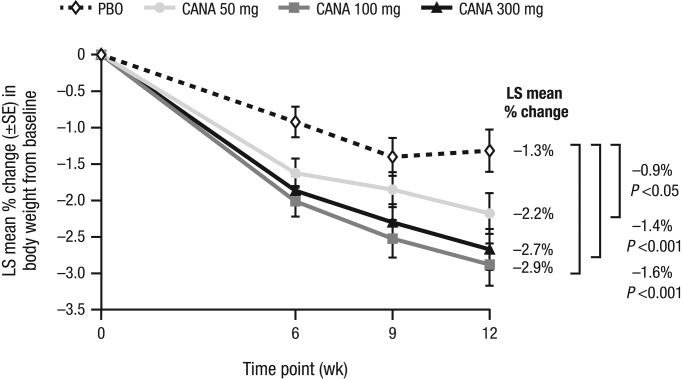
Percent change in body weight (LOCF). CANA, canagliflozin; LOCF, last observation carried forward; LS, least squares; PBO, placebo; SE, standard error.
Table 2.
Summary of changes in body weight, BMI, and anthropometric measurements (LOCF)
| Parameter | PBO (n = 89) | CANA 50 mg (n = 98) | CANA 100 mg (n = 93) | CANA 300 mg (n = 96) |
|---|---|---|---|---|
| Body weight, n | 86 | 95 | 85 | 96 |
| Mean (SD) change, kg | −1.1 (2.5) | −1.9 (2.9) | −2.8 (2.9) | −2.4 (2.9) |
| LS mean difference vs PBO (95% CI) | −0.8 (−1.6, −0.02)c | −1.6 (−2.4, −0.8)a | −1.3 (−2.1, −0.5)a | |
| BMI, n | 86 | 95 | 85 | 93 |
| Mean (SD) change, kg/m2 | −0.4 (0.9) | −0.7 (1.1) | −1.0 (1.0) | −0.9 (1.1) |
| LS mean difference vs PBO (95% CI) | −0.3 (−0.6, −0.03)b | −0.6 (−0.9, −0.3)a | −0.5 (−0.8, −0.2)a | |
| Waist circumference, n | 78 | 87 | 73 | 82 |
| Mean (SD) change, cm | −1.2 (10.1) | −1.4 (5.0) | −2.9 (10.3) | −2.6 (7.2) |
| LS mean difference vs PBO (95% CI) | −0.3 (−2.7, 2.2) | −0.9 (−3.5, 1.6) | −1.4 (−3.8, 1.1) | |
| Hip circumference, n | 77 | 86 | 72 | 81 |
| Mean (SD) change, cm | 0.1 (10.4) | −2.0 (4.0) | −2.1 (10.6) | −3.0 (7.9) |
| LS mean difference vs PBO (95% CI) | −1.6 (−3.8, 0.6) | −0.7 (−3.0, 1.6) | −1.8 (−4.0, 0.5) | |
| Waist/hip ratio, n | 77 | 86 | 72 | 81 |
| Mean (SD) change, cm/cm | −0.011 (0.05) | 0.003 (0.04) | −0.008 (0.09) | −0.004 (0.05) |
| LS mean difference vs PBO (95% CI) | 0.011 (−0.01, 0.03) | 0.001 (−0.02, 0.02) | 0.002 (−0.02, 0.02) |
BMI, body mass index; CANA, canagliflozin; CI, confidence interval; LOCF, last observation carried forward; LS, least squares; PBO, placebo; SD, standard deviation.
P ≤ 0.001 vs PBO.
P = 0.031 vs PBO.
P = 0.045 vs PBO.
BMI and anthropometric measurements
At Week 12 compared to baseline, canagliflozin 50, 100, and 300 mg produced significantly greater reductions in BMI than placebo (Table 2), with LS mean changes relative to placebo of −0.3 kg/m2 (P = 0.031), −0.6 kg/m2 (P <0.001), and −0.5 kg/m2 (P <0.001), respectively. At Week 12 compared to baseline, canagliflozin 50, 100, and 300 mg numerically reduced waist circumference and hip circumference compared with placebo (Table 2). None of the observed changes in waist or hip circumference with canagliflozin were statistically different compared to placebo. Observed mean changes and LS mean differences in waist/hip ratio for all canagliflozin doses were not statistically different compared to placebo.
Urinary glucose excretion
Canagliflozin increased UGE/creatinine ratio in a dose-dependent manner (Figure 3), beginning at Week 3 (earliest post-randomization assessment time point) and continuing through Week 12. At Week 12 compared to baseline, canagliflozin 50, 100, and 300 mg produced mean changes in UGE/creatinine ratio of 11.9, 18.7, and 30.9 mg/mg, respectively, versus 0.0 mg/mg with placebo. At Week 12 compared to baseline, canagliflozin 50, 100, and 300 mg produced mean overnight RTG values of 82.8, 79.7, and 67.8 mg/dL, respectively – an effect beginning at the first post-randomization visit (Week 3) and maintained throughout the treatment period.
Figure 3.
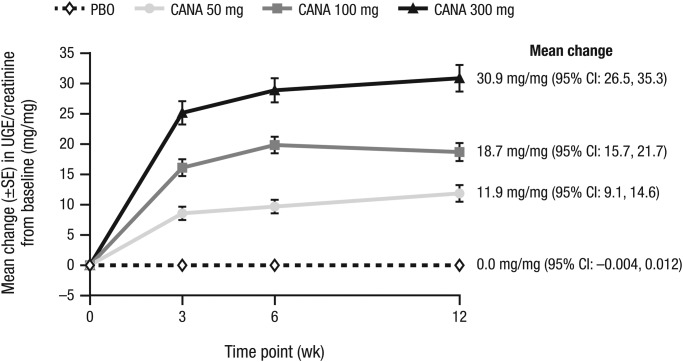
Change in UGE/creatinine ratio. CANA, canagliflozin; CI, confidence interval; PBO, placebo; SE, standard error; UGE, urinary glucose excretion.
Lipid and glycemic parameters
At Week 12 compared to placebo, canagliflozin produced no clinically meaningful changes from baseline in triglycerides and HDL-C levels. From baseline to Week 12, canagliflozin 50, 100, and 300 mg and placebo were associated with mean percent changes in LDL-C of 4.2%, 7.5%, 10.0%, and 6.4%, respectively. Canagliflozin 300 mg was associated with an increase in LDL-C/HDL-C ratio (7.0%) versus placebo (2.8%). In the total study population at Week 12 compared to baseline, canagliflozin did not produce meaningful differences in glycemic parameters, such as FPG and hemoglobin A1c, relative to placebo. At baseline in the canagliflozin 50, 100, and 300 mg and placebo groups, respectively, 20, 22, 21, and 12 subjects had elevated FPG (≥101 mg/dL [5.6 mmol/L]), compared with 21, 20, 14, and 16 subjects at Week 12.
Blood pressure
At Week 12 compared to baseline, canagliflozin 50, 100, and 300 mg and placebo produced reductions in systolic BP (mean changes of −2.1, −3.3, −2.0, and −1.4 mmHg, respectively), with mean changes in diastolic BP of −1.4, −0.7,−0.5, and −1.8 mmHg, respectively. Canagliflozin 50, 100, and 300 mg and placebo were not associated with any clinically relevant changes in pulse rate (0.9, 1.5, 0.9, and 0 beats/minute, respectively).
IWQOL-Lite outcomes
Mean IWQOL-Lite total scores at baseline (range, 59.5-68.6) suggested moderate impairment of weight-related functioning and well-being across groups. Within each group, IWQOL-Lite total score increased from baseline to Week 12 (indicating improvement). As weight loss increased, IWQOL-Lite total scores increased (Figure 4A), as did the proportion of subjects treated with canagliflozin versus placebo (Figure 4B).
Figure 4.
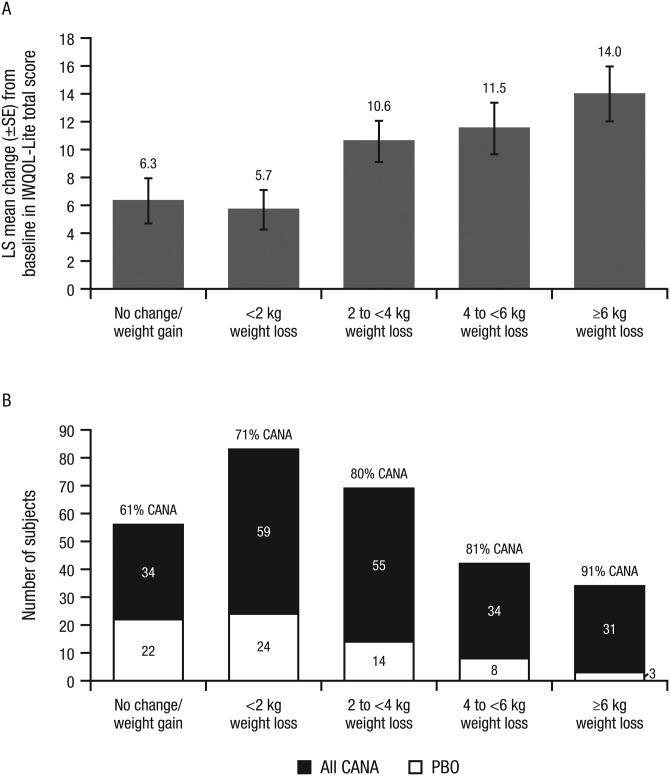
Change in IWQOL-Lite total score (A) and number of subjects treated with canagliflozin vs placebo (B) by weight change category at Week 12. IWQOL-Lite total scores were on a scale of 0 to 100 (higher scores indicating better health status). LS mean changes were calculated using an ANCOVA model with factors for treatment, sex, and run-in weight loss stratum, and baseline score as covariate; LOCF was not used to impute missing data for these exploratory analyses. ANCOVA, analysis of covariance; CANA, canagliflozin; IWQOL-Lite, Impact of Weight on Quality of Life-Lite questionnaire; LOCF, last observation carried forward; LS, least squares; PBO, placebo; SE, standard error.
Safety
The overall incidence of AEs was similar across treatment groups (Table 3). The incidence of serious AEs was low across groups (two with canagliflozin 50 mg and one with canagliflozin 300 mg; none with placebo or canagliflozin 100 mg) and none were considered related to study drug. None of the three serious AEs occurred during treatment with study drug; two occurred prior to the receipt of study drug (anemia secondary to dysfunctional uterine bleeding [canagliflozin 50 mg] and cholecystitis requiring surgery [canagliflozin 300 mg]), and one occurred after the last dose of study drug (arthralgia and hospitalization due to right hip pain 25 days after the last dose of study drug [canagliflozin 50 mg]). No deaths were reported. A total of 11 subjects (3%) discontinued treatment due to treatment-emergent AEs (all with canagliflozin); seven of these subjects had AEs that led to discontinuation that were possibly, probably, or very likely related to study drug as assessed by investigators. Among the most common AEs (≥5% in any group; Table 3), incidences of vulvovaginal mycotic infection, nausea, and sinusitis were higher with canagliflozin than with placebo. The majority of AEs were considered mild to moderate in severity by investigators.
Table 3.
Summary of overall safety and selected AEs
| Subjects, n (%) | ||||
|---|---|---|---|---|
| PBO (n = 89) | CANA 50 mg (n = 98) | CANA 100 mg (n = 93) | CANA 300 mg (n = 96) | |
| Any AE | 54 (61) | 73 (74) | 54 (58) | 60( 63) |
| AEs leading to discontinuation | 0 | 4 (4) | 3 (3) | 4 (4) |
| AEs related to study druga | 19 (21) | 34 (35) | 25 (27) | 28 (29) |
| Serious AEs | 0 | 2 (2) | 0 | 1 (1) |
| Most common AEs (≥5% in any treatment group) | ||||
| Urinary tract infection | 6 (7) | 10 (10) | 7 (8) | 8 (8) |
| Headache | 7 (8) | 6 (6) | 11 (12) | 4 (4) |
| Vulvovaginal mycotic infection | 1 (1) | 8 (8) | 5 (5) | 14 (15) |
| Upper respiratory tract infection | 5 (6) | 6 (6) | 6 (6) | 5 (5) |
| Nausea | 2 (2) | 7 (7) | 6 (6) | 3 (3) |
| Diarrhea | 5 (6) | 5 (5) | 3 (3) | 2 (2) |
| Constipation | 2 (2) | 5 (5) | 3 (3) | 2 (2) |
| Nasopharyngitis | 3 (3) | 6 (6) | 1 (1) | 1 (1) |
| Sinusitis | 0 | 6 (6) | 2 (2) | 1 (1) |
| Selected AEs of interest | ||||
| Genital mycotic infection | ||||
| Menb,c | 0 | 0 | 0 | 1 (1) |
| Womend,e | 3 (4) | 12 (14) | 10 (13) | 19 (22) |
| Osmotic diuresis-related AEsf | 2 (2) | 3 (3) | 3 (3) | 4 (4) |
| Symptomatic hypoglycemia | 2 (2) | 1 (1) | 0 | 2 (2) |
| Volume-related AEs | ||||
| Dizziness | 2 (2) | 4 (4) | 2 (2) | 4 (4) |
AE, adverse event; CANA, canagliflozin; PBO, placebo.
Possibly, probably, or very likely related to study drug, as assessed by investigators.
PBO, n = 14; CANA 50 mg, n = 12; CANA 100 mg, n = 17; CANA 300 mg, n = 10.
Including genital candidiasis.
PBO, n = 75; CANA 50 mg, n = 86; CANA 100 mg, n = 76; CANA 300 mg, n = 86.
Including vaginal candidiasis, vaginal infection, vaginitis bacterial, vulvovaginal mycotic infection, vaginal discharge, and vulvovaginal pruritus.
Including incontinence, micturition urgency, nocturia, pollakiuria, polyuria, stress urinary incontinence, and urge incontinence.
The incidence of genital mycotic infections was higher in women treated with canagliflozin compared to those who received placebo (Table 3); most of these AEs were assessed by investigators to be mild in intensity (none were considered serious), responded to routine topical and oral antifungal therapy, and resolved while continuing canagliflozin. Two female subjects (one each with canagliflozin 50 and 100 mg) discontinued the study due to genital mycotic infection AEs. One male subject experienced a genital mycotic infection (posthitis) with canagliflozin 300 mg. Incidences of UTIs were similar across groups. Low and similar rates of osmotic diuresis-related AEs were observed across groups (≤4% per group). Incidence of AEs related to reduced intravascular volume (e.g., dizziness) was similar across groups. The proportion of subjects reporting symptomatic hypoglycemia was low and similar across groups. The majority of hypoglycemia episodes were considered mild in severity by investigators and none were confirmed by blood glucose measurements; one subject discontinued due to a mild, unconfirmed AE of hypoglycemia (canagliflozin 300 mg).
Regarding clinical laboratory parameters, canagliflozin 50, 100, and 300 mg were associated with greater reductions in serum urate concentrations compared to placebo (mean changes of −67.1, −70.4, −78.5, and −6.0 µmol/L, respectively). Compared to placebo, all canagliflozin doses were associated with increases in hematocrit and hemoglobin (<5%). Canagliflozin 50 and 100 mg were also associated with modest decreases in estimated glomerular filtration rate (eGFR) compared to placebo (mean changes of −1.0, −1.8, and 0.3 mL/min/1.73 m2, respectively). Canagliflozin 300 mg was associated with an increase from baseline in eGFR (0.8 mL/min/1.73 m2). Canagliflozin 100 and 300 mg were associated with increases in blood urea nitrogen (BUN) compared to placebo and canagliflozin 50 mg (mean changes of 0.15, 0.25, −0.03, and −0.08 mmol/L [0.4, 0.7, −0.1, and −0.2 mg/dL], respectively). Except for an increase in collagen type-1 β-carboxy-telopeptide (CTX), a marker of bone resorption (mean changes of 0.08, 0.07, and 0.11 ng/mL with canagliflozin 50, 100, and 300 mg, respectively, vs 0.04 ng/mL with placebo), canagliflozin did not significantly differ from placebo regarding markers of bone formation (i.e., bone specific alkaline phosphatase, osteocalcin, propeptide amino-terminal type-1 procollagen [P1NP]) or bone resorption (i.e., tartrate resistant acid phosphatase [TRAP], urine N-telopeptide [uNTX]).
Discussion
Canagliflozin is an SGLT2 inhibitor associated with improved glycemic control and body weight reduction in patients with T2DM (1–4). Inhibition of renal glucose reabsorption is a unique mechanism and has the potential to produce negative caloric balance, even among those without diabetes mellitus. The primary endpoint of this 12-week, randomized, double-blind, Phase 2b study was the percent change in body weight compared to placebo from baseline through Week 12, among overweight and obese subjects without diabetes mellitus who received canagliflozin 50, 100, or 300 mg or placebo once daily. At Week 12 compared to baseline, canagliflozin at all doses studied produced small but statistically greater reductions from baseline in mean percent body weight and absolute body weight compared with placebo, with decreases in body weight observed at the earliest post-randomization visit – an effect that was continually progressive throughout the study. In addition, subjects with greater weight loss showed greater improvement in total scores for IWQOL-Lite, which was designed to measure the impact of body weight on functioning and well-being.
Similar to the findings of weight reduction, canagliflozin also produced small but statistically significant reductions in BMI compared to placebo, although canagliflozin did not result in changes in hip and waist circumference and waist/hip ratio that were significantly different compared to placebo. Canagliflozin did not result in clinically meaningful changes in glycemic parameters, lipids, or BP versus placebo.
The weight loss observed over 12 weeks in the current study was relatively modest (placebo-subtracted changes for all canagliflozin doses <2%). In a Phase 2 study of the same duration that assessed the efficacy and safety of canagliflozin in subjects with T2DM inadequately controlled with metformin, canagliflozin 50, 100, and 300 mg produced weight loss of −2.3%, −2.6%, and −3.4%, respectively, compared with −1.1% with placebo (1). These weight loss findings are also supported by the results of recent Phase 3 studies of canagliflozin in subjects with T2DM (2–4,16,18).
Canagliflozin is thought to reduce body weight due to loss of calories associated with increased UGE (4 kcal/g of glucose). All canagliflozin doses increased UGE throughout the 12-week treatment period. While 24-h UGE was not measured in this study, 24-h urinary caloric loss can be estimated using overnight UGE. Using the overnight UGE values reported here and the total daily UGE measured in a Phase 1 study in subjects without diabetes mellitus (mean 24-h UGE of 45 and 60 g with canagliflozin 100 and 300 mg, respectively) (7), the total caloric losses with canagliflozin 50, 100, and 300 mg over 12 weeks in subjects completing this study were calculated to be 9,072 kcal, 15,120 kcal, and 20,160 kcal, respectively, using an estimate of 4 kcal/g of glucose. Weight loss estimates over a 12-week period based on these values would be 1.2, 2.0, and 2.6 kg for canagliflozin 50, 100, and 300 mg, respectively, using an estimate of 7,700 kcal/kg of body weight and assuming no changes in energy expenditure or food intake. Thus, the reductions in body weight observed in the current trial (LS mean reductions of 1.9, 2.8, and 2.4 kg and placebo-subtracted reductions of 0.8, 1.6, and 1.3 kg for canagliflozin 50, 100, and 300 mg, respectively) are generally consistent with these predictions. In addition to urinary caloric loss due to increased UGE, the mild osmotic diuresis induced by canagliflozin may also contribute to the observed weight loss. Of note, while not assessed in the current 12-week study, body composition measurements based on dual-energy X-ray absorptiometry and computed tomography assessments conducted in Phase 3 studies of 26 to 52 weeks in duration have shown that the weight loss observed with canagliflozin is mainly (∼2/3) due to loss of fat versus lean mass, with slightly greater loss of visceral versus subcutaneous fat (18,19) in subjects with T2DM. Studies of longer duration would be necessary to assess changes in body composition in obese and overweight subjects without diabetes mellitus.
Across Phase 3 studies of canagliflozin in subjects with T2DM, the 300 mg dose has consistently produced larger body weight reductions than the 100 mg dose (2–4,16,18). In this study, canagliflozin 100 mg produced the greatest weight loss, while canagliflozin 300 mg produced the greatest increase in UGE. The reason for this apparent discrepancy is unclear, but could be partly explained by the relatively small sample size in this study.
Canagliflozin was generally well tolerated in this study, with overall incidences of AEs similar compared with placebo. Based on the mechanism of action of canagliflozin, this study examined a number of selected AEs of interest, including genital mycotic infections, AEs related to osmotic diuresis (e.g., pollakiuria [increased urine frequency], polyuria [increased urine volume]) and reduced intravascular volume (e.g., dizziness), and hypoglycemia. Canagliflozin was associated with an increased incidence of genital mycotic infections in women, which were determined by investigators to be mild in severity and responded to standard treatment; only two canagliflozin-treated subjects discontinued due to these AEs. The increased occurrence of genital mycotic infections in women may be attributable to increased UGE leading to increased vulvovaginal Candida growth and vaginal candidiasis in some women (19). Compared to placebo, canagliflozin was not associated with meaningful differences in incidences of AEs related to osmotic diuresis and reduced intravascular volume or symptomatic hypoglycemia, but was associated with small differential changes in clinical laboratory parameters including a reversible decrease in serum urate, a modest and reversible increase in BUN, and a decrease in eGFR. These effects may reflect mild hemoconcentration secondary to the mild osmotic diuresis associated with increased UGE during canagliflozin treatment. The observed decreases in serum urate may be mediated by glucosuria facilitating urate efflux into the tubular lumen by the high-capacity urate transporter SLC2A9 (GLUT9) (20).
A limitation of this trial was the 25% discontinuation rate, which is similar to the discontinuation rates observed in other Phase 2b dose-ranging pharmacotherapy trials of obese patients (21–23). Another limitation with respect to efficacy and safety is the relatively short duration. In this 12-week study, canagliflozin 50, 100, and 300 mg produced approximately 2 to 3 kg of weight loss compared to baseline, and approximately 1 to 1.5 kg of weight loss compared to placebo. However, a review of the weight loss trend suggests that a weight loss nadir was not achieved by Week 12 with canagliflozin, raising the possibility that a similar clinical trial conducted over a longer period of time might have achieved greater weight reduction. For a frame of reference regarding the degree of weight loss achieved even within the context of this short-term clinical trial, a meta-analysis of orlistat (a gastrointestinal lipase inhibitor approved as a weight maintenance therapeutic) involving studies of longer duration suggested that orlistat might be expected to produce a placebo-subtracted weight reduction of approximately 2.4 kg over up to 2 years (24). Placebo-subtracted weight reductions of 1.5 to 2.9 kg were seen in a 12-week trial of the weight loss agent lorcaserin 21. Another limitation of the current study is that while canagliflozin improved (reduced) the weight of patients who were overweight or obese, it is unclear as to how this weight reduction might affect adipocyte and adipose tissue function, and thus translate into long-term health benefits (25,26). Regarding safety, it is possible that a longer study may be associated with more reported AEs.
In conclusion, relative to placebo over a 12-week treatment period in overweight and obese subjects without diabetes mellitus, canagliflozin at doses of 50, 100, and 300 mg per day was generally well tolerated and produced statistically significant reductions in body weight.
Acknowledgments
This study was supported by Janssen Research & Development, LLC. The authors thank all investigators, study teams, and patients for participating in this study. The authors acknowledge Yue Zhao, PhD, who was the statistician on the study and held the position of senior manager at Janssen Research & Development, LLC, at the time of her death. Editorial support was provided by Kimberly Dittmar, PhD, of MedErgy and was funded by Janssen Global Services, LLC. Canagliflozin has been developed by Janssen Research & Development, LLC, in collaboration with Mitsubishi Tanabe Pharma Corporation.
Supporting Information
Additional Supporting Information may be found in the online version of this article.
Supplementary Information
References
- 1.Rosenstock J, Aggarwal N, Polidori D, et al. Dose-ranging effects of canagliflozin, a sodium-glucose cotransporter 2 inhibitor, as add-on to metformin in subjects with type 2 diabetes. Diabetes Care. 2012;35:1232–1238. doi: 10.2337/dc11-1926. [DOI] [PMC free article] [PubMed] [Google Scholar]
- 2.Schernthaner G, Gross JL, Rosenstock J, et al. Canagliflozin compared with sitagliptin for patients with type 2 diabetes who do not have adequate glycemic control with metformin plus sulfonylurea: a 52-week, randomized trial. Diabetes Care. 2013;36:2508–2515. doi: 10.2337/dc12-2491. [DOI] [PMC free article] [PubMed] [Google Scholar]
- 3.Stenlöf K, Cefalu WT, Kim K-A, et al. Efficacy and safety of canagliflozin monotherapy in subjects with type 2 diabetes mellitus inadequately controlled with diet and exercise. Diabetes Obes Metab. 2013;15:372–382. doi: 10.1111/dom.12054. [DOI] [PMC free article] [PubMed] [Google Scholar]
- 4.Yale JF, Bakris G, Cariou B, et al. Efficacy and safety of canagliflozin in subjects with type 2 diabetes and chronic kidney disease. Diabetes Obes Metab. 2013;15:463–473. doi: 10.1111/dom.12090. [DOI] [PMC free article] [PubMed] [Google Scholar]
- 5.Bays H. From victim to ally: the kidney as an emerging target for the treatment of diabetes mellitus. Curr Med Res Opin. 2009;25:671–681. doi: 10.1185/03007990802710422. [DOI] [PubMed] [Google Scholar]
- 6.Liang Y, Arakawa K, Ueta K, et al. Effect of canagliflozin on renal threshold for glucose, glycemia, and body weight in normal and diabetic animal models. PLoS ONE. 2012;7:e30555. doi: 10.1371/journal.pone.0030555. [DOI] [PMC free article] [PubMed] [Google Scholar]
- 7.Sha S, Devineni D, Ghosh A, et al. Canagliflozin, a novel inhibitor of sodium glucose co-transporter 2, dose dependently reduces calculated renal threshold for glucose excretion and increases urinary glucose excretion in healthy subjects. Diabetes Obes Metab. 2011;13:669–672. doi: 10.1111/j.1463-1326.2011.01406.x. [DOI] [PubMed] [Google Scholar]
- 8.Devineni D, Morrow L, Hompesch M, et al. Canagliflozin improves glycemic control over 28 days in subjects with type 2 diabetes not optimally controlled on insulin. Diabetes Obes Metab. 2012;14:539–545. doi: 10.1111/j.1463-1326.2012.01558.x. [DOI] [PubMed] [Google Scholar]
- 9.Polidori D, Sha S, Ghosh A, Plum-Morschel L, Heise T, Rothenberg P. Validation of a novel method for determining the renal threshold for glucose excretion in untreated and canagliflozin-treated subjects with type 2 diabetes mellitus. J Clin Endocrinol Metab. 2013;98:E867–E871. doi: 10.1210/jc.2012-4205. [DOI] [PMC free article] [PubMed] [Google Scholar]
- 10.Sarich T, Devineni D, Ghosh A, et al. Canagliflozin, a novel inhibitor of sodium glucose co-transporter 2 (SGLT2), increases 24-h urinary glucose excretion and decreases body weight in obese subjects (Abstract) Diabetes. 2010;59 [Google Scholar]
- 11.Chobanian AV, Bakris GL, Black HR, et al. The Seventh Report of the Joint National Committee on Prevention, Detection, Evaluation, and Treatment of High Blood Pressure: the JNC 7 report. JAMA. 2003;289:2560–2572. doi: 10.1001/jama.289.19.2560. [DOI] [PubMed] [Google Scholar]
- 12.US Department of Health and Human Services, Food and Drug Administration, Center for Drug Evaluation and Research (CDER) Guidance for industry: developing products for weight management. 2007. pp. 1–19.
- 13.National Cholesterol Education Program, National Heart LaBI, National Institutes of Health. Third Report of the National Cholesterol Education Program (NCEP) Expert Panel on Detection, Evaluation. and Treatment of High Blood Cholesterol in Adults (Adult Treatment Panel III) Final Report. 2002:1–284. [PubMed] [Google Scholar]
- 14.Kolotkin RL, Crosby RD, Kosloski KD, Williams GR. Development of a brief measure to assess quality of life in obesity. Obes Res. 2001;9:102–111. doi: 10.1038/oby.2001.13. [DOI] [PubMed] [Google Scholar]
- 15.Kolotkin RL, Crosby RD. Psychometric evaluation of the impact of weight on quality of life-lite questionnaire (IWQOL-Lite) in a community sample. Qual Life Res. 2002;11:157–171. doi: 10.1023/a:1015081805439. [DOI] [PubMed] [Google Scholar]
- 16.Bode B, Stenlof K, Sullivan D, Fung A, Usiskin K. Efficacy and safety of canagliflozin in older subjects with type 2 diabetes: a randomized trial. Hosp Pract. 2013;41:72–84. doi: 10.3810/hp.2013.04.1020. [DOI] [PubMed] [Google Scholar]
- 17.Cefalu WT, Leiter LA, Yoon K-H, et al. Efficacy and safety of canagliflozin versus glimepiride in patients with type 2 diabetes inadequately controlled with metformin (CANTATA-SU): 52 week results from a randomised, double-blind, phase 3 non-inferiority trial. Lancet. 2013;382:941–950. doi: 10.1016/S0140-6736(13)60683-2. [DOI] [PubMed] [Google Scholar]
- 18.Toubro S, Cefalu WT, Xie J, et al. Canagliflozin, a sodium glucose co-transporter 2 inhibitor, reduces body weight mainly through loss of fat mass in subjects with type 2 diabetes (Abstract) Diabetologia. 2012;55:S313–S314. [Google Scholar]
- 19.Nyirjesy P, Zhao Y, Ways K, Usiskin K. Evaluation of vulvovaginal symptoms and Candida colonization in women with type 2 diabetes mellitus treated with canagliflozin, a sodium glucose co-transporter 2 inhibitor. Curr Med Res Opin. 2012;28:1173–1178. doi: 10.1185/03007995.2012.697053. [DOI] [PubMed] [Google Scholar]
- 20.Caulfield MJ, Munroe PB, O'Neill D, et al. SLC2A9 is a high-capacity urate transporter in humans. PLoS Med. 2008;5:e197. doi: 10.1371/journal.pmed.0050197. [DOI] [PMC free article] [PubMed] [Google Scholar]
- 21.Smith SR, Prosser WA, Donahue DJ, Morgan ME, Anderson CM, Shanahan WR. Lorcaserin (APD356), a selective 5-HT(2C) agonist, reduces body weight in obese men and women. Obesity (Silver Spring) 2009;17:494–503. doi: 10.1038/oby.2008.537. [DOI] [PubMed] [Google Scholar]
- 22.Van Gaal LF, Broom JI, Enzi G, Toplak H. Efficacy and tolerability of orlistat in the treatment of obesity: a 6-month dose-ranging study. Orlistat Dose-Ranging Study Group. Eur J Clin Pharmacol. 1998;54:125–132. doi: 10.1007/s002280050433. [DOI] [PubMed] [Google Scholar]
- 23.Bray GA, Hollander P, Klein S, et al. A 6-month randomized, placebo-controlled, dose-ranging trial of topiramate for weight loss in obesity. Obes Res. 2003;11:722–733. doi: 10.1038/oby.2003.102. [DOI] [PubMed] [Google Scholar]
- 24.Zhou YH, Ma XQ, Wu C, et al. Effect of anti-obesity drug on cardiovascular risk factors: a systematic review and meta-analysis of randomized controlled trials. PLoS ONE. 2012;7:e39062. doi: 10.1371/journal.pone.0039062. [DOI] [PMC free article] [PubMed] [Google Scholar]
- 25.Bays HE. Adiposopathy: is “sick fat” a cardiovascular disease? J Am Coll Cardiol. 2011;57:2461–2473. doi: 10.1016/j.jacc.2011.02.038. [DOI] [PubMed] [Google Scholar]
- 26.Bays HE. Adiposopathy, diabetes mellitus, and primary prevention of atherosclerotic coronary artery disease: treating “sick fat” through improving fat function with antidiabetes therapies. Am J Cardiol. 2012;110:4B–12B. doi: 10.1016/j.amjcard.2012.08.029. [DOI] [PubMed] [Google Scholar]
Associated Data
This section collects any data citations, data availability statements, or supplementary materials included in this article.
Supplementary Materials
Supplementary Information