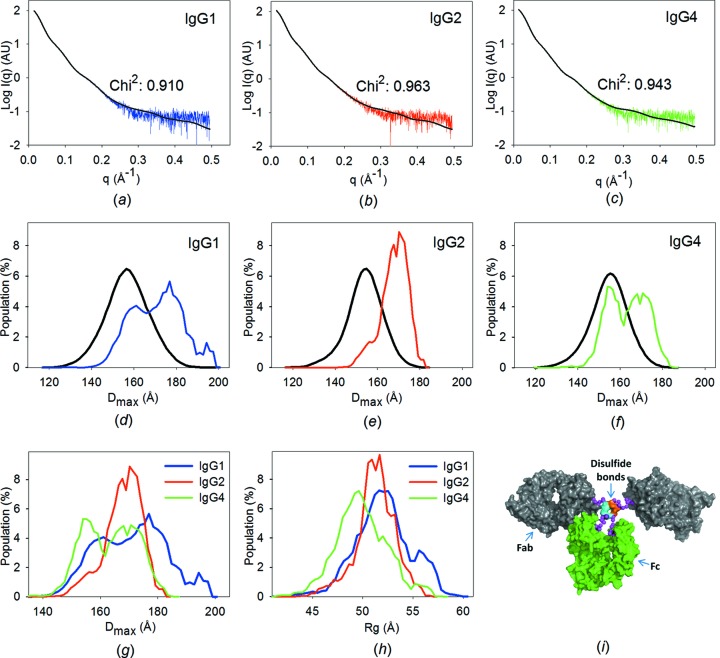
Figure 2.
Results of ensemble optimization. (a)–(c) Fits between the calculated scattering curve from the best ensemble (coloured, selected by EOM) and the experimental data (black). (d)–(f) D max distributions of the conformers in the pool (black) and the optimized ensembles (coloured). (g) Comparison of the D max and (h) of the R g distributions in the optimized ensembles of the three IgG subclasses. (i) A representative structural model of IgG1 generated by RANCH.

