Abstract
Background
Middle-ear anatomy is integrally linked to both its normal function and its response to disease processes. Micro-CT imaging provides an opportunity to capture high-resolution anatomical data in a relatively quick and non-destructive manner. However, to optimally extract functionally relevant details, an intuitive means of reconstructing and interacting with these data is needed.
Materials and methods
A micro-CT scanner was used to obtain high-resolution scans of freshly explanted human temporal bones. An advanced volume renderer was adapted to enable real-time reconstruction, display, and manipulation of these volumetric datasets. A custom-designed user interface provided for semi-automated threshold segmentation. A 6-degrees-of-freedom navigation device was designed and fabricated to enable exploration of the 3D space in a manner intuitive to those comfortable with the use of a surgical microscope. Standard haptic devices were also incorporated to assist in navigation and exploration.
Results
Our visualization workstation could be adapted to allow for the effective exploration of middle-ear micro-CT datasets. Functionally significant anatomical details could be recognized and objective data could be extracted.
Conclusions
We have developed an intuitive, rapid, and effective means of exploring otological micro-CT datasets. This system may provide a foundation for additional work based on middle-ear anatomical data.
Keywords: Microct, Middle ear, Otolaryngology, Volume rendering, Haptics, Otology
1. Introduction
The middle-ear anatomy is integrally linked to both its normal function and its response to disease processes. To improve our understanding of middle-ear anatomy, we require an intuitive and effective method to examine its morphology in a non-destructive manner. The advent of volumetric CT has made it possible to image features of interest relatively quickly and without the need for physical sectioning. While images acquired using standard clinical CT scanners lack the spatial resolution needed to fully capture the intricacy of middle-ear anatomy, micro-computed tomography (micro-CT) imaging provides high-resolution anatomical data that accurately represent finely detailed structures such as the ossicles.
The traditional method of evaluating volumetric middle-ear datasets has been through the examination of sequential two-dimensional images. This approach presents a challenge to accurately identify critical anatomical structures and to locate their relative positions in three-dimensional space (Seemann et al., 1999; Rodt et al., 2002). Unless structures of interest happen to be aligned with the image-acquisition plane, accurate measurements of locations, distances, and angles can be particularly difficult to obtain.
A number of approaches have been presented for reconstructing and visualizing 3D models of the middle ear for education (Jun et al., 2005; Wang et al., 2007), construction of biomechanical models (Decraemer et al., 2003; Sim et al., 2007), and pre-operative assessment (Handzel et al., 2009). Most methods employ a computer-assisted manual segmentation (Rodt et al., 2002), an automatic threshold-based segmentation (Neri et al., 2001), or some combination thereof (Seemann et al., 1999; Jun et al., 2005; Sim et al., 2007; Sim and Puria, 2008; Handzel et al., 2009) to delineate the anatomical structures of interest. Specialized software can then be used to generate 3D polygonal surface geometry from the segmented data. The resulting hollow surface “shells” can then be interactively rendered for visualization and analysis.
A significant limitation of this method of surface extraction is the difficult and laborious preparation of the data, particularly in the segmentation step. Preparation times of up to several hours are common (Seemann et al., 1999; Jun et al., 2005; Rodt et al., 2002) before any interactive visualization and analysis can take place. Additionally, volume data located inside these surfaces are obscured from the user unless they are explicitly retained and rendered by other means.
An alternative is the use of volumetric rendering (Seemann et al., 1999), which preserves and displays the entire 3D dataset, rather than solely extracting and displaying surfaces. It does not require dataset preparation and image segmentation techniques, reducing the learning curve and time investment for the user. Volumetric rendering has the capability to display geometry in real time, and has been employed for use in “virtual endoscopy”. However, the majority of these programs run exclusively on proprietary clinical scanners and has not been optimized to run on the commodity hardware currently available on desktop workstations. Similarly, available software cannot easily manage the large size of the high-resolution datasets from micro-CT scanning.
Most of the rendering tools available today also lack the capability to rapidly and intuitively navigate, explore, and analyze a dataset once it is rendered. The user should be able to move through the virtual space in a familiar, comfortable way, and be able to “reach into” the virtual anatomy to identify specific features of interest. Our sense of touch, which is critical in our interactions with real 3D objects, can now be applied to the exploration of virtual environments through haptic interfaces. Enabling such a fundamental sense promises to provide the user with insight that is currently unavailable in most visualization software. In addition, the ability to rapidly and intuitively perform quantitative measurements is an easy and logical extension of such a tactile user interface.
In this paper, we present a software and hardware suite with the objective of overcoming some of the limitations of existing methods. We have developed a system with interactivity and ease of use in mind that allows clinicians and scientists to explore and analyze micro-CT scans of the middle ear. By combining state-of-the-art software and hardware technologies such as direct volume rendering, haptic feedback, virtual surgical microscope navigation, and a user-friendly interface, we seek to create an interactive morphometric workstation that allows the user to quickly and intuitively explore micro-CT data and perform quantitative measurements directly on the anatomical structures of interest. This software represents an effective method to reconstruct and explore otological micro-CT datasets for education and research, and to yield greater understanding of relevant middle-ear functional anatomy.
2. Materials and methods
2.1. Micro-CT scans
Human temporal bones from three cadavers were harvested within 2 days of death and frozen immediately upon extraction. The surrounding tissues were removed to allow the specimen to fit within the micro-CT scanner and to minimize the potential beam-hardening artifacts caused by adjacent dense bone (Sim et al., 2007; Baek and Puria, 2008).
High-resolution micro-CT scans were obtained of these specimens using a Scanco VivaCT 40 micro-CT system (Scanco Medical, Basserdorf, Switzerland). The scans were obtained with the default medium resolution setting, an energy level of 45 keV, an X-ray intensity setting of 145 μA, and an integration time of 2000 ms. This produced an isotropic volume dataset with a resolution of 19.5 μm per voxel side-length, with 2048 by 2048 pixels per slice. The total number of slices ranged from 508 to 868. The scanned region included at least the tympanic annulus, middle-ear cavity, and inner ear.
We designed and coded custom software utilizing the Insight Segmentation and Registration Toolkit (ITK) (http://www.itk.org/) to prepare the datasets for loading into our visualization software suite. The original dataset resolution exceeded the maximum memory capacity supported by our highest-end video graphics card, which was 768 MB on the GeForce GTX 260. Therefore, the datasets were cropped and/or down-sampled to yield a final size of 512 by 512 by 512 voxels. The resulting final resolution ranged from 19.5 to 76.0 μm per voxel side-length. When possible, cropping was used preferentially to optimize the resolution in areas of interest.
2.2. Three-dimensional visualization
Our visualization software suite supports two distinct volumetric rendering techniques: isosurface and direct volume rendering. Isosurface rendering generates contiguous surfaces along regions of the dataset that share the same radiodensity value (Hadwiger et al., 2005). These isosurfaces are displayed by shading them with a single color and opacity. This is effective for demonstrating boundaries between tissues with distinctly different Hounsfield units. In contrast, direct volume rendering maps a color and opacity to each voxel based on its radiodensity (Kniss et al., 2002). By utilizing a combination of both techniques, our software can render both solid homogeneous and inhomogeneous tissues.
2.3. Virtual microscope
Our virtual microscope interface is an input device custom-designed to resemble the pistol grip of a surgical microscope. The interface consists of two SpaceNavigator (3Dconnexion, Fremont, CA) three-dimensional navigation devices, connected to the ends of a grip bar, housed within a particle-board enclosure. In order to move through the virtual three-dimensional environment, the user grips the bar and applies translational or rotational force. These forces result in displacement of the bar from its neutral position, which is interpreted by our software as instructions to move the point of view of the user while keeping the rendered volume dataset stationary, just as is the case with a real surgical microscope. Our initial experience has suggested that this approach yields an intuitive means of navigating even complex 3D geometry, with a reasonable learning curve even for those not familiar with the use of a surgical microscope.
2.4. Haptic interface
Measurements of 3D structures can be performed interactively using a Phantom Omni (SensAble Technologies, Woburn, MA) haptic interface device. The device resembles a pen or surgical instrument mounted on a robotic arm, which is capable of sensing position and orientation in three-dimensional space. More importantly, it can apply directional force feedback to simulate the sense of touch or deliver haptic feedback. We use this haptic device to control the position of a virtual measuring tool, represented by colored spheres within our 3D environment as seen in Fig. 2. As the virtual tool is moved through the 3D environment, a haptic rendering software algorithm (Salisbury and Tarr, 1997) is employed to command resistive forces through the haptic device whenever the virtual tool touches structures that are visually rendered. As a result, anatomical surfaces and contours in the data can be physically touched and felt.
Fig. 2.
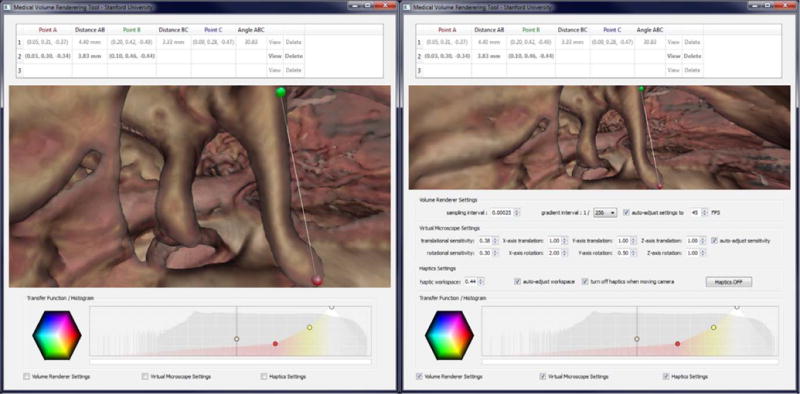
Left: Software-suite interface with haptic measurement tool enabled. Red and green spheres represent selected measurement points. Right: Control panels allow fine-tuning of all input devices and volume-rendering quality settings. (For interpretation of the references to color in this figure legend, the reader is referred to the web version of this paper.)
This interaction paradigm can mimic the action of taking measurements on the anatomical structures using a physical device, and is much more intuitive for this task than the use of a computer mouse and keyboard. Using the virtual tool, markers can be placed very accurately and in precise locations on the surface of structures of interest in 3D. Our software then rapidly computes useful quantitative characteristics between markers, such as location, distance, and orientation.
2.5. Software user interface
CT volume datasets are comprised of a three-dimensional array of intensities, with high values corresponding to regions of high X-ray attenuation such as bone, low values corresponding to air, and intermediate values representing soft tissues and fluids. Any medical volume-rendering visualization software requires the ability to map the appropriate color to the correct image intensity, either to render a physiologically realistic scene or to highlight certain tissue layers for illustrative purposes. The equations or instructions that map an intensity value to a color are known as the transfer function.
On launch, our software comes preloaded with a transfer function that can serve as a starting point for most clinical and research datasets. However, the exact intensity ranges corresponding to bone and soft tissue vary between different specimens and scans. Even the same material can have a different intensity value in a micro-CT scan depending on the scan conditions and specimen preparation (Sim et al., 2007; Sim and Puria, 2008).
Since there are currently no reliable methods of automatically adjusting for such variability in radiodensity measurements, we have provided the ability to adjust and modify the transfer function. Our user interface features an intuitive and interactive method of modifying the visual output of the volume renderer. The transfer function is represented by a color graph displayed in a rectangular box. The graph’s horizontal position represents a radiodensity value. This is then assigned a color, which may be arbitrarily assigned to a marker at that specific location. The transparency is represented by the height of the marker at that position.
The values that lie between the markers are interpolated to fill in appropriate intervening color and transparency values. The user can make quick and interactive changes to the transfer function by adding new markers or dragging existing ones. Separate colors can be assigned to the right and left side of a marker, making it possible to simulate hard color transitions at specific radiodensity values. The isosurface color and threshold are modified through a similar interface. The graph is superimposed on a histogram of voxel radiodensity, which facilitates quick identification of the intensity boundaries between tissues.
In conjunction with the interactive haptic controls and the virtual measuring tool, the software interface stores, displays, and processes an arbitrary number of user-selected marker points within the volume dataset. The user can calculate distances, angles, and areas based on these points. These results can be exported to a text file for analysis and reporting in a separate program or document.
3. Results
Our software suite runs at interactive frame rates displaying a 512 by 512 by 512 voxel dataset on a variety of consumer-level personal computers. On our development computer, containing a quad-core Intel Core i7 920 processor (Intel, Santa Clara, CA) with an NVIDIA GeForce GTX 260 (NVIDIA, Santa Clara, CA) video card with 768 MB memory, our software is fully interactive at full screen resolution, running at 30–60 frames per second with high rendering quality. Often the limiting factor is video card speed, particularly the number and speed of its shading units. At reduced window resolution and rendering quality, our software runs at an acceptable 10–20 frames per second on entry-level laptop hardware, such as an Intel Core 2 Duo P7350 processor with an onboard NVIDIA GeForce 9400 M GPU with 256 MB memory. Our software is capable of dynamically adjusting its settings to optimize the tradeoff between rendering fidelity and speed.
We used our software to examine three different micro-CT scans of human temporal bones. Each dataset was prepared by cropping and/or downscaling as previously described, to fit within the video card’s memory capacity. The process of loading these modified datasets, adjusting the transfer function, navigating to the external auditory canal entrance via the virtual microscope interface, and positioning the camera for optimal viewing of the ossicles and middle-ear cavity takes less than 60 s, and as little as 15 s with some experience.
Figs. 3–6 demonstrate the visual results of volume rendering combined with high-resolution micro-CT datasets. Considerable detail can be seen of functionally-relevant anatomy. We found that the use of the haptic interface device to control a virtual tool allowed the user to quickly and accurately place measurement markers on specific structures and anatomical features. In order to demonstrate the accuracy of our measuring tool, we loaded a micro-CT scan of a standardized “phantom” object, which was a plastic cube roughly 6 mm on each side. The width, height and depth of this cube were measured physically using digital calipers and also virtually by measuring the rendered cube from the micro-CT scan using our software. The dimensions of the cube were found to be 6.25 mm by 5.98 mm by 6.28 mm by physical measurement, and 6.20 mm by 6.02 mm by 6.31 mm by virtual measurement. Therefore, measurements taken by the visualization software were within 1.0% of real-life values.
Fig. 3.
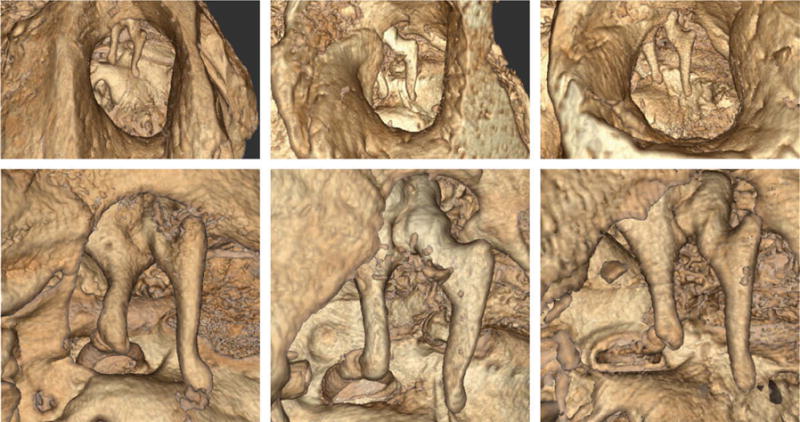
Side by side comparison of three right human temporal-bone micro-CT dataset renderings in our software. Columns represent different temporal-bone specimens. Top images show views centered about the entrance of the external auditory canal. Bottom images demonstrate close-up views of the ossicles.
Fig. 6.
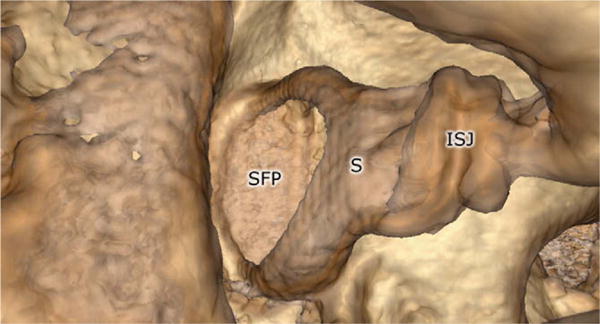
Close-up view of the stapes, demonstrating fine anatomic details possible with volume-rendered micro-CT volume datasets. The incudospadeal joint (ISJ), stapes (S), and stapes footplate (SFP) are all shown.
4. Discussion
We have developed a visualization suite that allows a clinician or scientist to interactively and intuitively examine micro-CT images of middle-ear specimens in 3D while providing the potential to extract useful morphometric measurements rapidly and accurately. A custom hardware device controls a virtual microscope and permits intuitive navigation through the data volume, and works with commercially available haptic devices that provide force feedback to facilitate interaction with and measurement of the rendered structures. We examined micro-CT datasets of three distinct cadaver temporal-bone specimens, and have demonstrated that the reconstructed images accurately represent the fine features of middle-ear anatomy. Fig. 1 shows the complete workstation. Copies of this software with be made available for download free of charge at http://simtk.org/home/otobiomech.
Fig. 1.
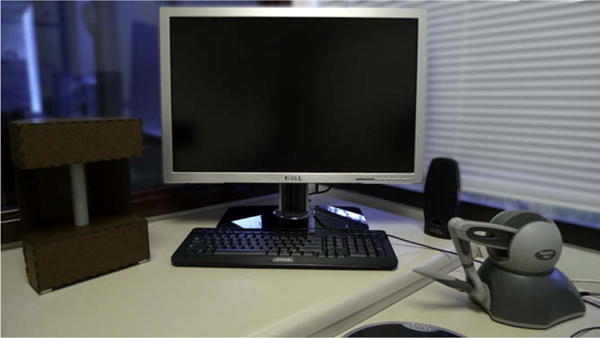
Computer workstation set-up, including a 6-degrees-of-freedom navigation device (virtual microscope) (left), a haptic-feedback device (right), and a software-based user interface (center).
Traditional methods of 3D visualization of CT image data generally involved creating 3D polygonal models by extracting surfaces from the image intensity grid. Recent advances in commodity graphics rendering hardware and software technology have changed this paradigm, allowing the 3D image data to be rendering directly, without the need to explicitly construct polygonal models, using direct volume rendering. Furthermore, complex color mapping and illumination computations can be performed on the fly to lend the resulting rendered image a more realistic appearance.
Although interactive volume-rendering capabilities are available in some existing software systems, mostly in the domain of radiology, we elected to develop our own implementation of these techniques for two important reasons. First, we required the visualization to integrate with and function seamlessly with our virtual microscope interface and haptic devices, which are paramount to the goals of our method. These devices required specific software control algorithms to operate, and thus could not be interfaced with any pre-packaged visualization system. Second, we wanted to generate the highest-quality images given the available hardware, and to allow the user to fully control the visual properties of the resulting rendering. This is important because most freely or commercially available software is not tailored for visualization and analysis of middle-ear micro-CT data, if they are even capable of accepting this type of input.
Prior studies have demonstrated the clinical utility of 3D-rendered CT scans for use in clinical diagnosis and treatment. Martin et al. (2004) found 3D reconstruction superior to standard 2D views for diagnosis of ossicular or prosthesis dislocation, but not for other pathologies of the ossicular chain such as ossicularlysis and aplasia (Martin et al., 2004). However, their protocol limited the radiologist to two standardized views with surface rendering only. Similarly, Pandey et al. (2009) reported that 3D reconstructions were superior to standard 2D views for evaluation of the stapes superstructure, and results correlated strongly with intraoperative findings (Pandey et al., 2009). The radiologist in this study was limited to six standardized views.
Major reasons cited for reduced clinical usefulness of 3D visualization include poor scan quality and difficulty in navigating through the 3D environment. (Vrabec et al., 2002) However, evolving state-of-the-art multi-detector CT technology continues to improve the resolution of clinical scans. By facilitating intuitive navigation and enabling high-fidelity and customized rendering, we hope our visualization suite and others like it will see an expanded role in clinical decision-making and surgical planning.
Visualization software has been used to plan the fitting of middle-ear implants and drug-delivery devices (Handzel et al., 2009). The space for such devices within the mastoid cavity varies tremendously between individuals depending on genetics and otological past medical history. Linear measurements such as those obtained from standard 2D views are inadequate to fully characterize this space. Although our software does not currently have the capability to measure volumes of selected regions within the dataset, we anticipate adding this feature shortly and that it will greatly enhance the clinical utility of our software.
The ability to load and visualize micro-CT middle-ear datasets makes this a powerful educational tool for learning the intricacies of middle-ear anatomy. Such fine structures as the ossicles and their ligamentous attachments are not adequately rendered from clinical CT scans, and normally not appreciated until the trainee first encounters them through the operating microscope on an actual patient. Our visualization suite is an interactive anatomy lesson for residents and medical students. By exploring the middleear space at high resolution, the trainee can quickly grasp the 3D relationships between its structures and achieve a sense of their shape and scale via the haptic interface.
A limitation of our method is that it does not explicitly extract the geometry of the structures of interest from the CT image data during visualization and analysis. Although the anatomy can be seen and even touched in full three-dimensional detail, it cannot currently be used for further analysis in applications such as biomechanical modeling, where explicit segmentation and geometric representation is required. A second consequence of this is that the software lacks any form of anatomical knowledge with regard to the specimen, so it is currently impossible to highlight a specific structure by name or toggle the visibility of certain structures. However, the addition of a segmentation step and an expert system to provide these capabilities is a viable option.
We are currently working on building this system into a fully featured surgical simulation environment (Morris et al., 2006). Additional features, such as the integration of a stereoscopic display and the ability to manipulate tissue with virtual surgical instruments will further increase the utility of the system. In addition, we are investigating the application of collision detection and haptic feedback into the navigation system. A method that will discourage or prevent the virtual microscope from flying through solid structures promises to aid considerably in negotiating the complex geometry of the middle ear.
The interactivity and intuitiveness of virtual simulation user interfaces are generally evaluated subjectively by user questionnaires. More objective measures include timed tasks such as maneuvering the camera position to a certain position and direction, or completion of specific tasks enabled by the simulation suite. We anticipate carrying out such studies with the next iteration of our software. However, preliminary experiences with our visualization suite have been described as positive by users encompassing a wide range of skills and backgrounds in surgery and engineering.
We expect that, with additional validation, these technologies will enable further insights into otological function and disorders. The technologies may contribute to clinical care through improving the understanding of salient anatomy, improving diagnosis and pre-operative planning, and aiding in the optimal design and fitting of ossicular reconstructive materials or implantable hearing devices. Similarly, through applying these technologies to biomechanical modeling, they may also contribute to our understanding of the basic functioning of the hearing mechanisms.
Fig. 4.
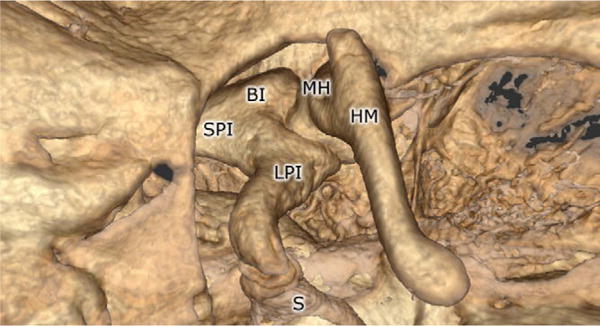
Rendering of the ossicles using the volume renderer. The body of the incus (BI), long process of the incus (LPI), malleus head (MH), handle of the malleus (HM), stapes (S), and short process of the incus (SPI) are all shown.
Fig. 5.
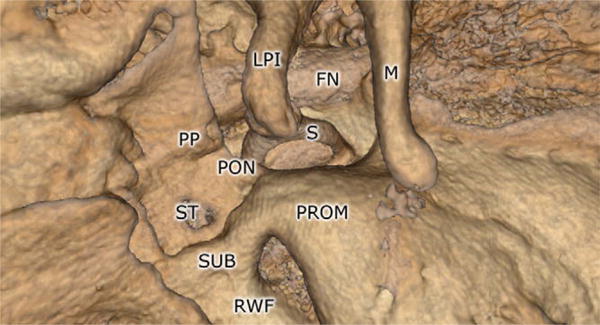
Rendering of middle-ear landmarks using the volume renderer. The facial nerve (FN), long process of the incus (LPI), malleus (M), ponticulus (PON), pyramidal process (PP), promontory (PROM), round-window fossa (RWF), stapes (S), sinus tympani (ST), and subiculum (SUB) are all shown.
References
- Baek JD, Puria S. Stapes model using high-resolution μCT. Proc SPIE. 2008;6842:68421C. [Google Scholar]
- Decraemer WF, Dirckx JJJ, Funnell WRJ. Three-dimensional modelling of the middle-ear ossicular chain using a commercial high-resolution X-ray CT scanner. J Assoc Res Otolaryngol. 2003;4:250–263. doi: 10.1007/s10162-002-3030-x. [DOI] [PMC free article] [PubMed] [Google Scholar]
- Hadwiger M, Sigg C, Scharsach H, Bühler K, Gross M. Real-time raycasting and advanced shading of discrete isosurfaces. Comput Graph Forum. 2005;24:303–312. [Google Scholar]
- Handzel O, Wang H, Fiering J, Borenstein JT, Mescher MJ, Swan EE, Murphy BA, Chen Z, Peppi M, Sewell WF, Kujawa SG, McKenna MJ. Mastoid cavity dimensions and shape: method of measurement and virtual fitting of implantable devices. Audiol Neurootol. 2009;14(5):308–314. doi: 10.1159/000212110. [DOI] [PMC free article] [PubMed] [Google Scholar]
- Jun BC, Song SW, Cho JE, Park CS, Lee DH, Chang KH, Yeo SW. Three-dimensional reconstruction based on images from spiral high-resolution computed tomography of the temporal bone: anatomy and clinical application. J Laryngol Otol. 2005;119(9):693–698. doi: 10.1258/0022215054797862. [DOI] [PubMed] [Google Scholar]
- Kniss JM, Kindlmann G, Hansen CD. Multi-dimensional transfer functions for interactive volume rendering. IEEE Trans Visual Comput Graphics. 2002;8:270–285. [Google Scholar]
- Martin C, Michel F, Pouget JF, Veyret C, Bertholon P, Prades JM. Pathology of the ossicular chain: comparison between virtual endoscopy and 2D spiral CT-data. Otol Neurotol. 2004;25(3):215–219. doi: 10.1097/00129492-200405000-00002. [DOI] [PubMed] [Google Scholar]
- Morris D, Sewell C, Barbagli F, Salisbury K, Blevins NH, Girod S. Visuohaptic simulation of bone surgery for training and evaluation. IEEE Comput Graph Appl. 2006;26(6):48–57. doi: 10.1109/mcg.2006.140. [DOI] [PubMed] [Google Scholar]
- Neri E, Caramella D, Panconi M, Berrettini S, Sellari Franceschini S, Forli F, Bartolozzi C. Virtual endoscopy of the middle ear. Eur Radiol. 2001;11(1):41–49. doi: 10.1007/s003300000612. [DOI] [PubMed] [Google Scholar]
- Pandey AK, Bapuraj JR, Gupta AK, Khandelwal N. Is there a role for virtual otoscopy in the preoperative assessment of the ossicular chain in chronic suppurative otitis media? Comparison of HRCT and virtual otoscopy with surgical findings. Eur Radiol. 2009;19(6):1408–1416. doi: 10.1007/s00330-008-1282-5. [DOI] [PubMed] [Google Scholar]
- Rodt T, Ratiu P, Becker H, Bartling S, Kacher DF, Anderson M, Jolesz FA, Kikinis R. 3D visualisation of the middle ear and adjacent structures using reconstructed multi-slice CT datasets, correlating 3D images and virtual endoscopy to the 2D cross-sectional images. Neuroradiology. 2002;44(9):783–790. doi: 10.1007/s00234-002-0784-0. [DOI] [PubMed] [Google Scholar]
- Salisbury K, Tarr C. Haptic rendering of surfaces defined by implicit functions. Symposium on Haptic Interfaces for Virtual Environment and Teleoperator Systems. 1997;61:68. [Google Scholar]
- Seemann MD, Seemann O, Bonél H, Suckfüll M, Englmeier KH, Naumann A, Allen CM, Reiser MF. Evaluation of the middle and inner ear structures: comparison of hybrid rendering, virtual endoscopy and axial 2D source images. Eur Radiol. 1999;9(9):1851–1858. doi: 10.1007/s003300050934. [DOI] [PubMed] [Google Scholar]
- Sim JH, Puria S, Steele CR. Calculation of inertia properties of the malleusincus complex using micro-CT imaging. J Mech Mater Struct. 2007;2(8):1515–1524. [Google Scholar]
- Sim JH, Puria S. Soft tissue morphometry of the malleus-incus complex from micro-CT imaging. J Assoc Res Otolaryngol. 2008;9:5–21. doi: 10.1007/s10162-007-0103-x. [DOI] [PMC free article] [PubMed] [Google Scholar]
- Vrabec JT, Briggs RD, Rodriguez SC, Johnson RF., Jr Evaluation of the internal auditory canal with virtual endoscopy. Otolaryngol Head Neck Surg. 2002;127:145–152. doi: 10.1067/mhn.2002.127413. [DOI] [PubMed] [Google Scholar]
- Wang H, Merchant SN, Sorensen MS. A downloadable three-dimensional virtual model of the visible ear. Orl J Otorhinolaryngol Relat Spec. 2007;69(2):63–67. doi: 10.1159/000097369. [DOI] [PMC free article] [PubMed] [Google Scholar]


