

Abstract
The establishment of early life microbiota in the human infant gut is highly variable and plays a crucial role in host nutrient availability/uptake and maturation of immunity. Although high-performance mass spectrometry (MS)-based metaproteomics is a powerful method for the functional characterization of complex microbial communities, the acquisition of comprehensive metaproteomic information in human fecal samples is inhibited by the presence of abundant human proteins. To alleviate this restriction, we have designed a novel metaproteomic strategy based on double filtering (DF) the raw samples, a method that fractionates microbial from human cells to enhance microbial protein identification and characterization in complex fecal samples from healthy premature infants. This method dramatically improved the overall depth of infant gut proteome measurement, with an increase in the number of identified low-abundance proteins and a greater than 2-fold improvement in microbial protein identification and quantification. This enhancement of proteome measurement depth enabled a more extensive microbiome comparison between infants by not only increasing the confidence of identified microbial functional categories but also revealing previously undetected categories.
Keywords: Metaproteome, human infant gut, shotgun proteomics, double filtering
Introduction
Trillions of microbes, representing more than 1000 bacterial species-level phylotypes, colonize the adult human intestinal tract,1 generating a complex ecosystem that influences many aspects of human health and diseases.2−5 In particular, the gut microbiota plays a crucial role in protecting against pathogen invasion, processing nutrients, balancing energy, and regulating host immune responses.6−9 Microbial colonization in the gut is initiated immediately after birth and undergoes remarkable changes in composition and function over the first 2–3 years of life until a resilient, stable, adult-like microbiota is established.10,11 This early life microbiota development requires an intricate balance between microbial colonization and the corresponding responses of the human host intestinal environment.12 Distortions in the establishment of normal gut microbiota and commensal microbes increase the risk of inflammatory diseases, such as necrotizing enterocolitis (NEC), via disruption of the mucosal barrier and subsequent impairment of the immune system.13,14 Despite a lower complexity than that of adult microbiota, the gut microbial communities in infants are highly variable between individuals and may be influenced by a number of external factors, such as delivery mode, diet, and antibiotic use.15−17
Two recent studies based on metagenomic data from fecal samples from two healthy premature infants have detailed the microbial species/strains present as well as their relative abundances during the first month of life.18,19 Both genomic analyses revealed shifts in bacterial populations, identifying discrete compositional phases during infant gut colonization. Interestingly, the gut microbiota structure was drastically different between the two infants. Specifically, Citrobacter, Serratia, and Enterococcus species were dominant microbial members in one infant, whereas Enterococcus faecalis, Propionibacterium carrol, and four different Staphylococcus epidermidies strains were dominant in the second infant. Although metagenomic information alone highlights community variation and provides a list of all possible gene proteins, metaproteomics provides insight into real-time functional signatures, which helps to detail metabolic activity as well as host–microbe interaction during gut colonization.
Shotgun metaproteomics via two dimensional liquid chromatography coupled with nanospray tandem mass spectrometry (nano 2D LC–MS/MS) provides a powerful platform for the large-scale characterization of metaproteomes.20 Notwithstanding, the interrogation of the infant gut proteome is impeded by several major factors: (1) large diversity in gut microbial composition between individuals, (2) wide dynamic range of protein abundances, and (3) insufficient genome information/assembly. The advancement of high-performance mass spectrometry has greatly increased proteome coverage, including quantification,21 in complex samples, and the use of matched metagenomes enables more confident and accurate protein identification; coupled together, remarkable success has been demonstrated for a number of diverse and complex fecal samples.22−24
Our initial investigations to test metaproteomics for the characterization of premature infant gut microbiomes simultaneously monitored both microbial and human proteins over the first few weeks after birth. Intriguingly, the data showed dramatic variations in human to microbial protein ratios among various infants (Young and Hettich, unpublished results). In some cases, overwhelmingly abundant human host proteins greatly overshadowed the microbial microbiome, resulting in reduced depth of measurement into the microbial proteome. These highly abundant human proteins precluded the efficient mass spectrometric detection of medium-to-low-abundance microbial peptides. In particular, microbial peptides co-eluting near dominant human peptides experience ion suppression and are thus more difficult to measure. Furthermore, the reduced detection and subsequent identification of those peptides lowers not only the number of proteins identified but also the number of unique peptides. The lack of unique microbial peptides detected makes protein inference difficult, especially when considering closely related strains/species. These two issues thereby inhibit the complete characterization of diverse gut microbial communities and must be addressed. Although microbial cell enrichment in fecal samples by differential centrifugation has been previously reported,23,24 infant fecal samples are limited by the amount of raw material available, thus precluding the differential centrifugation approach and necessitating the development of alternative enrichment strategies.
The objective of this work was to develop and demonstrate the feasibility of an enhanced metaproteomic sample preparation strategy that provides more comprehensive interrogation into the infant gut microbiome by incorporating a double filtering (DF) separation step that selectively depletes human cells and proteins while enriching microbial biomass in the fecal sample. With the deployment of this DF method, we observed a significant increase in the number of microbial protein identifications at the deliberate expense of human proteins, which affords a more extensive characterization of microbial functionality in the infant gut without too much interference from high-abundance human proteins.
Materials and Methods
Sample Collection
Fecal samples from two premature infants (#UN1 and #CA1) were supplied by Dr. Michael Morowitz and stored at −80 °C. Samples were obtained under an IRB agreement protocol and were deidentified before sending to ORNL. A small portion of sample was excised and thawed prior to cell lysis and protein extraction.
Protein Extraction and Enzymatic Digestion
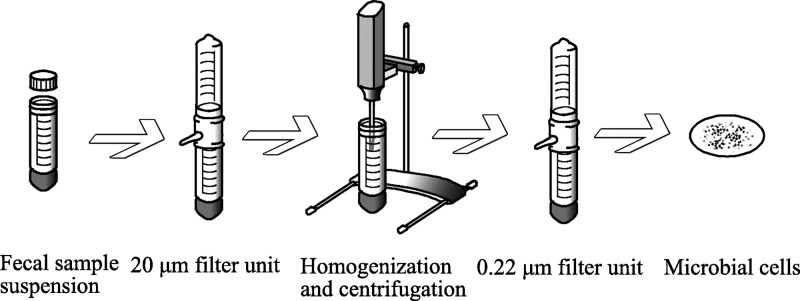
For each infant, approximately 0.5 g of raw fecal material was processed by two methods: a direct method and an indirect double filtering (DF) method. For the direct method, fecal material was boiled for 5 min in 1 mL of lysis buffer containing 100 mM Tris-HCl, pH 8.0, 4% w/v SDS (sodium dodecyl sulfate), and 10 mM dithiothreitol (DTT). The suspension was vortexed and sonicated with a Branson ultrasonic cell disruptor (20% amplitude for 2 min, 10 s pulse with 10 s rest). Crude protein extract was precleared via centrifugation at 21 000g for 10 min and quantified by the BCA assay (Pierce Biotechnology, Waltham, MA). An aliquot consisting of ∼1 mg of protein was collected and precipitated by 20% trichloroacetic acid (TCA) at −80 °C overnight. Protein pellets were washed with ice-cold acetone, resuspended in 8 M urea, 100 mM Tris-HCl, pH 8.0, and sonically disrupted in order to fully solubilize the protein pellet (20% amplitude for 5 min, 10 s pulse with 10 s rest). Denatured proteins were reduced with 5 mM DTT for 30 min. To block disulfide bond reformation, 20 mM iodoacetamide (IAA) was added to each sample; the reaction occurring in the dark at room temperature for 15 min. Samples were diluted to 4 M urea in 100 mM Tris-HCl, pH 8.0, and digested with one aliquot of sequencing grade trypsin (Promega, Madison, WI; 1:100 (w/w)) overnight at room temperature. Following digestion, samples were diluted to 2 M urea for a second digestion that lasted 4 h. Digested samples were then adjusted to 200 mM NaCl, 0.1% formic acid (FA) and filtered through a 10 kDa cutoff spin column filter (Vivaspin 2, GE Health, Pittsburgh, PA) to remove underdigested proteins. Peptides were quantified by the BCA assay and stored at −80 °C until use. For the indirect DF method, a differential filtering method was designed and optimized based on the knowledge that bacterial cells (0.2–2 μm in diameter) are typically much smaller than human cells (10–100 μm in diameter). In addition, bacterial cells usually contain chemically complex cell walls and therefore are more resistant to mechanical shear force, whereas human cells are much more susceptible and easier to lyse. Prior to the detergent-based cellular lysis and protein extraction described above, two different-size vacuum filter units were employed to physically separate human from microbial cells (Figure 1). Fecal samples (0.5 g) were suspended in 10 mL of ice-cold Tris-based saline (TBS) buffer and passed first through a 20 μm vacuum filter unit to remove larger fibrous material and intact human cells. The filtrate (including microbial cells, small human cells, secreted human and microbial proteins, and proteins from lysed cells) was homogenized using VDI 12 homogenizer (VWR, USA) at speed 6 (30 000 rpm, 30 s on, 30 s rest, 30 s on) to disrupt remaining intact human cells, followed by centrifugation (4000g, 10 min) to pellet intact bacterial cells. The collected pellet was resuspended in 10 mL of cold TBS and passed through a second 0.22 μm vacuum filter unit. This permitted human proteins to be washed through while microbial cells were captured on the filter. Captured cells were washed twice with cold TBS to remove attached human proteins and lysed by the SDS-based approach as described above. The entire filtering process was performed on ice and completed within 20 min to minimize proteomic perturbations during manipulation.
Figure 1.

Workflow of the indirect double filtering (DF) method. Fecal raw material is suspended in cold PBS and passed through a 20 μm filter to remove large particles and intact human cells. The filtrate is homogenized and centrifuged to obtain a microbial cell pellet. The pellet is resuspended and passed through a 0.22 μm filter to collect microbial cells on the filter membrane. Collected cells are washed twice and subjected to SDS-based cell lysis and protein purification.
Nano 2D LC–MS/MS Measurement
Proteolytic peptide samples were analyzed via an online nano 2D LC–MS/MS system interfaced with a hybrid LTQ-Orbitrap-Elite MS (ThermoFisher Scientific). A 30 μg aliquot of peptides was loaded onto a biphasic silica back-column packed with ∼4 cm strong cation exchange (SCX) followed by ∼4 cm reverse-phase (C18) material. Back-columns were washed offline with solvent A (95% HPLC grade water, 5% acetonitrile, 0.1% formic acid (FA)) for 20 min, followed by a 25 min gradient to solvent B (70% acetonitrile, 30% HPLC grade water, 0.1% FA). Each back-column was coupled in-line with an in-house pulled, reverse-phase (∼12 cm) packed nanospray emitter and analyzed by a three-step MudPIT (multidimensional protein identification technology), as described previously25 with the following modifications: total run consists of three salt pulses (10, 25, and 100% of 500 mM ammonium acetate) followed by 2 h organic gradient elutions for each step. Technical duplicates were performed for each sample. The LTQ-Orbitrap-Elite was operated in a data-dependent mode with each full scan (1 microscan) collected in the Orbitrap mass analyzer at 30 000 resolution, followed by collision-induced dissociation (35% energy) of the top 20 most abundant parent ions (1 microscan). Dynamic exclusion was enabled, with a mass exclusion width of 0.2 m/z and exclusion duration of 60 s.
Protein Database Construction and Searching
Due to the lack of a sample-specific metagenome-derived protein database for infant #UN1, a pseudometagenome was created by concatenating 21 microbial isolate reference genomes (acquired from JGI; representative organisms were chosen based on 16S rRNA information from another infant sample that was quite similar to this particular infant (Table S1)), human protein sequences (NCBI RefSeq_2011), and common contaminants (e.g., keratin and trypsin) into a single protein database (105 671 sequences). Although not metagenomically matched, this database provides complete genome sequences of presumably present microbial species, as indicated by 16S rRNA analysis. Conversely, a matched metagenome-derived protein database (60 073 sequences) for infant #CA1 was generated by combining metagenomic sequences19 collected on postnatal days 10, 16, 18, and 21 from the infant, along with human protein sequences and common contaminants. A decoy database consisting of reverse protein sequences was appended to the target database to calculate false discovery rates (FDR). All MS/MS spectra were searched with the Myrimatch v2.1 algorithm26 against the appropriate database with the following configuration parameters: fully tryptic peptides with any number of miscleavages, an average precursor mass tolerance of 1.5 m/z, a mono precursor mass tolerance of 10 ppm, a fragment mass tolerance of 0.5 m/z, a static cysteine modification (+57.02 Da), an N-terminal dynamic carbamylation modification (+43.00 Da), and a dynamic oxidation modification (+15.99 Da). Peptides identifications were filtered with IDPicker v3.027 to <1% peptide FDR (at the peptide level: maximum Q value <2%, minimum one spectra per peptide, and minimum one spectra per match; at the protein level: minimum two distinct peptides, minimum zero additional peptide, and minimum two spectra per protein).
Protein Inference and Semiquantification
Due to the high degree of sequence homology and redundancy in the human RefSeq database as well as homologous proteins from different microbial species, peptides that map to multiple proteins increase the ambiguity within protein identifications and quantification. To avoid under- and overcounting protein identifications, the pseudo-predicted protein database for infant #UN1 was clustered on the basis of 90% amino acid sequence similarity using USEARCH v5.0 software,28 as described previously.29 This was done post database search and is essentially a reassessment of uniqueness based on the very conservative sequence identity of 90–100%. Considering the lower level of homologous protein overlap within the constructed matched metagenome for infant #CA1, microbial proteins in the database were clustered into a group if they share 100% amino acid sequence identity (which would otherwise prevent proteomic identification based on the commonly used unique peptide criterion), and human proteins were clustered on the basis of 90% amino acid sequence similarity. Spectral counts were balanced between shared proteins and normalized by total numbers of collected MS/MS of this run, as previously described.29 Data were plotted with OriginPro 8.1 graphing software (OriginLab Corporation, Northampton, MA).
Clusters of Orthologous Groups (COGs) Assignment
Protein sequences were searched against the COG database from NCBI using rpsblast,30 and the top hit was assigned with an e-value threshold of 0.00001. Assigned COGs were grouped into COG functional categories to predict functions in the gut microbiome. Abundance of each category was determined by summing normalized spectral counts of all COGs in the category.
Results and Discussions
An Enhanced Strategy for Infant Fecal Proteomics To Improve the Overall Depth of Proteome Measurement
To determine the feasibility and robustness of our enhanced approach for diverse samples, we selected fecal samples from two healthy premature infants (#UN1 and #CA1) that differed by human protein composition (as evident from the direct measurement method) and matched metagenome availability (see database construction in Methods and Materials for details in this study). To assess the sample preparation reproducibility and range of this method, we initially conducted replicate sample preparation processing (complete protocol) and MS measurements on an independent third preterm infant fecal sample. The overall correlation was high (R2 = 0.85; Figure S1), verifying that the sample preparation approach was robust and reproducible. Technical replicates were performed for each fecal sample and were found to be highly reproducible (R2 > 0.95) (Figure S2), which attests to the precision of the MS measurements as well as the enhanced search approach relative to that of previous methods.31
The results of protein group identifications and spectra assignments for premature infants #UN1 and #CA1 are summarized in Tables 1 and S2. All identified protein groups from each run are reported in Table S3. The task of mapping peptides to proteins for metaproteomic investigation is challenging in that peptides can be shared by multiple proteins in a reference database, which results from homologous proteins among closely related organisms and/or sequence redundancies within large databases. These shared peptides are common in infant gut databases and lead to ambiguous protein assembly, especially relative to more routine microbial isolate measurements. Previous studies proposed an effective way to deal with shared peptides by clustering proteins into groups using an algorithm based on sequence homology.29 This protein grouping approach affords distinct advantages in data interpretation, as proteins sharing high similarity are likely to exhibit similar biological functions, allowing for a more robust interrogation of functional activities in complex communities such as the infant gut. On the basis of this approach, a total of 807 or 1264 (for infant #UN1) and 342 or 1012 (for infant #CA1) protein groups (nonredundant protein groups from duplicates) were generated using the direct and indirect DF methods, respectively (FDR rate < 1% at the peptide level, Table 1).
Table 1. Overview of Proteomic Results from Two Fecal Microbiomes Measured by the Direct and Indirect DF Methods.
| infant
#UN1 |
infant #CA1 |
|||||||
|---|---|---|---|---|---|---|---|---|
| run | direct run 1 | direct run 2 | indirect DF run 1 | indirect DF run 2 | direct run 1 | direct run 2 | indirect DF run 1 | indirect DF run 2 |
| spectral counts | 40 495 | 39 432 | 42 485 | 42 544 | 40 068 | 41 492 | 45 484 | 47 221 |
| peptide counts | 4156 | 4672 | 6688 | 6799 | 1968 | 1905 | 4475 | 4238 |
| protein counts | 2215 | 2465 | 3534 | 3697 | 691 | 542 | 1200 | 1182 |
| protein group counts | 655 | 734 | 1076 | 1122 | 304 | 289 | 855 | 854 |
Having established the criteria for protein identifications, we sought to assess the overall depth of proteome coverage by this enhanced strategy. Indeed, our approach facilitated a noticeable increase in the number of overall spectra assignments and greater than 50% peptide and protein group identifications for both infant fecal microbiomes compared with the measurement using the direct approach (Table 1). Notably, greater improvements were observed for infant #CA1 relative to that for infant #UN1. This may be due to a more representative database constructed from matched metagenome of infant #CA1, providing a more complete protein inventory and thus more confident protein identifications, but it is more likely that the increase resulted from greater removal of human proteins, as #CA1 contained a higher abundance of human proteins (Table S2). Because the measurement of complex protein mixtures is often biased toward high-abundance proteins, which generate an excess of proteolytic peptides that often occupy long periods of chromatographic space and limit the dynamic range of the measurement by precluding sampling (and identification) of co-eluting, lower-abundance microbial proteins, a larger initial complement of human cells in #CA1 would have been affected more by the indirect DF method. Once abundant proteins were removed with DF, we were able to dramatically increase identifications for those previously unmeasured microbial proteins. In fact, we observed differences in the protein abundance profiles between the two methods for both infants, with specific increases in the number low-abundance proteins groups (less than 100 spectral counts; Figure 2). As a result, we achieved a deeper proteome characterization, primarily in the microbial membership.
Figure 2.
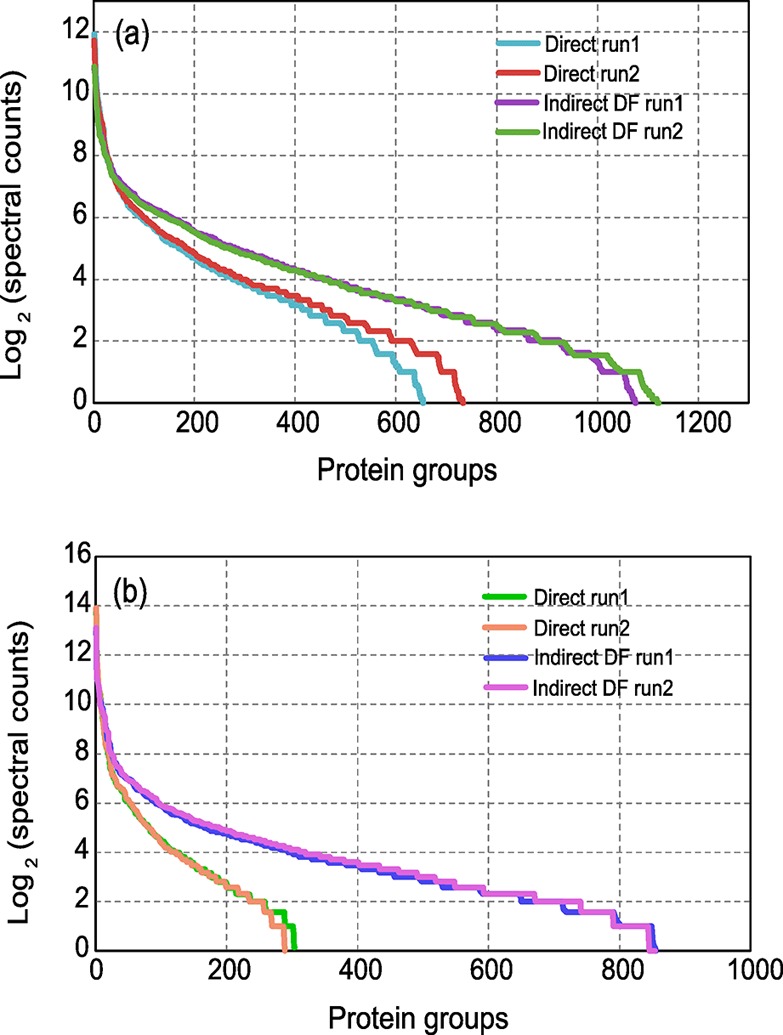
Rank–abundance plots of protein groups. Identified proteins are clustered into protein groups, and their spectral counts are balanced and normalized according to the approach specified in the Materials and Methods. Protein groups of (a) infant #UN1 and (b) infant #CA1 are ranked and plotted based on spectral counts. The indirect DF method facilitates an increasing number of identified protein groups. The two methods possess the same slope for top ranked groups but diverge at the group with fewer than 100 spectral counts. The indirect DF method has a shallower slope and thus provides more low-abundance protein group identifications.
Microbial Protein Group Identifications Are Enriched by Depletion of Abundant Human Proteins
The success in achieving accurate protein identifications and deep proteome coverage in a complex community relies on the quality of a predicted protein sequence database that is constructed from metagenomic data. Compared to the analysis of a single cell type/microbial isolate, a larger portion of high-quality spectra in a metaproteomic study remain unassigned due to the incompleteness of the proteomic database. To quantify this, we employed a spectral quality assessment tool, ScanRanker,32 to assign scores for all of the collected spectra to evaluate the quality of the database (Table S4). Using ScanRanker scores, a distribution of total collected spectra including unassigned, assigned human, and assigned microbial spectra was plotted for each infant, as measured by both methods (Figure 3). For each distribution, a total of ∼280 000 spectra were represented, as measured in duplicate runs, and ∼15% of those with scores below −0.6 were recognized as peptide identifications, implying that lower-quality spectra reside at the lower end of the distribution. Although somewhat variable for microbial isolates, we typically note that ∼60% of collected mass spectra can be assigned to peptides for an organism with a completely sequenced genome (without accounting from PTMs, sequence variants, and other unknown contaminants, of course). However, due to the increased complexity of these samples, as well as the fact that the metagenomic databases used here are incomplete, approximately 27 and 29% of total collected spectra were assigned for infant #UN1 and infant #CA1, respectively, using the direct approach (Figure 3a,b), whereas slightly higher percentages of 30 and 33% were achieved via the indirect DF approach (Figure 3c,d). Despite having a similar spectral assignment efficiency, one readily observable difference between the two infants is the ratio of human versus microbial assigned spectra. For infant #UN1, the microbial peptide spectral matches (PSMs) accounted for 40% of the total assigned spectra with the direct method (Figure 3a), whereas for infant #CA1, this value was much lower (∼4%). Consequently, this suppression of microbe-derived PSMs by the presence of abundant human proteins severely impedes the interrogation of microbial functional activities in the gut, especially when considering semiquantitation (Figure 3b). Therefore, it is a challenge to investigate the interindividual variability through the direct approach given the relative dearth of microbial PSMs. However, compared to the direct method, our DF strategy substantially increased microbial PSM proportions within total assigned spectra, from 40 to 93% for infant #UN1 and from 4 to 48% for infant #CA1 (Figure 3 and Table S2).
Figure 3.

Distributions of ScanRanker scores for collected mass spectra. ScanRanker scores are used to assess spectral quality for all collected mass spectra. Stack histograms are generated for ScanRanker scores of (a) infant #UN1 measured by the direct method, (b) infant #CA1 by the direct method, (c) infant #UN1 by the indirect DF method, and (d) infant #CA1 by the indirect DF method. The color denotes ScanRanker score distributions of unassigned (gray), assigned human (red), and assigned microbial (green) mass spectra in replicates. The indirect DF method enriches microbial mass spectra assignment as decreasing human mass spectra assignment.
Although it depends on the experimental question being asked, the ultimate goal here was to remove abundant human proteins and peptides in order to enhance microbial protein identification depth, a process that would undoubtedly facilitate functional characterization at the microbial level. Using infant #UN1 as a test case, we found that 593 protein groups overlap between the two methods, with 214 protein groups uniquely identified by the direct method and 671 protein groups uniquely identified by the indirect DF method (Figure 4a). We next evaluated Venn groupings at the PSM level, specifically on the PSM partitioning between organisms (i.e., human-derived PSMs vs microbial-derived PSMs). In this case, spectral counts were averaged between replicates. Considering protein groups specific to either method, more unique human protein groups (155 out of 214) were found by the direct method, whereas more unique microbial protein groups (649 out of 671) were detected in the indirect DF method. Of those commonly identified between the two methods, DF led to the identification of substantially more microbial PSMs. Collectively, our enhanced approach facilitated a 2-fold increase in the number of identified microbial protein groups and a 2.4-fold increase in the microbial spectral counts. Taken together, these observations indicate that improving the overall protein/peptide identification rate/sampling depth of the microbial complement of a fecal sample was attributed to the significant depletion of human proteins. Similar analyses of infant #CA1 further validated the enrichment of microbial protein groups (Figure S3a).
Figure 4.

Comparison of protein group identification and quantification results by two methods. The Venn diagram (a) shows unique and overlapped protein group identifications of infant #UN1 between the direct and indirect DF methods. Bar charts indicated human (red) versus microbial (green) protein group counts and spectral counts in the part of uniquely identified by the direct method (left), commonly identified (bottom), and uniquely identified by the indirect DF method (right). Scatter plots are constructed using log2 spectral counts of microbial protein groups measured by two methods for infant #UN1 (b, rs = 0.76) and infant #CA1 (c, rs = 0.77). Solid line indicates a perfect correlation, and the dashed line indicates the offset owing to microbial protein enrichment. Microbial protein groups are enriched with a relatively high ranked correlation.
We also examined the identification reproducibility and quantification consistency of the two methods regarding microbial protein groups. Over 90% of microbial protein groups identified by the direct method were also identified by the indirect DF method (Figure S3b,c). There was a high rank correlation (rs = 0.76 for infant #UN1; rs = 0.77 for infant #CA1) of log2 spectral counts between the two methods, with the correlation offset likely due to microbial protein enrichment (Figure 4b,c). These results demonstrate that increases in microbial PSM rate through the DF method does not bias the sample but instead provides more confidence for microbial protein quantifications through selective enrichment.
Enriched Microbial Protein Identifications Facilitate More Comprehensive Information for Microbial Functional Categorization
To further elucidate the advantages of the DF sample preparation approach, we tabulated and analyzed the COG functions for the two infant gut microbiomes measured by these two methods (Table S5). We clearly recognize that COG families are relatively broad and characterize the functionality at a lower resolution than a more specific, detailed metabolic pathway analysis. Nevertheless, they were used here to provide only a general metric for the power of the microbial protein enriching approach and not necessarily to assess biological differences between the two infants. For both infants, we found several highly represented COG categories, including carbohydrate transport and metabolism; energy production and conversion; translation, ribosomal structure, and biogenesis; post-translational modification, protein turnover, chaperones; and amino acid transport and metabolism (Figure 5). A similar distribution of COG functions was reported for a healthy adult twin pair.24 These results suggest that the establishment of microbial communities in these two infants gut environments is fairly quickly migrating toward a relatively stable and adult-like microbiota, which plays a crucial role in carbohydrate metabolism and nutrient production.
Figure 5.

COG category analysis of microbial protein groups. Microbial protein groups are assigned into COG categories via rpsblast against the COG database from NCBI. Distributions of identified categories were constructed by category counts and spectra of infant #UN1 (a) and infant #CA1 (b). Abundant categories are numerically labeled.
An in-depth inquiry into infant gut microbiota establishment during early life, as well as identifying the relationship between microbiota and inflammatory disorders, requires delineation of the full range of microbial functions, especially those that are seemingly of low abundance. For infant #UN1, human proteins were only moderately abundant, and so the enrichment of microbial proteins did not change the overall pattern of COG categories but allowed both more confident protein identifications as well as an order of magnitude deeper spectra assignment for each functional category. This enhancement provided deeper protein signatures with better statistics and better coverage of specific cellular pathways. However, for infant #CA1, human peptides dominated the identifications, leading to suboptimal microbial protein binning into COG categories for the direct method. Conversely, employing the DF strategy allowed us to significantly improve the resolution of microbial functional category determination/assignment, resulting in newly identified categories of cell wall/membrane/envelope biogenesis; coenzyme transport and metabolism; intracellular trafficking secretion and vesicular transport; nucleotide transport and metabolism; replication, recombination, and repair; and signal transduction mechanisms. On the basis of the indirect DF approach, the microbiota of two infants intriguingly shared similar COG function profiles despite tremendous taxonomic diversity, suggesting functional redundancy in the early intestinal ecosystem. Clearly, this approach sets the stage for more detailed time-course measurements and expanded gene ontology/metabolic mapping analyses that should provide a higher-resolution delineation of microbiome development/stabilization/functional activities during early infant life.
Conclusions
In this study, we report a novel metaproteomic method for extensively interrogating the infant gut microbiome. By performing a double filtering strategy on the raw samples, we successfully enriched relatively low-abundance microbial proteins from complex fecal samples containing dominant human host proteins while preserving the relative distribution of protein abundances in each sample. This provided an in-depth microbial metaproteome measurement with a greater than 2-fold increase in microbial protein identification and quantification with a relatively high correlated quantification, which improved our ability to confidently and comprehensively characterize microbial functional categories for a complicated gut metaproteome. Moreover, although the supernatant and filtrate generated by this approach were not examined in this study, these samples could be useful for future analyses that focus on the human proteome and host responses to the gut microbiome.
Acknowledgments
We thank Paul Abraham for technical advice and manuscript review. Stipend support for W.X. was provided by the University of Tennessee–Knoxville Genome Science and Technology Program. Research support for the technical project was provided by NIH grant 1R01-GM-103600. Oak Ridge National Laboratory is managed by UT-Battelle, LLC, for the U.S. Department of Energy.
Supporting Information Available
Figure S1: Reproducibility of methodological (sample preparation) replicates. An infant fecal sample was processed twice and measured in duplicate across two 24 h MudPIT runs. A scatterplot was generated using log2 spectral counts of protein groups in duplicate runs (R2 = 0.85). Dashed line indicates a perfect 1:1 correlation. Figure S2: Protein group quantification reproducibility. Scatter plots are constructed using log2 spectral counts of protein groups measured in duplicate runs of infant #UN1 by the direct (a, R2 = 0.95) and indirect DF (b, R2 = 0.95) methods and of infant #CA1 by the direct (c, R2 = 0.98) and indirect DF (d, R2 = 0.94) methods. Dashed line indicates a perfect correlation. Figure S3: Microbial protein group identification. The Venn diagram (a) shows unique and overlapped protein group identifications of infant #CA1 between the direct and indirect DF methods. Bar charts indicate human (red) versus microbial (green) protein group counts and spectral counts in the part uniquely identified by the direct method (left), commonly identified (bottom), and uniquely identified by the indirect DF method (right). The Venn diagrams (b, infant #UN1) and (c, infant #CA1) show the overlap of microbial protein group identifications of two infants between two methods. Over 90% of microbial protein groups in the direct method are identified by the indirect DF method. Table S1: Twenty one microbial isolate reference genome database. Table S2: Collected and assigned mass spectra results. Table S3: Protein groups IDs and spectral counts identified from each run. Table S4: ScanRanker socres of all collected spectra (including unassigned, assigned human, and assigned microbial spectra) from each run. Table S5: COG category assignment of microbial protein groups. This material is available free of charge via the Internet at http://pubs.acs.org.
The authors declare no competing financial interest.
Funding Statement
National Institutes of Health, United States
Supplementary Material
References
- Lozupone C. A.; Stombaugh J. I.; Gordon J. I.; Jansson J. K.; Knight R. Diversity, stability and resilience of the human gut microbiota. Nature 2012, 489, 220–30. [DOI] [PMC free article] [PubMed] [Google Scholar]
- Clemente J. C.; Ursell L. K.; Parfrey L. W.; Knight R. The impact of the gut microbiota on human health: an integrative view. Cell 2012, 148, 1258–70. [DOI] [PMC free article] [PubMed] [Google Scholar]
- Nell S.; Suerbaum S.; Josenhans C. The impact of the microbiota on the pathogenesis of IBD: lessons from mouse infection models. Nat. Rev. Microbiol. 2010, 8, 564–77. [DOI] [PubMed] [Google Scholar]
- Sanz Y.; Santacruz A.; Gauffin P. Gut microbiota in obesity and metabolic disorders. Proc. Nutr. Soc. 2010, 69, 434–41. [DOI] [PubMed] [Google Scholar]
- Berer K.; Mues M.; Koutrolos M.; Rasbi Z. A.; Boziki M.; Johner C.; Wekerle H.; Krishnamoorthy G. Commensal microbiota and myelin autoantigen cooperate to trigger autoimmune demyelination. Nature 2011, 479, 538–41. [DOI] [PubMed] [Google Scholar]
- Tremaroli V.; Backhed F. Functional interactions between the gut microbiota and host metabolism. Nature 2012, 489, 242–9. [DOI] [PubMed] [Google Scholar]
- Nicholson J. K.; Holmes E.; Kinross J.; Burcelin R.; Gibson G.; Jia W.; Pettersson S. Host–gut microbiota metabolic interactions. Science 2012, 336, 1262–7. [DOI] [PubMed] [Google Scholar]
- Round J. L.; Mazmanian S. K. The gut microbiota shapes intestinal immune responses during health and disease. Nat. Rev. Immunol. 2009, 9, 313–23. [DOI] [PMC free article] [PubMed] [Google Scholar]
- Kau A. L.; Ahern P. P.; Griffin N. W.; Goodman A. L.; Gordon J. I. Human nutrition, the gut microbiome and the immune system. Nature 2011, 474, 327–36. [DOI] [PMC free article] [PubMed] [Google Scholar]
- Matamoros S.; Gras-Leguen C.; Le Vacon F.; Potel G.; de La Cochetiere M. F. Development of intestinal microbiota in infants and its impact on health. Trends Microbiol. 2013, 21, 167–73. [DOI] [PubMed] [Google Scholar]
- Trosvik P.; Stenseth N. C.; Rudi K. Convergent temporal dynamics of the human infant gut microbiota. ISME J. 2010, 4, 151–8. [DOI] [PubMed] [Google Scholar]
- Salzman N. H. Microbiota–immune system interaction: an uneasy alliance. Curr. Opin. Microbiol. 2011, 14, 99–105. [DOI] [PMC free article] [PubMed] [Google Scholar]
- Morowitz M. J.; Poroyko V.; Caplan M.; Alverdy J.; Liu D. C. Redefining the role of intestinal microbes in the pathogenesis of necrotizing enterocolitis. Pediatrics 2010, 125, 777–85. [DOI] [PubMed] [Google Scholar]
- Cilieborg M. S.; Boye M.; Sangild P. T. Bacterial colonization and gut development in preterm neonates. Early Hum. Dev. 2012, 88, S41–9. [DOI] [PubMed] [Google Scholar]
- Dominguez-Bello M. G.; Costello E. K.; Contreras M.; Magris M.; Hidalgo G.; Fierer N.; Knight R. Delivery mode shapes the acquisition and structure of the initial microbiota across multiple body habitats in newborns. Proc. Natl. Acad. Sci. U.S.A. 2010, 107, 11971–5. [DOI] [PMC free article] [PubMed] [Google Scholar]
- Zeissig S.; Blumberg R. S. Life at the beginning: perturbation of the microbiota by antibiotics in early life and its role in health and disease. Nat. Immunol. 2014, 15, 307–10. [DOI] [PubMed] [Google Scholar]
- De Filippo C.; Cavalieri D.; Di Paola M.; Ramazzotti M.; Poullet J. B.; Massart S.; Collini S.; Pieraccini G.; Lionetti P. Impact of diet in shaping gut microbiota revealed by a comparative study in children from Europe and rural Africa. Proc. Natl. Acad. Sci. U.S.A. 2010, 107, 14691–6. [DOI] [PMC free article] [PubMed] [Google Scholar]
- Morowitz M. J.; Denef V. J.; Costello E. K.; Thomas B. C.; Poroyko V.; Relman D. A.; Banfield J. F. Strain-resolved community genomic analysis of gut microbial colonization in a premature infant. Proc. Natl. Acad. Sci. U.S.A. 2011, 108, 1128–33. [DOI] [PMC free article] [PubMed] [Google Scholar]
- Sharon I.; Morowitz M. J.; Thomas B. C.; Costello E. K.; Relman D. A.; Banfield J. F. Time series community genomics analysis reveals rapid shifts in bacterial species, strains, and phage during infant gut colonization. Genome Res. 2012, 23, 111–20. [DOI] [PMC free article] [PubMed] [Google Scholar]
- Hettich R. L.; Pan C.; Chourey K.; Giannone R. J. Metaproteomics: harnessing the power of high performance mass spectrometry to identify the suite of proteins that control metabolic activities in microbial communities. Anal. Chem. 2013, 85, 4203–14. [DOI] [PMC free article] [PubMed] [Google Scholar]
- Li Z.; Adams R. M.; Chourey K.; Hurst G. B.; Hettich R. L.; Pan C. Systematic comparison of label-free, metabolic labeling, and isobaric chemical labeling for quantitative proteomics on LTQ Orbitrap Velos. J. Proteome Res. 2012, 11, 1582–90. [DOI] [PubMed] [Google Scholar]
- Hettich R. L.; Sharma R.; Chourey K.; Giannone R. J. Microbial metaproteomics: identifying the repertoire of proteins that microorganisms use to compete and cooperate in complex environmental communities. Curr. Opin. Microbiol. 2012, 15, 373–80. [DOI] [PubMed] [Google Scholar]
- Erickson A. R.; Cantarel B. L.; Lamendella R.; Darzi Y.; Mongodin E. F.; Pan C.; Shah M.; Halfvarson J.; Tysk C.; Henrissat B.; Raes J.; Verberkmoes N. C.; Fraser C. M.; Hettich R. L.; Jansson J. K. Integrated metagenomics/metaproteomics reveals human host-microbiota signatures of Crohn’s disease. PloS one 2012, 7, e49138. [DOI] [PMC free article] [PubMed] [Google Scholar]
- Verberkmoes N. C.; Russell A. L.; Shah M.; Godzik A.; Rosenquist M.; Halfvarson J.; Lefsrud M. G.; Apajalahti J.; Tysk C.; Hettich R. L.; Jansson J. K. Shotgun metaproteomics of the human distal gut microbiota. ISME J. 2009, 3, 179–89. [DOI] [PubMed] [Google Scholar]
- Lochner A.; Giannone R. J.; Keller M.; Antranikian G.; Graham D. E.; Hettich R. L. Label-free quantitative proteomics for the extremely thermophilic bacterium Caldicellulosiruptor obsidiansis reveal distinct abundance patterns upon growth on cellobiose, crystalline cellulose, and switchgrass. J. Proteome Res. 2011, 10, 5302–14. [DOI] [PubMed] [Google Scholar]
- Tabb D. L.; Fernando C. G.; Chambers M. C. MyriMatch: highly accurate tandem mass spectral peptide identification by multivariate hypergeometric analysis. J. Proteome Res. 2007, 6, 654–61. [DOI] [PMC free article] [PubMed] [Google Scholar]
- Ma Z. Q.; Dasari S.; Chambers M. C.; Litton M. D.; Sobecki S. M.; Zimmerman L. J.; Halvey P. J.; Schilling B.; Drake P. M.; Gibson B. W.; Tabb D. L. IDPicker 2.0: improved protein assembly with high discrimination peptide identification filtering. J. Proteome Res. 2009, 8, 3872–81. [DOI] [PMC free article] [PubMed] [Google Scholar]
- Edgar R. C. Search and clustering orders of magnitude faster than BLAST. Bioinformatics 2010, 26, 2460–1. [DOI] [PubMed] [Google Scholar]
- Abraham P.; Adams R.; Giannone R. J.; Kalluri U.; Ranjan P.; Erickson B.; Shah M.; Tuskan G. A.; Hettich R. L. Defining the boundaries and characterizing the landscape of functional genome expression in vascular tissues of Populus using shotgun proteomics. J. Proteome Res. 2012, 11, 449–60. [DOI] [PubMed] [Google Scholar]
- Wu S.; Zhu Z.; Fu L.; Niu B.; Li W. WebMGA: a customizable web server for fast metagenomic sequence analysis. BMC Genomics 2011, 12, 444. [DOI] [PMC free article] [PubMed] [Google Scholar]
- Razumovskaya J.; Olman V.; Xu D.; Uberbacher E. C.; VerBerkmoes N. C.; Hettich R. L.; Xu Y. A computational method for assessing peptide-identification reliability in tandem mass spectrometry analysis with SEQUEST. Proteomics 2004, 4, 961–9. [DOI] [PubMed] [Google Scholar]
- Ma Z. Q.; Chambers M. C.; Ham A. J.; Cheek K. L.; Whitwell C. W.; Aerni H. R.; Schilling B.; Miller A. W.; Caprioli R. M.; Tabb D. L. ScanRanker: quality assessment of tandem mass spectra via sequence tagging. J. Proteome Res. 2011, 10, 2896–904. [DOI] [PMC free article] [PubMed] [Google Scholar]
Associated Data
This section collects any data citations, data availability statements, or supplementary materials included in this article.