Abstract
We conducted a detailed kinetic study of the reaction of the vitamin B12 analog diaquacobinamide ((H2O)2Cbi(III)) with hydrogen sulfide in water from pH 3 to 11. The reaction proceeds in three steps: (i) formation of three different complexes between cobinamide and hydrogen sulfide, viz. (HO−)(HS−)Cbi(III), (H2O)(HS−)Cbi(III), and (HS−)2Cbi(III); (ii) inner-sphere electron transfer (ISET) in the two complexes with one coordinated HS− to form the reduced cobinamide complex [(H)S]Cbi(II); and (iii) addition of a second molecule of hydrogen sulfide to the reduced cobinamide. ISET does not proceed in the (HS−)2Cbi(III) complex. The final products of the reaction between cobinamide and hydrogen sulfide were found to be independent of pH, with the main product being a complex of cobinamide(II) with the anion-radical SSH2−.
Keywords: Kinetics, Reaction mechanisms, Redox chemistry, Hydrogen sulfide, Cobinamide
Introduction
Hydrogen sulfide is a colorless gas with the smell of rotten eggs. It is highly toxic and can cause death within minutes. Workers in a variety of industries, including oil and gas production and water reclamation are exposed to hydrogen sulfide, and deaths from gas exposure are a significant occupational hazard. Moreover, inhalation of hydrogen sulfide gas has become a common mode of suicide, and the gas could be used as a weapon of mass destruction. No specific therapy is currently approved for hydrogen sulfide exposure, although some animal experiments and antidotal human cases suggest that the two cyanide antidotes hydroxocobalamin and sodium nitrite may be effective in treating sulfide poisoning[1,2,3].
The other cyanide antidote - diaquacobinamide ((H2O)2Cbi(III)) differs from the corresponding aquacobalamin by the absence of the dimethylbenzimidazole axial ligand.[4] This imparts three major chemical differences. First, cobinamide has a higher binding affinity for ligands due to removal of the negative trans effect of the dimethylbenzimidazole group. Second, cobinamide can bind two ligands, instead of only one. And third, cobinamide more easily undergoes redox reactions. Because of its high affinity for ligands and binding of two ligands, one would expect cobinamide to scavenge toxic chemicals more effectively than cobalamin, and we have strong evidence from several animal species that cobinamide is a much better cyanide antidote than aquacobalalmin[5]. Given that aquacobalamin has some beneficial effect in animal models of hydrogen sulfide poisoning[2], we reasoned that diaquacobinamide should also function as a hydrogen sulfide antidote.
In this paper we are presenting the kinetic data for the reaction between hydrogen sulfide and diaquacobinamide. These results are compared with the recently published data for corresponding reaction of cobalamin[6].
Results and Discussion
Spectroscopic studies
Adding excess hydrogen sulfide to a cobinamide (Cbi(III)) solution rapidly changed the solution’s color from red to yellow in the pH range 1 to 12 (Figure S1 (a, b)). Spectral analyses showed three consecutive changes at рН 9.6, all of which happened quickly.
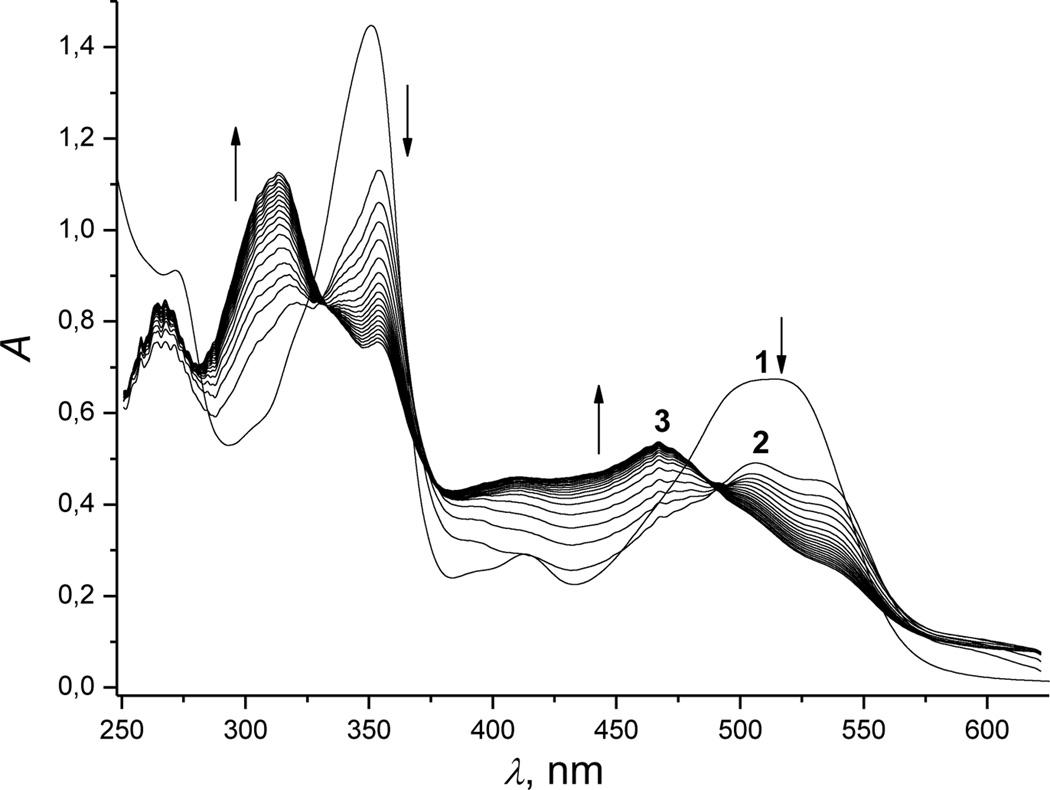
The first change depends on the initial hydrogen sulfide concentration. At low concentrations (<5 mm), absorbance at 350 and 520 nm decreased (Figure 1, spectrum 1 was recorded before mixing Cbi with H2S), and absorbance at 354, 506 and 533 nm increased (Figure 1, spectrum 2). These changes were accompanied by isosbestic points at 328, 361, 449 and 540 nm (Figure S2, spectrum 2, Supporting Information). At high hydrogen sulfide concentrations (>10 mm), other bands for the first intermediate occurred at 316, 355, 550 and 590 nm, and isosbestic points occurred at 333, 361, 449 and 540 nm (Figure S2, spectrum 3).
Figure 1.
UV-Vis spectral changes recorded during reduction of Cbi(III) by hydrogen sulfide. Experimental conditions: [Cbi(III)]total = 6 × 10⁻⁵ m; [H2S]total = 1 mm; pH 9.6; 298 K; anaerobic conditions. Spectra were recorded at a cycle time of 0.015 s.
In the second step, absorbance maxima appeared at 314 and 468 nm (Figure 1, spectrum 3), and isosbestic points occured at 330, 370 and 493 nm (for low hydrogen sulfide concentrations, <5 mM) and 400 and 507 nm (for high hydrogen sulfide concentrations, >10 mM) [Figure S3 (a and b), Supporting Information].
In the third step, decreased absorbance occurred at all wavelengths (see Figure S4, Supporting Information).
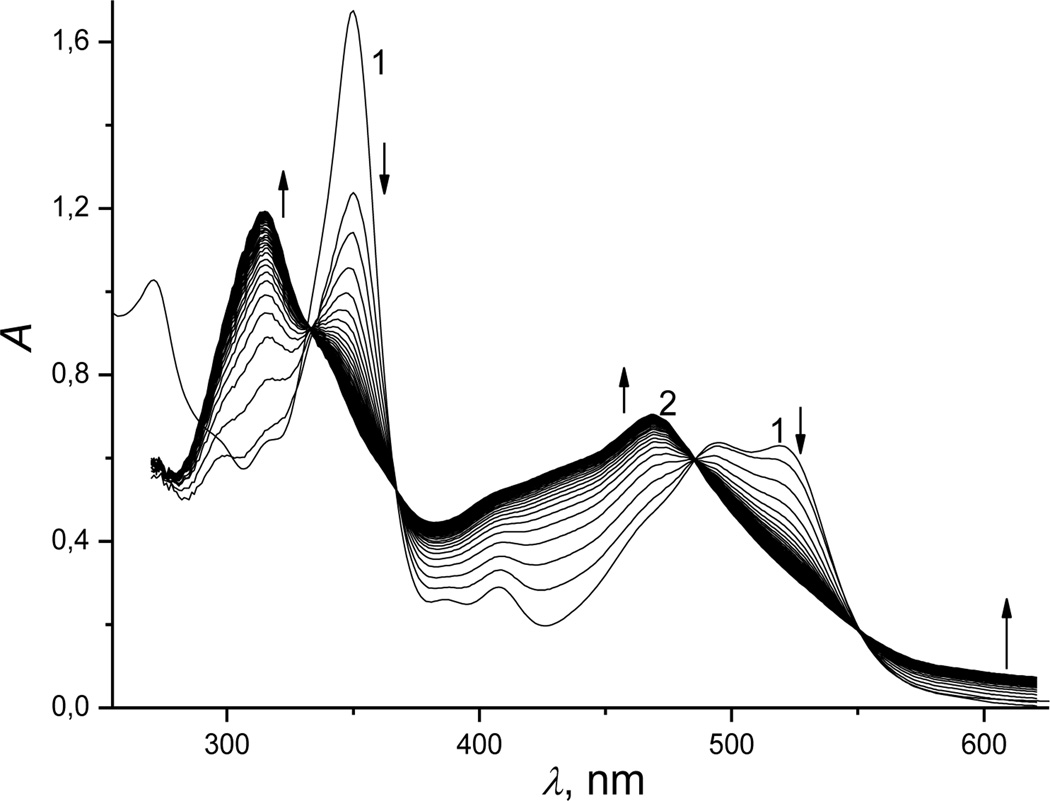
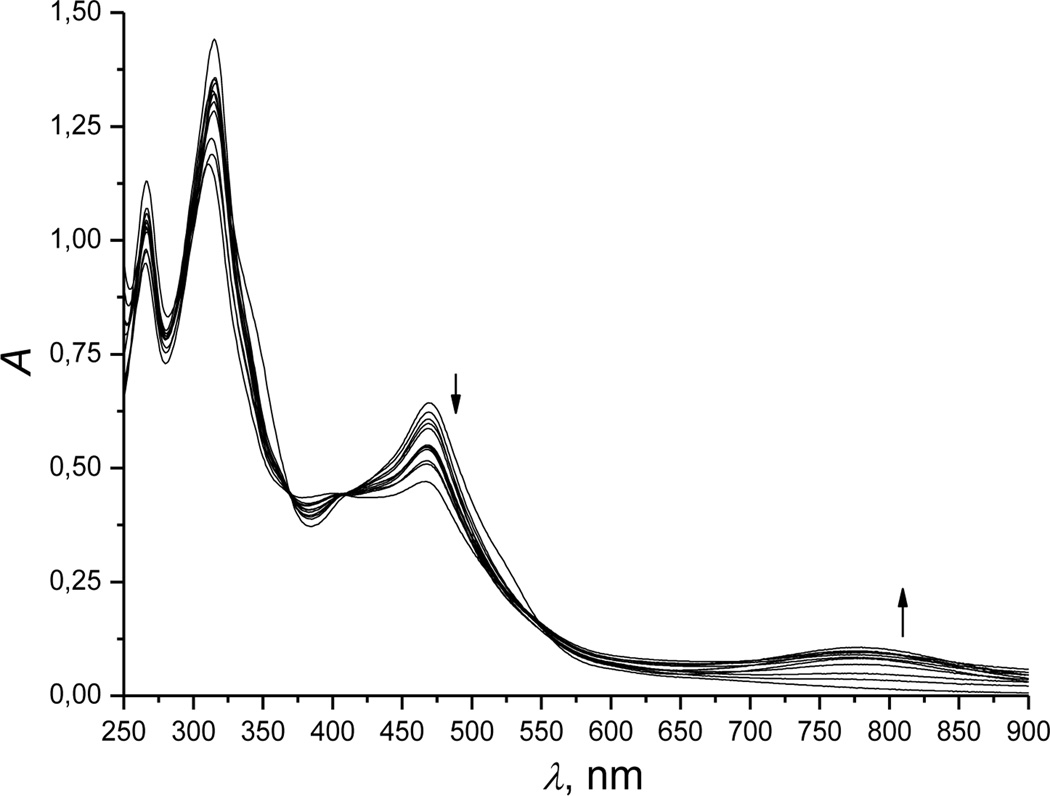
In acidic medium (pH 4.5), the reaction of cobinamide with hydrogen sulfide proceeded in two steps. The first step was accompanied by decreased absorbance at 349 and 520 nm (Figure 2, spectrum 1), and increased absorbance at 314 and 468 nm (Figure 2, spectrum 2). Spectral changes for the second step were similar to those found at pH 9.6 (Figure S5, Supporting Information).
Figure 2.
UV-Vis spectral changes recorded during reduction of Cbi(III) by hydrogen sulfide (first step). Experimental conditions: [Cbi(III)]total = 6 × 10⁻⁵ M; [H2S]total = 5 mm; pH 4.5; 298 K; anaerobic conditions. The spectra were recorded at a cycle time of 0.03 s.
Kinetic studies
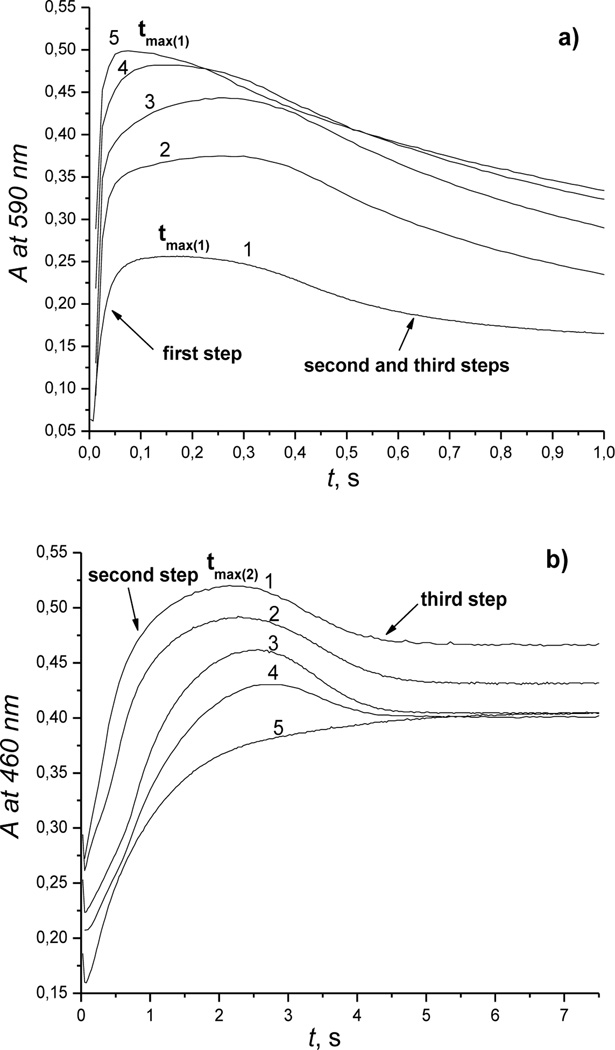
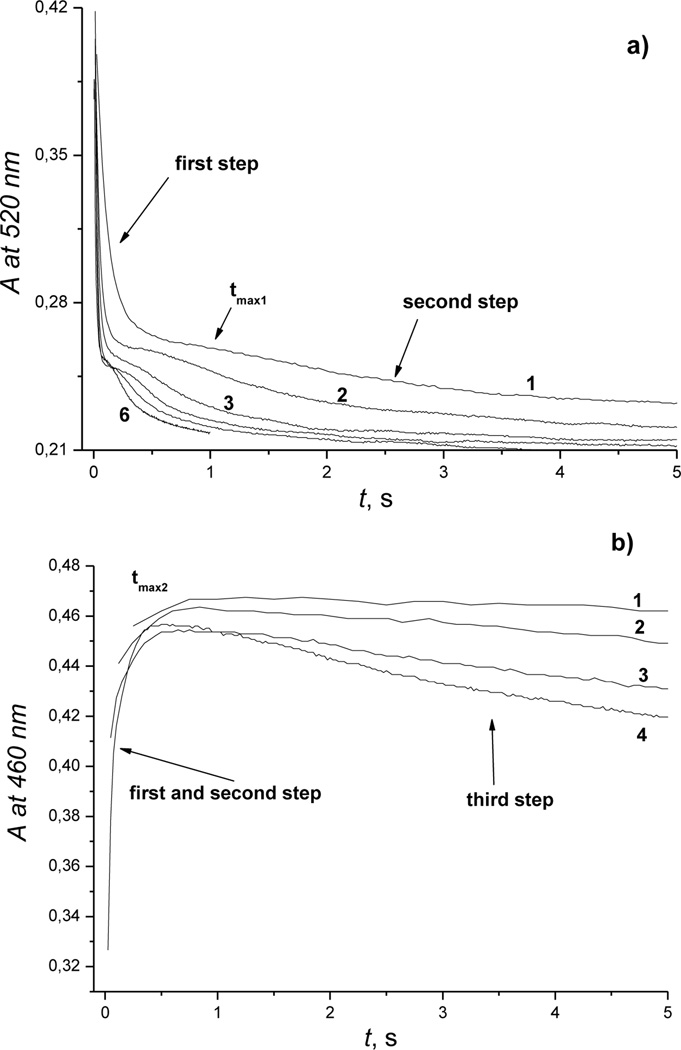
To study the mechanism of the reaction Cbi(III) with hydrogen sulfide, rate constants for the different reaction steps were determined as a function of hydrogen sulfide concentration, pH, temperature, and pressure. The observed kinetic traces for these studies are shown in Figures 3 (a, b) and 4 (a, b).
Figure 3.
Typical kinetic traces recorded for reaction of Cbi(III) with H2S at 590 nm and 460 nm at pH 9.6. Experimental conditions: [Cbi(III)]total = 6 × 10⁻⁵m, (a) [H2S]total = 1(1); 6.25 (2); 12.5 (3); 25 (4); 50 (5) mm; 25 °C. (b) [H2S]total = 1(1); 2.91 (2); 8.75 (3); 17.5 (4); 50 (5) mm; 25 °C.
Figure 4.
Typical kinetic traces recorded for reaction of Cbi(III) with H2S at 520 nm and 460 nm, pH 4.5. Experimental conditions: [Cbi(III)]total = 6 × 10⁻⁵m, (a) [H2S]total = 1 (1); 3.13 (2); 6.25 (3); 12.5 (4); 25 (5); 50 (6) mm; (b) [H2S]total = 6.25 (1); 12.5 (2); 25 (3); 50 (4) mm; 25 °C.
The shapes of the kinetic traces are characteristic for three consecutive reactions. Two values of tmax corresponding to maximum absorbance (concentrations) of intermediates were observed at 590 nm (in alkaline solution), 520 nm (in acidic medium) and 460 nm (over the whole pH range). These facts indicate formation of intermediates and suggest the following formal reaction scheme:
Of note, increasing the hydrogen sulfide concentration influenced accumulation of intermediates differently in alkaline solution. The results summarized in Figures 3 (a),(b) show that tmax1 decreases with increasing [H2S], whereas tmax2 increases with increasing [H2S]. We, therefore, suggest that kA and kC increase much more than kB with increasing [H2S]. This is reflected by increasing absorbance of the first intermediate and decreasing absorbance of the second intermediate with increasing [H2S].
To analyze the kinetic traces, we manually cut them in terms of the different reaction steps as shown in Figures S6–S12 (Supporting Information). Three reaction steps could be clearly identified. In alkaline medium, best fits of the experimental data for the first reaction step are either a first-order reaction (at [H2S] < 1 mm) or two consecutive first-order reactions (at [H2S] > 3 mm) with rate constants kobs(1) and kobs(2) (see Figures S6 and S7). In acidic medium, kinetic traces for the first reaction step are typical of a pseudo-first order reaction for all concentrations of hydrogen sulfide (see Figure S8). Kinetic traces for the second and third reaction steps are typical for a pseudo-first order reaction in the pH range from 4.5 to 11.0 with rate constants kobs(3) and kobs(4) (see Figures S9 – S12).
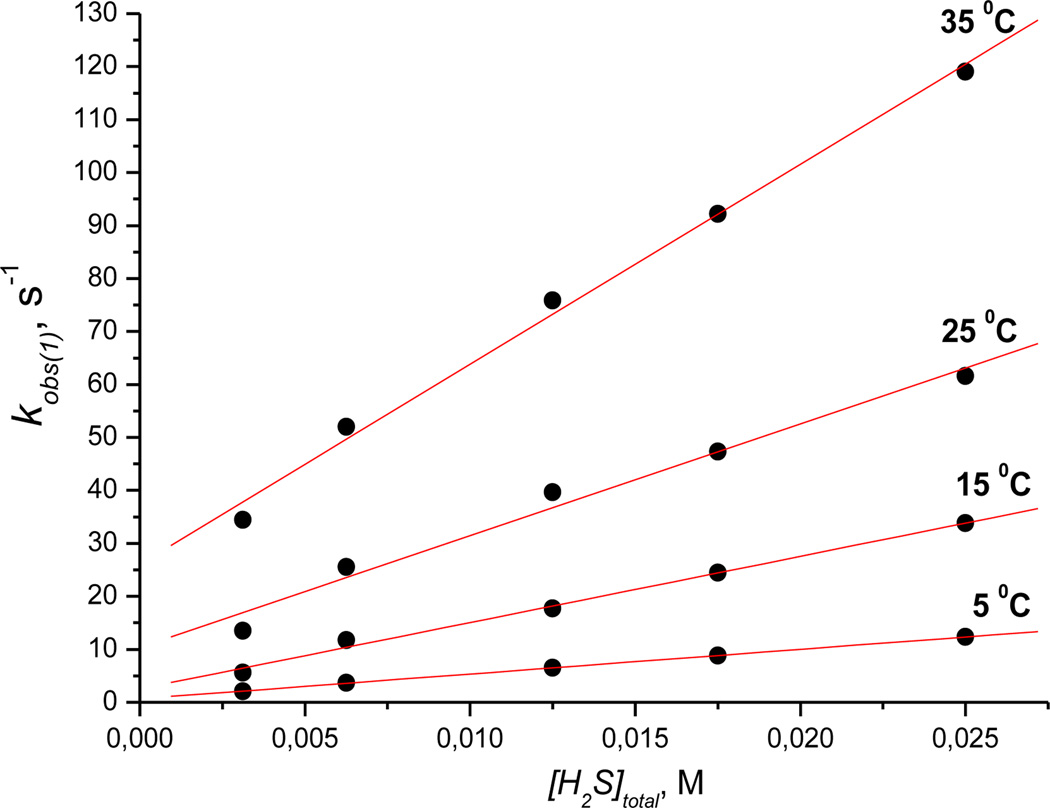
From these data, we were able to calculate four values of kobs in alkaline medium and three values of kobs in acidic medium. The dependence of all kobs on [H2S]total as a function of temperature was obtained at pH 4.5 and 9.6. Concentration dependencies of the observed rate constant for the first reaction step (kobs(1)) are shown in Figure 5 (pH 4.5) and Figure S13 (pH 9.6).
Figure 5.
Plots of kobs(1) versus [H2S]total measured for the first step of the reaction of Cbi(III) with H2S as a function of temperature at pH 4.5. Experimental conditions: [Cbi(III)]total = 6 × 10⁻⁵m; red line is a fit to equation 6.
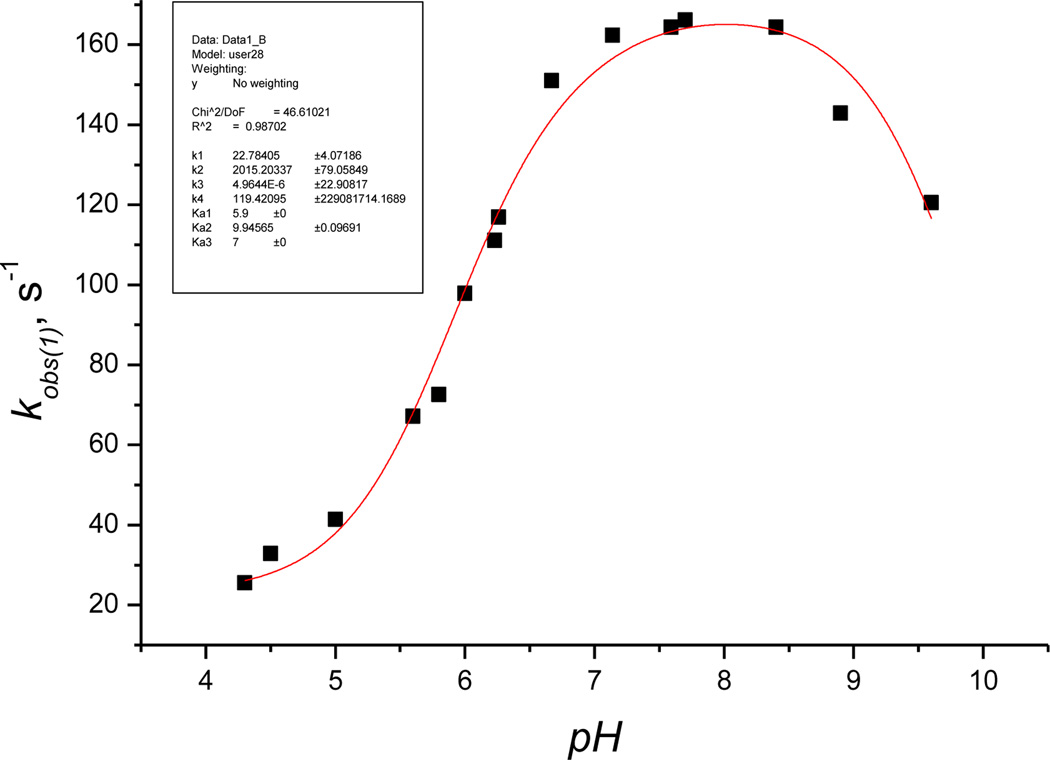
At each pH, the plot of kobs(1) versus [H2S]total is linear with a positive intercept, indicating that the reactions are reversible under all experimental conditions. We also studied the influence of pH on kobs(1) in the range 4.5 to 9.6 (Figure 6) at two hydrogen sulfide concentrations, viz. 6.25 and 25 mm. Both conditions yielded identical results.
Figure 6.
Plot of the first-order rate constant kobs(1) vs pH for the reaction of Cbi(III) with H2S. Experimental conditions: [Cbi(III)]total = 6 × 10⁻⁵ m, [H2S]total = 6.25 mm, 25 °C; red line is a fit to equation 5.
Figure 6 shows that the pH dependence of kobs1 is complex and has two plateaus in the pH ranges <4.5 and 7 – 8.5.
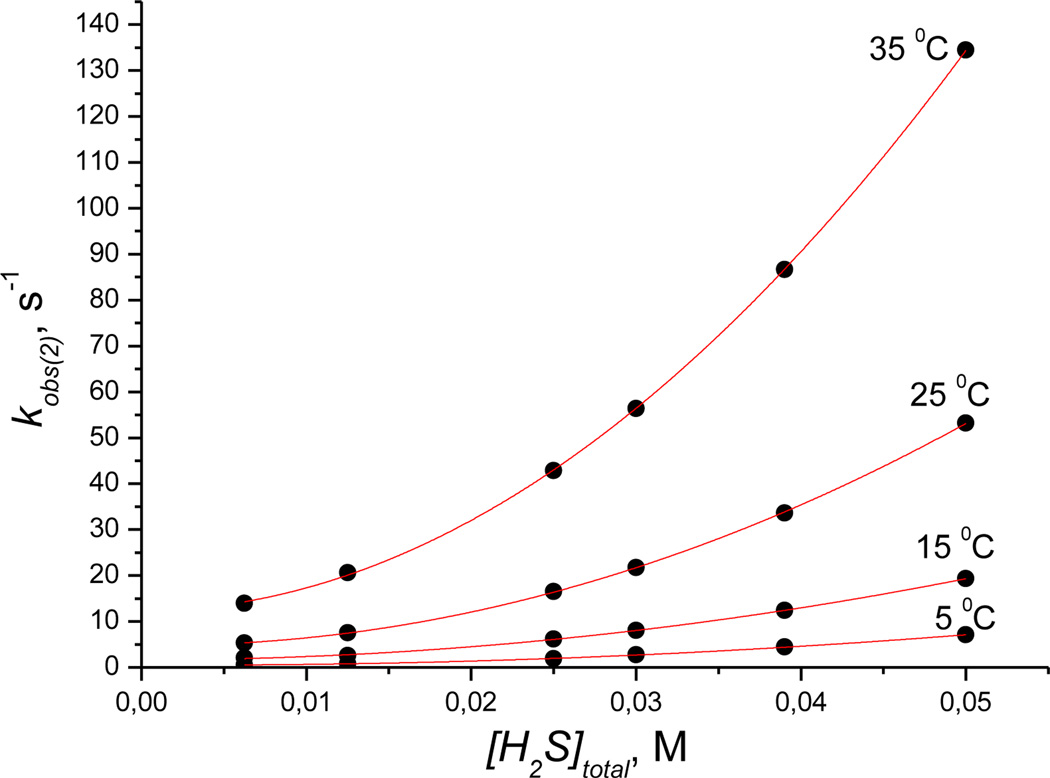
Figure 7 shows the dependence of kobs(2) on [H2S]total at pH 9.6, which is clearly non-linear. These plots can be linearized by plotting kobs(2) vs. [H2S]2total (see Figure S14, Supporting Information) and show a positive intercept. These data show that a second molecule of hydrogen sulfide reacts with cobinamide (III) and that the process is reversible.
Figure 7.
Plots of kobs(2) versus [H2S]total measured for the first step of the reaction of Cbi(III) with H2S as a function of temperature at pH 9.6. Experimental conditions: [Cbi(III)]total = 6 × 10⁻⁵m; red line is a fit to equation 8.
As noted above, kobs(2) was observed only in alkaline medium. For this reason, the influence of pH on kobs(2) was only studied in the range 8 to 10.5. We found that kobs(2) does not depend on pH in this range.
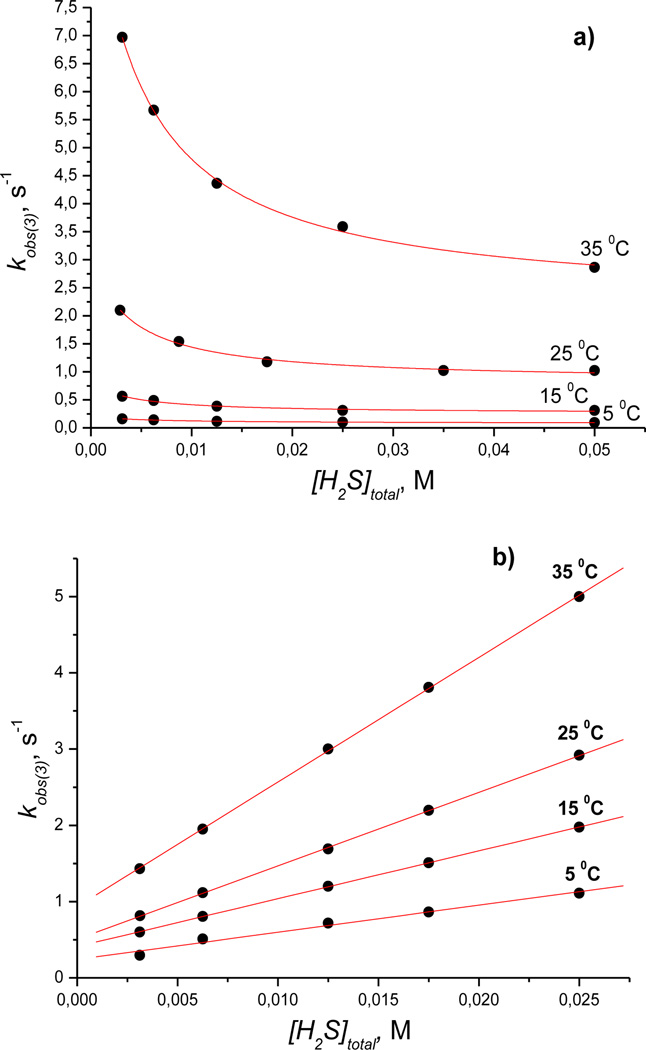
The concentration dependence of the observed rate constant (kobs(3)) for the reaction of cobinamide(III) with hydrogen sulfide was also examined at different pH values (Figures 8 (a, b)). kobs(3) decreases with increasing concentration of H2S (Figure 8 (a)) at pH 9.6. This dependence is characteristic for a reversible reaction consisting of two subsequent steps. However, in acidic medium, the plots of kobs(3) versus [H2S]total are linear with a positive intercept (Figure 8 (b)), suggesting that the reaction is reversible under all experimental conditions. It should be noted that kobs(3) does not depend on pH at [H2S]total = 6.25 mm.
Figure 8.
Plots of kobs(3) versus [H2S]total measured for the second step of the reaction of Cbi(III) with H2S as a function of temperature at pH 9.6 (a) and 4.5 (b). Experimental conditions: [Cbi(III)]total = 6 × 10⁻⁵m; red line is a fit to equation 11 (a) or 10 (b)
The corresponding dependencies of kobs(4) at рН 4.5 and 9.6 are shown in Figures S15 and S16 (Supporting Information), respectively. They are linear with a positive intercept in both cases.
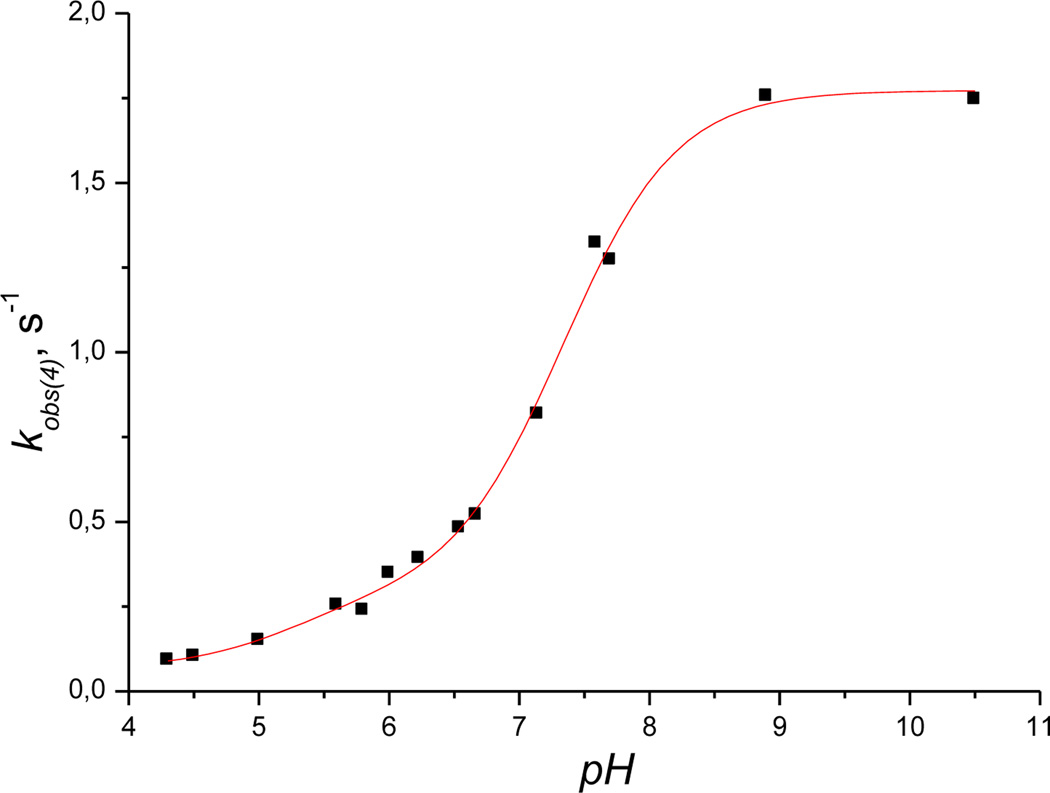
The pH-dependence of kobs(4) shows that the rate of the reaction significantly accelerates on increasing the pH from 4.0 to 10.5 and reaches a plateau value at pH > 9.0 (Figure 9).
Figure 9.
Plot of the first-order rate constant kobs(4) vs pH for the reduction of Cbi(III) by H2S. Experimental conditions: [Cbi(III)]total = 5 × 10⁻⁵m, [H2S]total = 6.25 mm, 25 °C; red line is a fit to equation 12.
Product identification
Dependence of the UV-Vis spectrum of the reaction products on the initial concentration of H2S. Acid-base properties of the products of the reaction
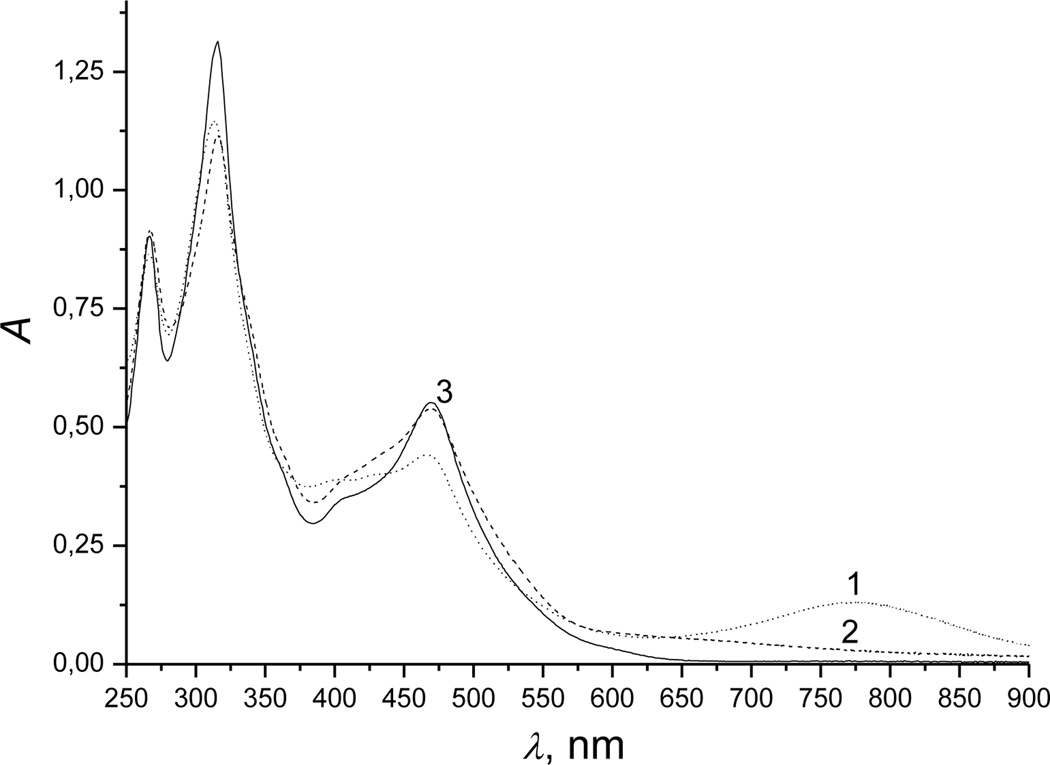
At any hydrogen sulfide concentration, UV-Vis spectra of the product of the reaction of cobinamide with hydrogen sulfide (Figure 10, spectra 1 and 2) differ from those of Cbi(II) prepared via the reaction of Cbi(III) with borohydride (Figure 10, spectrum 3). Moreover, at the concentration ratio [Cbi(III)]:[H2S]total = 1:1, the UV-Vis spectrum of the reaction product depends on pH (Figure 10, spectra 1 and 2). Analysis of this dependence gave a pKa5 value of 5.2 (Figure S17, Supporting Information). At the same time, no change in the UV-Vis spectrum of Cbi(II) was observed in the pH range 1–11.
Figure 10.
UV-vis spectra of different cobinamides: Cbi(II) prepared through the reaction of Cbi(III) with borohydride at pH 3–10.5 (solid line, 3), final product of the reaction of Cbi(III) with H2S at pH 9.6 (dotted line, 1) and 4.5 (dashed line, 2): [Cbi(III)]total = [H2S]total = 5.0 × 10⁻⁵m, 25 °C.
Further information on dependence of the final product of the reaction between Cbi(III) and hydrogen sulfide on the hydrogen sulfide concentration was obtained for the pH range 4.5 to 10.5. The final spectra of the products of the reaction as a function of the hydrogen sulfide concentration at pH 4.5 are shown in Figure 11. With higher initial concentrations of hydrogen sulfide, the spectra of the final products were changed more significantly. The intensity of the bands at 315 and 468 nm decreased and new bands appeared at 778 and 400 nm with increasing hydrogen sulfide concentration, for which isosbestic points show up at 408 and 538 nm. This is particularly noticeable at 468 nm (Figure S18). The dependence of the final absorbance at 469 nm on the initial hydrogen sulfide concentration shows a non-linear behavior, which is typical for a complex-formation reaction. In alkaline solution, identical data were obtained (Figure S19, Supporting Information). The UV-Vis spectrum of the product of reaction of Cbi(III) with excess hydrogen sulfide ([H2S]total > 0.05 m) was independent of pH.
Figure 11.
Dependence of the final spectrum of the products formed during the reaction of Cbi(III) with H2S as a function of the H2S concentration. Experimental conditions: [Cbi(III)]total = 5 × 10⁻⁵m; [H2S]total = 9 × 10⁻⁵ – 0.09 m; pH 4.5; 25 °C.
Reaction between reduced cobinamide (Cbi(II)) and hydrogen sulfide
Cbi(II) forms stable complexes with sulfur and nitrogen donor ligands.[4,7] We, therefore, studied the reaction of reduced cobinamide with hydrogen sulfide. In alkaline solutions (pH 9.4 – 11.4), the reaction of Cbi(II) with hydrogen sulfide was accompanied by a rapid decrease in absorbance at 469 nm and appearance of new intense bands at 417, 471, and 711 nm with clean isosbestic points at 445 and 500 nm (Figure S20). In acidic medium (pH < 4.5), no reaction of Cbi(II) with hydrogen sulfide was observed.
The dependence of the final absorbance at 469 nm on the initial hydrogen sulfide concentration was non-linear (Figure S21), which is typical for a complex-formation reaction. To study the influence of pH, a series of pH jump experiments were performed. The (HS−)Cbi(II) complex formed at pH 9.6 dissociated during acidification to pH 4, and reformed on alkalization back to pH 9.6. Based on this observation and the data given above, we conclude that a stable complex between HS− and Cbi(II) can be formed only in a 1:1 ratio. Unfortunately, the reaction of Cbi(II) with hydrogen sulfide was too fast to be studied kinetically under any experimental conditions.
Methylation of cobinamide by CH3I in the presence of hydrogen sulfide
As mentioned above, the UV-Vis spectrum of the reaction product of cobinamide(III) with hydrogen sulfide differs from that generated by other reducing agents (sodium borohydride, ascorbic acid, sodium formate, glucose[8]). This could be due to two reasons. The first is reversible coordination of the hydrogen sulfide radical on the cobalt(II) centre of cobinamide in analogy with another sulfur containing radical – SO2−.[7(a)] And second, the corrin ring could be modified by the hydrogen sulfide radical, since the ring can be irreversibly modified by radicals to form new compounds.9 Studying reversibility of cobinamide’s reaction with hydrogen sulfide could distinguish between these two possibilities.
Methylcobalamin can be easily produced by mixing cobalamin with CH3I in the presence of hydrogen sulfide.[10] Though the exact mechanism of this reaction is unknown[9], we used the reaction to probe reversibility of cobinamide’s reaction with hydrogen sulfide. We found that adding CH3I to cobinamide in the presence of excess hydrogen sulfide led to major changes in the UV-Vis spectra at pH 9.6: the bands at 312 and 764 nm disappeared and new bands appeared at 304, 374 and 462 nm with isosbestic points at 343, 385, 437 and 521 nm (see Figure S22 Supporting Information). The UV-Vis spectrum of the final product corresponded to that of methylcobinamide (MeCbi(III)).[11] The same results were obtained at pH 4.5 and 6.3. Formation of MeCbi(III) demonstrates reversibility of cobinamide’s reaction with hydrogen sulfide, and no modification of the corrin ring under anaerobic conditions. Formation of MeCbi(III) also was confirmed by 1H NMR spectroscopy (see below).
Mass spectrometry
To analyze the products of the reaction of Cbi with H2S under anaerobic conditions, mass spectrometric experiments were performed. Cbi, signals (m/z) were observed at 987.46, 1023.44 and 1059.42 in the negative-ion mode (Figure S23 (a), Supporting Information). Based on the molecular weight of four-coordinate cobinamide (990) and that only water was used as solvent, we attributed these peaks to [Cbi2+−3H+]−, [Cbi2++2OH−−H+]− and [Cbi2++H2O+3OH−]−. After reacting cobinamide with hydrogen sulfide, new signals (m/z) were observed at 1084.40, 1120.37 and 1130.46 in negative-ion mode (Figure S23 (b), Supporting Information). These values do not correspond to either the complex of cobinamide with one or two coordinated molecules of hydrogen sulfide or to the dimer [Co(II)]-S-S-[Co(II)] produced by reaction of Cbi with hydrogen sulfide in the presence of oxygen.[12] We repeated the experiment in positive-ion mode and signals (m/z) were observed at 506.22, 557.77, 989.54 and 1053.39 (Figure S24 (c), Supporting Information). The third signal corresponds to that of reduced cobinamide [Cbi(II)]+ but the other three signals could not be identified. We concluded that the product of the reaction of cobinamide with hydrogen sulfide is unstable and some additional reaction of cobinamide with hydrogen sulfide occurred under the MS experimental conditions. We should note that all experiments were repeated twice with similar results.
Electrochemical Study of Reaction of Cobinamide and H2S
In Figure S24, we show cyclic voltammograms (CVs) of cobinamide in the absence (black line, 1) and presence of hydrogen sulfide (red and green lines, 2) in a pH 4.5 buffer with a glassy carbon electrode. For cobinamide only, two separate pairs of reduction-oxidation peaks were observed at ca. 0.19 V (Co(III)/Co(II)) and −0.69 V(Co(II)/Co(I)), which agree with published values.[13] The CV of the cobinamide–hydrogen sulfide system is shown in (Figure S24 (red and green lines, 2)). On adding H2S to a solution of Cbi(III) the reduction peak for the Co(III)/Co(II) process for Cbi(III) disappeared. The potential sweep was performed in two directions: from 1 V to negative range (Figure S24, (red line, 2) and from −0.5 V to positive range (green line, 2). In both cases, two new reduction peaks were observed at ca. +0.62 and −0.63 V, and four oxidation peaks were observed at −0.65, −0.07, +0.37 and +0.7 V. Because the shape of the CV did not depend on the direction of the potential sweep, we concluded that the studied system is reversible.
1H-NMR studies
We analyzed the product of the reaction of cobinamide with hydrogen sulfide and CH3I by 1H-NMR spectroscopy. The most informative spectral region is the aromatic part of the 1H NMR spectra. In contrast to cobalamin,[14] cobinamide showed only one peak at 6.52 ppm, which corresponds to the proton at C10 of the corrin ring (Figure S25 (a), Supporting Information). No peaks were found in the aromatic region of the 1H NMR spectra after adding hydrogen sulfide to cobinamide (Figure S25(b)). Disappearance of the signals of Cbi in 1H NMR spectroscopy is caused by reduction of cobinamide to Cbi(II), but not to Cbi(I).[15] We concluded that reduction of cobinamide by hydrogen sulfide proceeded at pH 4.5 – 10. These data agree with the results obtained by UV-Vis spectroscopy. Adding CH3I to a mixture of cobinamide and hydrogen sulfide leads to the appearance of a new single peak at 6.78 ppm in the aromatic region of the 1H-NMR spectrum (Figure S25 (c)). This peak is identical to that for MeCbi.[11] The new peak was also observed at −0.17 ppm. Based on a comparison of the 1H-NMR spectra of cobinamide to literature data, we conclude that the peak corresponds to the methyl group bound to Co(III).
Overall mechanistic discussion
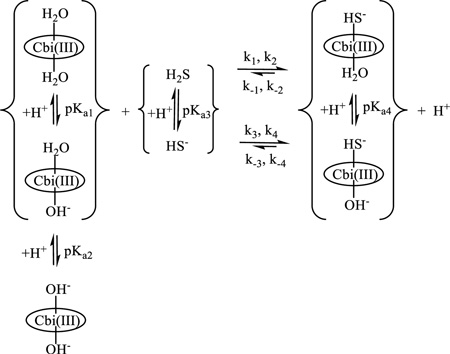
In aqueous solutions, Cbi(III) exists in the diaqua (H2O)2Cbi(III)), aquahydroxo (H2O)(OH−)Cbi(III), and dihydroxo (HO−)2Cbi(III) forms (reaction 1), with pKa1 = 5.9 and pKa2 = 10.2. [16] Coordinated OH− is inert to substitution in cobinamide, and only water can be exchanged by other ligands.[16,17] Interaction of Cbi(III) with various L ligands leads to formation of (L)Cbi(III) or (L)2Cbi(III) complexes.[4, 16]
Hydrogen sulfide has acid-base properties, and in water solution can exist as a neutral acid and mono-anionic species, characterized by two pKa values. The first pKa3 is 7 for H2S/HS− (reaction 1), the second pKa for HS−/S2− is > 12 [18,19], e.g. the dissociation to S2− will be negligible under the conditions of our study. We should note that hydrogen sulfide can act as a ligand and form stable complexes with Fe-porphyrins.[20,21]
Our spectrophotometric data clearly show that complex-formation proceeds during the first step of the reaction of cobinamide with hydrogen sulfide in alkaline medium. We found that the UV-Vis spectra of the first intermediate depend on the initial hydrogen sulfide concentration. Moreover, the positions of bands of the first intermediate are red-shifted with increasing hydrogen sulfide concentration. The same behavior was observed during formation of a cobinamide complex with one and two molecules of thiocyanate[4] or cyanide.[22] We, therefore, suggest that Cbi reacts with one (at low concentration, reaction 1) and two molecules of H2S (at high concentration, reaction 2) This is confirmed by the shape of the kinetic traces and the linear (kobs(1)) and square (kobs(2)) dependencies on the initial hydrogen sulfide concentration in alkaline medium. Thus, our data confirm that Cbi can bind two times more sulfide than Cbl.
Formation of (HS−)2Cbi clearly shows that the main species generated is (HS-)(H2O)Cbi (reaction 1) after coordination of the first HS− molecule, because OH− is inert to substitution. We tried to measure pKa4 but without success, because kobs(2) did not change with pH in the range 8–10.5. In analogy with (CN−)(H2O)Cbi whose acid dissociation constant has been determined to be 11.0 and is higher than that of (H2O)(OH−)Cbi(III) (pKa2, see above), we suggest that pKa4 is > 10.5.
Although we did not directly observe formation of the first intermediate in UV-Vis spectral analyses in acidic medium, it can be observed in the kinetic traces. This could be due to the similarity of UV-Vis spectra of the first intermediate and the subsequent product. To find additional evidence, we performed experiments with L-cysteine and cobinamide. We found that this reaction proceeds in two steps. The first step is coordination of L-cysteine to form a complex with cobinamide. The spectrum of this complex was found to depend on pH (see Figures S26 and S27, Supporting Information). In alkaline medium, the UV-Vis spectrum of the complex is identical to that of (HS−)(H2O)Cbi, whereas in acidic medium, the UV-Vis spectrum of the complex is changed and peaks are blue-shifted. These data agree with our observation in the case of hydrogen sulfide and underline the similarity of both systems.
The Co3+ in cobinamide can be reduced to Co2+ (reduced cobinamide, Cbi(II)) and Co1+ (super reduced cobinamide, Cbi(I))[23], and hydrogen sulfide is a reducing agent.[24] At low concentrations of hydrogen sulfide (< 5 mm), the UV-Vis spectra of the second intermediate observed during reaction of cobinamide with H2S are similar to those of Cbi(II) produced by reducing cobinamide with other reducing agents, viz. borohydride, ascorbate and formate.[4] However, the UV-Vis spectrum of Cbi(II) is not pH dependent from pH 1–11.[4] We observed that the UV-Vis spectra of the second intermediate were pH dependent, with the value of pKa5 as 5.2. The product of the one electron oxidation of hydrogen sulfide is a long-lived radical in order to exhibit a pKa under the experimental conditions and the pKa value is expected to be 3–4 units lower than that of H2S/HS−[25]
To obtain more information about the reaction product, electrochemical experiments were performed (see above). Based on literature data,[26] our UV-Vis spectroscopy data, and the reduction potential of ·SH/SH− being 1.1 V vs normal hydrogen electrode (NHE)[27], we attributed the reduction peak at −0.62 V to a two electron reduction of Cbi(II)S(H) leading to Cbi(I) and hydrogen sulfide. The subsequent oxidation peak corresponding to Co(I)/Co(II) at −0.65 V confirmed this conclusion. We attributed the oxidation peaks at −0.07 and +0.37 V to some oxidation of Co(II) to Co(III), which was complicated by the reaction of Co(III) with hydrogen sulfide to form the reduced cobinamide complex with sulfide radical (H)SCo(II). Of course, some unexpected reaction on the surface of the electrode could occur; for example, Zheng and Birke showed that reduction of cobalamin(III) by NO proceeded on the electrode surface[28], although NO itself did not reduce cobalamin(III) in bulk solution.[14] We attributed the last oxidation peak at +0.7 V to oxidation of (H)SCo(II) to form the cobinamide(III) complex with a sulfide radical that is reduced back at +0.62 V. From these data we suggest that the second step (kobs(3)) corresponds to an inner-sphere electron transfer process with formation of the reduced cobinamide complex with sulfide radical, (H)SCbi(II) (reaction 3).
The dependence of kobs(3) on the hydrogen sulfide concentration was a function of pH. In acidic medium, a linear dependence of kobs(3) on the H2S concentration was observed. This dependence is observed for a reversible bimolecular reaction when the equilibrium constant is small and no kinetic saturation can be reached. In alkaline solution, kobs(3) decreased with increasing H2S concentration. This dependence could be observed when either an inhibitor of the active species is added to the reaction or the leaving of a ligand from the inner-sphere of the complex is the rate-determining step.[29]
We conclude that the addition of a second molecule of hydrogen sulfide to form (HS−)2Cbi strongly hinders the reduction of cobinamide and stabilizes the 3+ oxidation state of Co in cobinamide (reaction 2). Reduced cobinamide coordinates ligands (L) to form a five-coordinate complex, (L)Cbi(II)[7], and the sulfide radical adds reversibly to HS− to form the dimer radical.[25] The last step observed in the reaction of cobinamide with hydrogen sulfide could be due to a number of reasons. The first is displacement of the sulfide radical by hydrogen sulfide in the inner-sphere of cobinamide with formation of (HS−)Cbi(II). The second is addition of hydrogen sulfide to the complex of Cbi(II) with the sulfide radical and formation of (SSH2−)(Cbi(II)). However, we found that the UV-Vis spectrum of the (HS−)Cbi(II) complex differs from the product of the reaction of Cbi(III) with hydrogen sulfide. Moreover, (HS−)Cbi(II) is formed only in alkaline solution, whereas the product of the reaction of Cbi(III) with hydrogen sulfide is produced in the pH range 1–11. Thus, we conclude that the second variant is more favorable than the first (reaction 4) and is consistent with a data for cobalamin.[6] The pH dependence of kobs(4) shows that all species of cobinamide and hydrogen sulfide are partners in the reaction.
 |
(1) |
 |
(2) |
 |
(3) |
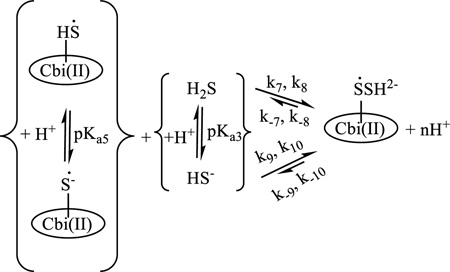 |
(4) |
For reaction (1), the following kinetic equation was obtained:
| (5) |
where k`1, k`2, k`3, and k`4 are observed first-order rate constants for (H2O)2Cbi(III)/H2S, (H2O)2Cbi(III)/HS−, (H2O)(OH)Cbi(III)/H2S, and (H2O)(OH)Cbi(III)/HS−, respectively. Fitting the data shown in Figure 6 to eq. (5), while fixing pKa1 ((H2O)2Cbi(III)) at 5.9, pKa3 (H2S) 7.0, gave the best fit with k`1 = 23 ± 4 s−1, k`2 = 2015 ± 79 s−1, k`3 = 0 ± 23 s−1, k`4 =119 ± 20 s−1 and pKa2 = 10.00 ± 0.1. The calculated pKa2 value for the equilibrium (H2O)(OH)Cbi(III)/(OH)2Cbi(III) is in agreement with the literature value (pKa2 10.2).[16] Comparison of k`1, k`2, k`3 and k`4 clearly shows that HS− is more active in reaction with cobinamide(III) than H2S. At the same time, (H2O)2Cbi(III) reacts faster with hydrogen sulfide than (H2O)(OH)Cbi(III). This is expected because (H2O)2Cbl(III) (total charge +2)[22] and (H2O)(OH)Cbi(III) (total charge +1) are positively charged and coordination of the negatively charged HS− must support the complex-formation reaction with cobinamide.
The received constants of complex formation between diaquacobinamide and hydrogen sulfide have been compared with those for aquacobalamine.[6] It is found that cobinamide binds sulfide approx. 100 times faster then cobalamin at the same conditions.
According to reaction (1) at pH 4.5 and 9.4, the dependence of kobs(1) on the hydrogen sulfide concentration can be described by equation (6):
| (6) |
where kslope = k4 at pH 9.6, k1 at pH 4.5, kintercept = k−4 at pH 9.6, k−1 at pH 4.5, [H2S]total = [HS−] at pH 9.6 or [H2S] at pH 4.5
The dependence of kobs(1) on [H2S]total was analyzed. The determined values of kslope, kintercept, activation enthalpy and entropy are summarized in Tables 1 and 2.
Table 1.
Kinetic and thermodynamic parameters for reduction of Cbi(III) by H2S at pH 4.5 [for kobs(1)]
| T [°C] | k1 [m−1s−1] | k−1 [s−1] |
|---|---|---|
| 35 | 3775 ± 168 | 26 ± 2 |
| 25 | 2112 ± 171 | 10 ± 3 |
| 15 | 125 ± 55 | 2.5 ± 0.8 |
| 5 | 466 ± 3 | 0.70 ± 0.05 |
| ΔH≠(k) [kJ mol−1] | 46 ± 4 | 85 ± 4 |
| ΔS≠(k) [J K−1 mol−1] | −26 ± 12 | +59 ± 12 |
Table 2.
Kinetic and thermodynamic parameters for reduction of Cbi(III) by H2S at pH 9.6 [for kobs(1)]
| T [°C] | k4 [m−1s−1] | k−4 [s−1] |
|---|---|---|
| 35 | 17201 ± 455 | 109 ± 5 |
| 25 | 11051 ± 615 | 46 ± 8 |
| 15 | 3025 ± 115 | 11 ± 2 |
| 5 | 1549 ± 35 | 1.4 ± 0.5 |
| ΔH≠(k) [kJ mol−1] | 58 ± 8 | 100 ± 11 |
| ΔS≠(k) [J K−1 mol−1] | +26 ± 24 | +124 ± 34 |
According to reaction (2) at pH 9.6, the dependence of kobs(2) on the hydrogen sulfide concentration may be described by equation (7):
| (7) |
In the case where K4·[H2S]total << 1, equation (7) can be rewritten to give equation (8):
| (8) |
The calculated values of k5 and k−5 are summarized in Table 3 (K4 = k4/k−4 from Table 2).
Table 3.
Kinetic and thermodynamic parameters for reduction of Cbi(III) by HS at pH 9.6 [for kobs(2)]
| T [°C] | k5×K4, [m−2 s−1] | k5, [m−1 s−1] | k−5, [s−1] |
|---|---|---|---|
| 35 | 48794 ± 158 | 310 | 12.5 ± 0.2 |
| 25 | 19448 ± 113 | 81.7 | 4.4 ± 0.2 |
| 15 | 7066 ± 57 | 26.4 | 1.7 ± 0.1 |
| 5 | 2680 ± 48 | 2.5 | 0.34 ± 0.06 |
| ΔH≠(k) [kJ mol−1] | 67 ± 2 | 109 ± 12 | 82 ± 6 |
| ΔS≠(k) [J K−1 mol−1] | +62 ± 6 | −158 ± 36 | +42 ± 20 |
Most of the activation entropy values in Tables 1 to 3 are positive for the backward reactions (k−1, k−4 and k−5), characteristic for a dissociative reaction mechanism, whereas that for the forward reaction (k5) tends to support an associative mechanism. The activation entropy values for the other forward reactions (k1 and k4) are practically zero and support the operation of an interchange mechanism typical for ligand substitution reactions of aquahydroxocobinamide.[16]
In acidic medium, the dependence of kobs(3) on the hydrogen sulfide concentration can be described by equation (9):
| (9) |
If K1·[H2S]total << 1, then equation (9) can be rewritten as in equation (10):
| (10) |
Equation (10) was used to analyze the data given in Figure 8 (a) and the calculated values are listed in Table 4 (K1 = k1/k−1 from Table 1).
Table 4.
Kinetic and thermodynamic parameters for reduction of Cbi(III) by H2S at pH 4.5 [for kobs(3)]
| T / °C | k6K1 [m−1s−1] | k6 [s−1] | k−6 [s−1] |
|---|---|---|---|
| 35 | 163 ± 1 | 1.13 | 0.93 ± 0.02 |
| 25 | 96.3 ± 0.8 | 0.47 | 0.51 ± 0.01 |
| 15 | 62.7 ± 0.3 | 0.12 | 0.41 ± 0.01 |
| 5 | 35 ± 3 | 0.053 | 0.24 ± 0.04 |
| ΔH≠(k) [kJ mol−1] | +33 ± 1 | 7 ± 1 | 28 ± 4 |
| ΔS≠(k) [J K−1 mol−1] | −95 ± 3 | −8 ± 3 | −155 ± 12 |
In alkaline medium, the dependence of kobs(3) on the hydrogen sulfide concentration may be described by equation (11):
| (11) |
Equation (11) was applied to analyze the data given in Figure 8 (a). The calculated values of k−5, k−6 and K5/6 (=k5/k6) are listed in Table 5. We also calculated k6 using the values of k5 listed in Table 3. We found that the values of k−5, k−6 and k6 obtained using different experimental conditions and equations 8 and 11 and (10 and 11) gave values of the same magnitude. This result confirms the correctness of the proposed equations and our suggestion about inhibition of electron transfer by coordination of a second molecule of hydrogen sulfide. Furthermore, the rate of inner-sphere electron transfer does not depend on pH as expected.
Table 5.
Kinetic and thermodynamic parameters for reduction of Cbi(III) by HS at pH 9.6 [for kobs(3)]
| T [°C] | k−5 [s−1] | k−6 [s−1] | K5/6 (=k5/k6) [m−1] |
k6 [s−1] |
|---|---|---|---|---|
| 35 | 9.9 ± 0.5 | 2.2 ± 0.1 | 195 ± 34 | 1.58 |
| 25 | 3.1 ± 0.4 | 0.83 ± 0.07 | 272 ± 118 | 0.3 |
| 15 | 0.8 ± 0.2 | 0.26 ± 0.03 | 267 ± 192 | 0.099 |
| 5 | 0.21 ± 0.03 | 0.08 ± 0.01 | 187 ± 101 | 0.013 |
| ΔH≠(k) [kJ mol−1] | 90 ± 1 | 77 ± 1 | - | 108 ± 10 |
| ΔS≠(k) [J K−1 mol−1] | +65 ± 3 | +11 ± 3 | - | +110 ± 30 |
To obtain more information on the underlying reaction mechanism, we investigated the effect of pressure on the reduction of Cbi(III) by hydrogen sulfide. These experiments were performed at pH 4.5 to allow calculation of the rate of electron transfer directly from the observed kinetic traces without additional recalculation as at pH 9.6. The activation volume was found to be +22.4 ± 1.0 cm3 mol−1 at 25 °C (Figure S28, Supporting Information). The effect of pressure on the reduction of the other Co(III) complexes was studied by van Eldik and other research groups.[30] They found that activation volumes for reduction of Co(III) to Co(II) complexes lie between +19 and +34 cm3 mol−1. The significantly positive activation volumes were ascribed to the change in solvation of the cobalt center during reduction of Co(III) to Co(II). Starting with six-coordinated (H2O)2Cbi(III), we found that the water molecule is first displaced by H2S to form (H2O)(HS−)Cbi(III). Reduced cobinamide(II) is believed to be five-coordinate, and we found that the sulfide radical did not leave the inner sphere of the cobalt(II) complex. We conclude that the positive activation volume in cobinamide can be ascribed to the liberation of the second coordinated water molecule (reaction 3). This is in good agreement with the results from our study on the effect of pressure on reduction of cobalamin by hydrogen sulfide.[6] In this case, the activation volume for the electron transfer process was found to be zero. During reduction of cobalamin, no liberation of any molecule from the coordination sphere of cobalt was observed. Dimethyl benzimidazole is strongly bound to Co(II) in reduced cobalamin.
For reaction (4) the following kinetic equation was derived:
| (12) |
where k`8, k`9, k`10 and k`11 are observed first-order rate constants for Cbi(II)SH/H2S, Cbi(II)SH/HS−, Cbi(II)S−/H2S and Cbi(II)S−/HS−, respectively. Fitting the data shown in Figure 9 to eq. (12) gave the best fit with k`8 = 0.07 ± 0.05 s−1, k`9 = 0.49 s−1, k`10 = 0.29 s−1, k`11 =1.77 ± 0.03 s−1, pKa5 = 5.2 ± 0.6 and pKa3 = 7.3 ± 0.1. The calculated pKa3 value agrees closely with the literature value (pKa3 7). [31] Moreover, the pKa5 value is close to that determined from the pH dependence of the UV-Vis spectra for the product of the reaction of Cbi(III) with hydrogen sulfide (Figure S18). Comparison of k`8, k`9, k`10 and k`11 clearly shows that HS− is more reactive in the reaction with the complex of reduced cobinamide with the hydrogen sulfide radical (Cbi(II)S(H)) than H2S. At the same time, Cbi(II)S− reacts faster with hydrogen sulfide than in the protonated form.
Equation (6) was used to analyze the dependence of kobs(4) on [H2S]total, where kslope = k8 at pH 4.5 and k11 at pH 9.6, kintercept = k−8 at pH 4.5 and k−11 at pH 9.6, [H2S]total = [HS−] at pH 9.6 and [H2S] at pH 4.5 (see Tables 6 and 7).
Table 6.
Kinetic and thermodynamic parameters for reduction of Cbi(III) by H2S at pH 4.5 [for kobs(4)]
| T [°C] | kslope [m−1 s−1] | kintercept [s−1] |
|---|---|---|
| 35 | 16 ± 1 | 0.08 ± 0.03 |
| 25 | 9.35 ± 0.04 | 0.033 ± 0.001 |
| 15 | 1.8 ± 0.2 | 0.002 ± 0.005 |
| 5 | 0.43 ± 0.02 | ~ 0 |
| ΔH≠(k) [kJ mol−1] | 87 ± 10 | 132 ± 40 |
| ΔS≠(k) [J K−1 mol−1] | +64 ± 30 | +166 ± 120 |
Table 7.
Kinetic and thermodynamic parameters for reduction of Cbi(III) by HS- at pH 9.6 [for kobs(4)]
| T [°C] | kslope [m−1 s−1] | kintercept [s−1] |
|---|---|---|
| 35 | 276.2 ± 0.7 | 2.47 ± 0.01 |
| 25 | 102.8 ± 0.9 | 1.28 ± 0.01 |
| 15 | 61.6 ± 0.6 | 0.25 ± 0.01 |
| 5 | 14.2 ± 0.1 | 0.12 ± 0.01 |
| ΔH≠(k) [kJ mol−1] | 65 ± 8 | 74 ± 10 |
| ΔS≠(k) [J K−1 mol−1] | +12 ± 24 | +3 ± 30 |
It can be seen from Tables 6 and 7 that both forward and backward reactions are characterized by positive activation entropies for the reaction at pH 4.5, whereas practically zero values were found for the reaction at pH 9.6. The activation volume for the forward reaction at pH 4.5 was found to be +9.0 ± 1.0 cm3mol−1 (see Figure S29, Supporting Information). Thus, both the activation entropy and activation volume data indicate an increase in disorder and an increase in volume during reaction (4). We account for these effects in terms of the need to weaken the Co(II)-sulfide radical bond before binding of hydrogen sulfide to the sulfide radical occurring in the second coordination sphere, since it involves bond formation with an existing coordinated ligand.
Conclusions
Detailed kinetic and mechanistic studies on cobinamide’s reaction with hydrogen sulfide has been performed. It was found that cobinamide can form complexes with one and two molecules of HS−. Moreover, we showed that the electron-transfer process involving formation of the Cbi(II) complex with a sulfide radical is possible only when one HS− is coordinated to Cbi. The formation of (HS−)2Cbi stabilizes the 3+ oxidation state of cobalt and hinders the inner-sphere electron transfer reaction. The pKa of the hydrogen sulfide radical (5.2) coordinated to the cobalt (II) center has been determined. This pKa value does not present the pKa of the free hydrogen sulfide radical in solution, but confirms the expectation of a significantly lower pKa value in comparison with that of H2S/HS−. Furthermore, we also found that cobinamide can form a complex with HS−, the hydrogen sulfide radical, and the dimer radical SSH2−. Complex-formation is more favorable in the case of the radicals than the HS− ion. We conclude that Cbi has the potential to be a better hydrogen sulfide antidote then aquacobalamin, since it has a higher affinity for sulfide, bigger rate of complex formation and can neutralize two sulfide molecules instead of one.
Experimental Section
Materials
Diaquacobinamide was prepared as described previously by base hydrolysis of hydroxocobalamin and purification over a C18 reversed phase column.[32] All chemicals used throughout this study were of analytical reagent grade. Deionized (Millipore) or triple distilled water was used to prepare all solutions. Oxygen-free nitrogen was used to deoxygenate reagent solutions. Acetate, phosphate, borate, carbonate, MES, TES, TAPS, CHES and CAPS buffers (0.25 m) were used to control the pH as required. Stock solutions of H2S were produced by bubbling gaseous H2S from a cylinder (Linde, Hydrogen sulfide 2.5, purity >99.5 %) through oxygen-free water.[31] All experiments were performed under anaerobic conditions.
Analytical methods
The concentration of hydrogen sulfide in stock solutions was determined using the molar extinction coefficient of 7200 m−1 cm−1 at 230 nm at pH 9 (Figure S30, Supporting Information).[31] At room temperature in water, a saturated solution of H2S has a concentration of 0.1 m.
Mass spectra were recorded with a Bruker maXis™ CLOCK-TOF mass spectrometer.
Cyclic voltammograms were recorded using an autolab PGSTAT 30. All measurements were performed at room temperature under nitrogen atmosphere in a VC-2 voltammetric cell (Bioanalytical Systems) with a standard three-electrode configuration. Pt wire and a glassy carbon disk electrode (3.0 mm diameter) were used as counter and working electrodes, respectively. The potentials were referenced to an aqueous Ag/AgCl electrode (E° = 0.222 V). Acetate (0.1 m, pH 4.5) and phosphate (0.1 m, pH 6.3) buffers were used as supporting electrolytes.
1H NMR spectra were recorded on a Bruker Avance DPX300 NB spectrometer operating at 300.13 MHz. Chemical shifts were referenced internally to TSP (trimethylsilyl propionate). The apparent pH was adjusted to the desired value by adding DCl or NaOD. Samples were transferred under nitrogen atmosphere to oxygen tight NMR tubes.
Kinetic experiments
Conventional kinetic experiments were performed on a Cary 50 UV-Vis spectrophotometer under anaerobic conditions. Stopped-flow kinetic measurements at ambient pressure were performed on an Applied Photophysics Spectra Kinetic stopped-flow instrument with a 1 cm optical path length. High pressure stopped-flow experiments were performed at pressures up to 130 MPa on a custom-built instrument with n-heptane as pressure medium as described elsewhere.[33] Time-resolved spectra were recorded using the stopped-flow apparatus, equipped with a J&M TIDAS diode-array detector. The temperature of the instruments was controlled with an accuracy of ±0.1 °C.
Data were analyzed using Origin 7.5 software. Kinetic traces were usually monitored at 460, 520 and 590 nm. Most experiments were done in duplicate and the reported rate constants are the average of at least four independent experiments. The reported errors represent the standard deviation of the data.
Supplementary Material
Acknowledgments
The authors gratefully acknowledge financial support from the Council on Grants of the President of the Russian Federation for state support of young Russian researchers (project MK-1145.2012.3), Russian Foundation for Basic Research (project 11–03–00132) and the Deutsche Forschungsgemeinschaft. We appreciate the kind support of Max Dürr and Oliver Tröppner from the group of Prof. Ivana Ivanovic-Burmazovic (University of Erlangen-Nürnberg) with the mass spectrometric measurements. We also acknowledge support of the United States CounterACT Program, Office of the Director, National Institutes of Health and the National Institute of Neurological Disorders and Stroke (Grant #NS058030).
Footnotes
Supporting Information (see footnote on the first page of this article): Thirty figures including UV/Vis spectral changes registered during the reduction of (H2O)2Cbi by hydrogen sulfide at different pH, kobs as a function of temperature, cyclic voltammetry of (H2O)2Cbi(III) and the product of its reaction with H2S, and the 1H NMR spectra of (H2O)2Cbi and CH3Cbi.
Supporting information for this article is available on the http://www.eurjic.org/
References
- 1.(a) Smith RP. TAAP. 1969;15:505–515. [Google Scholar]; (b) Reiffenstein RJ, Hulbert WC, Roth SH. Annu. Rev. Pharmacol. Toxicol. 1992;32:109–134. doi: 10.1146/annurev.pa.32.040192.000545. [DOI] [PubMed] [Google Scholar]; (c) Smith RP, Gosselin RE. J. Occup. Med. 1979;21:93–97. doi: 10.1097/00043764-197902000-00008. [DOI] [PubMed] [Google Scholar]
- 2.Truong DH, Mihajlovic A, Gunness P, Hindmarsh W, O’Brien PJ. Toxicology. 2007;242:16–22. doi: 10.1016/j.tox.2007.09.009. [DOI] [PubMed] [Google Scholar]
- 3.(a) Stine RJ, Slosberg B, Beacham BE. Ann. Intern. Med. 1976;85:756–758. doi: 10.7326/0003-4819-85-6-756. [DOI] [PubMed] [Google Scholar]; (b) Smith RP, Kruszyna R, Kruszyna H. Arch. Environ. Health. 1976:166–168. doi: 10.1080/00039896.1976.10667212. [DOI] [PubMed] [Google Scholar]
- 4.Dereven’kov IA, S Salnikov D, Makarov SV, Surducan M, Silaghi-Dumitrescu R, Boss GR. J. Inorg. Biochem. 2013;125:32–39. doi: 10.1016/j.jinorgbio.2013.04.011. [DOI] [PubMed] [Google Scholar]
- 5.(a) Broderick KE, Potluri P, Zhuang S, Scheffler IE, Sharma VS, Pilz RB, Boss GR. Exp. Biol. Med. 2006;231:641–649. doi: 10.1177/153537020623100519. [DOI] [PubMed] [Google Scholar]; (b) Brenner M, Kim JG, Mahon SB, Lee J, Kreutler KA, Blackledge W, Mukai D, Patterson S, Mohammad O, Sharma VS, Boss GR. Ann. Emerg. Med. 2010;55:352–363. doi: 10.1016/j.annemergmed.2009.12.002. [DOI] [PMC free article] [PubMed] [Google Scholar]; (c) Broderick KE, Balasubramanian M, Chan A, Potluri P, Feala J, Belke DD, McCulloch A, Sharma VS, Pilz RB, Bigby TD, Boss GR. Exp. Biol. Med. 2007;232:789–798. [PubMed] [Google Scholar]; (d) Chan A, Balasubramanian M, Blackledge W, Mohammad OM, Alvarez L, Boss GR, Bigby TD. Clin. Toxicol. 2010;48:709–717. doi: 10.3109/15563650.2010.505197. [DOI] [PMC free article] [PubMed] [Google Scholar]
- 6.Salnikov DS, Kucherenko PN, Dereven’kov IA, Makarov SV, van Eldik R. Eur. J. Inorg. Chem. 2014:852–862. doi: 10.1002/ejic.201402082. [DOI] [PMC free article] [PubMed] [Google Scholar]
- 7.(a) Salnikov DS, Silaghi-Dumitrescu R, Makarov SV, van Eldik R, Boss GR. Dalton Trans. 2011;40:9831–9834. doi: 10.1039/c1dt10219b. [DOI] [PubMed] [Google Scholar]; (b) Trommel JS, Warncke K, Marzilli LG. J. Am. Chem. Soc. 2001;123:3358–3366. doi: 10.1021/ja004024h. [DOI] [PubMed] [Google Scholar]; (c) Cockle S, Hill HAO, Ridsdale S, Williams RJP. J. Chem. Soc. Dalton. 1972:229–302. [Google Scholar]; (e) Gomes J, de Castro B, Rangel M. Organometallics. 2008;27:2536–2543. [Google Scholar]
- 8.Dereven’kov IA, Salnikov DS, Shpagilev NI, Makarov SV, Tarakanova EN. Macroheterocycles. 2012;5:260–265. [Google Scholar]
- 9.Pratt JM. Inorganic Chemistry of Vitamin B12. New York: Academic Press; 1972. p. 235. [Google Scholar]
- 10.Dolphin DH, Johnson AW. 1963:293–324. [Google Scholar]
- 11.Sirovatka Dorweiler J, Matthews RG, Finke RG. Inorg. Chem. 2002;41:6217–6224. doi: 10.1021/ic010265u. [DOI] [PubMed] [Google Scholar]
- 12.Toohey JI. J. Inorg. Biochem. 1993;49:189–199. [Google Scholar]
- 13.Lexa D, Saveant J-M, Zickler J. J. Am. Chem. Soc. 1980;102:4851–4852. [Google Scholar]
- 14.Wolak M, Zahl A, Schneppensieper T, Stochel G, van Eldik R. J. Am. Chem. Soc. 2001;123:9780–9791. doi: 10.1021/ja010530a. [DOI] [PubMed] [Google Scholar]
- 15.Brodie JD, Poe M. Biochemistry. 1971;10:914–922. doi: 10.1021/bi00781a029. [DOI] [PubMed] [Google Scholar]
- 16.Marques HM, Bradley JC, Brown KL, Brooks H. J. Chem. Soc., Dalton Trans. 1993:3475–3478. [Google Scholar]
- 17.Baldwin DA, Betterton EA, Pratt JM. J. Chem. Soc., Dalton Trans. 1983:217. [Google Scholar]
- 18.Kabil O, Banerjee R. J. Biol. Chem. 2010;285:21903–21907. doi: 10.1074/jbc.R110.128363. [DOI] [PMC free article] [PubMed] [Google Scholar]
- 19.Ellis AJ, Golding RM. J. Chem. Soc. 1959:127–130. [Google Scholar]
- 20.Pavlik JW, Noll BC, Oliver AG, Schulz CE, Scheidt WR. Inorg. Chem. 2010;49:1017–1026. doi: 10.1021/ic901853p. [DOI] [PMC free article] [PubMed] [Google Scholar]
- 21.Brittain T, Yosaatmadja Y, Henty K. IUBMB Life. 2008;60:135–138. doi: 10.1002/iub.16. [DOI] [PubMed] [Google Scholar]
- 22.Ma J, Dasgupta PK, Zelder FH, Boss GR. Anal. Chim. Acta. 2012;736:78–84. doi: 10.1016/j.aca.2012.05.028. [DOI] [PMC free article] [PubMed] [Google Scholar]
- 23.Lexa D, Saveant J-M. J. Am. Chem. Soc. 1980;102:4851–4852. [Google Scholar]
- 24.Perutka J, Martell AE. Anal. Chim. Acta. 2001;435:385–391. [Google Scholar]
- 25.Lykakis IN, Ferreri C, Chatgilialoglu C. Angew. Chem. Int. Ed. 2007;46:1914–1916. doi: 10.1002/anie.200604525. [DOI] [PubMed] [Google Scholar]
- 26.Savéant J-M. Chem. Rev. 2008;108:2348–2378. doi: 10.1021/cr068079z. [DOI] [PubMed] [Google Scholar]
- 27.Stanbury DM. Adv. Inorg. Chem. 1989;33:69–138. [Google Scholar]
- 28.Zheng D, Yan L, Birke RL. Inorg. Chem. 2002;41:2548–2555. doi: 10.1021/ic010802a. [DOI] [PubMed] [Google Scholar]
- 29.Hamza MS, Zou AX, Brown KL, van Eldik R. Dalton Trans. 2003;15:2986–2991. [Google Scholar]
- 30.(a) Krack I, van Eldik R. Inorg. Chem. 1989;29:1700–1704. [Google Scholar]; (b) Krack I, van Eldik R. Inorg. Chem. 1986;25:1743–1747. [Google Scholar]; (c) van Eldik R. Inorg. Chem. 1981;21:2501–2502. [Google Scholar]; (d) Westcott TJ, Watts DW. Aust. J. Chem. 1979;32:2139–2146. A. [Google Scholar]; (e) Haim J. Am. Chem. Soc. 1965;85:1016–1017. [Google Scholar]; (f) Stranks DR. Pure Appl. Chem. 1974;38:303–323. [Google Scholar]
- 31.Hughes MN, Centelles MN, Moore KP. Free Radic. Biol. Med. 2009;47:1346–1353. doi: 10.1016/j.freeradbiomed.2009.09.018. [DOI] [PubMed] [Google Scholar]
- 32.Blackledge WC, Griesel A, Mahon SB, Brenner M, Pilz RB, Boss GR. Anal Chem. 2010;82:4216–4221. doi: 10.1021/ac100519z. [DOI] [PMC free article] [PubMed] [Google Scholar]
- 33.(a) van Eldik R, Palmer DA, Schmidt R, Kelm H. Inorg. Chim. Acta. 1981;50:131–135. [Google Scholar]; (b) van Eldik R, Gaede W, Wieland S, Kraft J, Spitzer M, Palmer DA. Rev. Sci. Instrum. 1993;64:1355–1357. [Google Scholar]
Associated Data
This section collects any data citations, data availability statements, or supplementary materials included in this article.


