

Abstract
Background: Inorganic arsenic is one of the most common naturally occurring contaminants found in the environment. Arsenic is associated with a number of health outcomes, with epigenetic modification suggested as a potential mechanism of toxicity.
Objective: Among a sample of 400 adult participants, we evaluated the association between arsenic exposure, as measured by blood and urinary total arsenic concentrations, and epigenome-wide white blood cell DNA methylation.
Methods: We used linear regression models to examine the associations between arsenic exposure and methylation at each CpG site, adjusted for sex, age, and batch. Differentially methylated loci were subsequently examined in relation to corresponding gene expression for functional evidence of gene regulation.
Results: In adjusted analyses, we observed four differentially methylated CpG sites with urinary total arsenic concentration and three differentially methylated CpG sites with blood arsenic concentration, based on the Bonferroni-corrected significance threshold of p < 1 × 10⁻⁷. Methylation of PLA2G2C (probe cg04605617) was the most significantly associated locus in relation to both urinary (p = 3.40 × 10⁻¹¹) and blood arsenic concentrations (p = 1.48 × 10⁻¹¹). Three additional novel methylation loci—SQSTM1 (cg01225779), SLC4A4 (cg06121226), and IGH (cg13651690)—were also significantly associated with arsenic exposure. Further, there was evidence of methylation-related gene regulation based on gene expression for a subset of differentially methylated loci.
Conclusions: We observed significant associations between arsenic exposure and gene-specific differential white blood cell DNA methylation, suggesting that epigenetic modifications may be an important pathway underlying arsenic toxicity. The specific differentially methylated loci identified may inform potential pathways for future interventions.
Citation: Argos M, Chen L, Jasmine F, Tong L, Pierce BL, Roy S, Paul-Brutus R, Gamble MV, Harper KN, Parvez F, Rahman M, Rakibuz-Zaman M, Slavkovich V, Baron JA, Graziano JH, Kibriya MG, Ahsan H. 2015. Gene-specific differential DNA methylation and chronic arsenic exposure in an epigenome-wide association study of adults in Bangladesh. Environ Health Perspect 123:64–71; http://dx.doi.org/10.1289/ehp.1307884
Introduction
Millions of individuals worldwide are exposed to inorganic arsenic through drinking water as well as dietary sources (Smith et al. 2000). Arsenic is a well-established human carcinogen (International Agency for Research on Cancer 2012); however, the exact mechanism by which it causes cancer has not been established (Kitchin and Conolly 2010). There is in vitro and in vivo evidence to suggest that epigenetic alterations may mediate arsenic toxicity, as recently reviewed by Reichard and Puga (2010) and Ren et al. (2011).
Several human studies have examined global DNA methylation in blood in relation to arsenic exposure using surrogate markers of global DNA methylation, such as long interspersed nucleotide element-1 (LINE-1), Alu element methylation, methyl incorporation assays, or luminometric methylation assays. The findings from those studies have largely been inconsistent and included a number of differences in exposure measures and doses across studies (Hossain et al. 2012; Intarasunanont et al. 2012; Kile et al. 2012; Lambrou et al. 2012; Majumdar et al. 2010; Pilsner et al. 2007, 2009, 2012; Tajuddin et al. 2013; Wilhelm et al. 2010). Several other studies have evaluated arsenic in relation to gene-specific DNA methylation, most frequently assessing p16 and p53 promoter methylation (Chanda et al. 2006; Chen et al. 2007; Engström et al. 2013; Hossain et al. 2012; Intarasunanont et al. 2012; Marsit et al. 2006; Zhang et al. 2007). However, relatively few epigenome-wide DNA methylation studies have been conducted to investigate epigenetic alterations of arsenic toxicity in humans, evaluating associations with arsenical skin lesion status (Seow et al. 2014; Smeester et al. 2011), urinary arsenic species (Bailey et al. 2013), in utero arsenic exposure (Kile et al. 2014; Koestler et al. 2013a), toenail arsenic concentration (Liu et al. 2014), or arsenic-related urothelial carcinomas (Yang et al. 2014). Smeester et al. (2011) examined epigenome-wide promoter DNA methylation in peripheral blood leukocytes among 16 arsenic-exposed females from Mexico in relation to skin lesion status, and observed 183 differentially methylated genes, of which 182 were hypermethylated. Bailey et al. (2013) evaluated the data of Smeester et al. (2011) in relation to urinary arsenic species and observed nominally significant differential promoter DNA methylation in 812 unique genes, of which the majority were hypomethylated compared with relative urinary arsenic metabolite species. Koestler et al. (2013a) evaluated in utero arsenic exposure in relation to epigenome-wide cord blood methylation in 134 U.S.-based individuals and observed evidence of enrichment of hypermethylated loci in CpG islands, as well as a suggested indication of endocrine-disrupting effects of arsenic through hypomethylation of ESR1 (estrogen receptor 1) and PPARGC1A (peroxisome proliferator-activated receptor gamma, coactivator 1 alpha).
The evidence noted above warrants further investigation of arsenic exposure on gene-specific DNA methylation in a comprehensive manner, and in a larger study population to identify potential mechanisms associated with arsenic-related toxicity. We conducted an epigenome-wide association study among 400 Bangladeshi individuals with manifest arsenical skin lesions to assess whether arsenic exposure level (as measured by blood arsenic and urinary total arsenic concentrations) is associated with differential white blood cell DNA methylation.
Methods
Study population. The Bangladesh Vitamin E and Selenium Trial is a 2 × 2 factorial randomized chemoprevention trial evaluating the long-term effects of vitamin E and selenium supplementation on nonmelanoma skin cancer risk (Argos et al. 2013). Participants were residents of rural communities in central Bangladesh. Eligibility criteria included age between 25 and 65 years, permanent residence in the study area, manifest arsenical skin lesions, and no prior cancer history. Between April 2006 and August 2009, a total of 7,000 individuals were enrolled into the study. Trained study physicians, blinded to participants’ arsenic exposure, conducted in-person interviews and clinical evaluations, and collected urine and blood samples from participants in their homes using structured protocols. Of participants enrolled in the study, 413 were randomly sampled for epigenome-wide methylation analyses; baseline biological specimens collected before the start of the trial intervention were used in the analyses.
The study protocol was approved by the relevant institutional review boards in the United States (The University of Chicago and Columbia University) and Bangladesh (Bangladesh Medical Research Council). Informed consent was provided by participants prior to the baseline interview of the original study.
Exposure assessment. Urinary total arsenic concentration was measured in the baseline spot urine sample by graphite furnace atomic absorption spectrometry (AAnalyst 600 spectrometer; PerkinElmer, Norwalk, CT, USA) with a detection limit of 2 μg/L, in a single laboratory (Trace Metal Core Laboratory at Columbia University) (Nixon et al. 1991). Urinary creatinine was also measured for all participants in the same laboratory by a colorimetric method based on the Jaffe reaction (Heinegård and Tiderström 1973). Urinary total arsenic was divided by creatinine to obtain a creatinine-adjusted urinary total arsenic concentration, expressed as micrograms per gram creatinine. Creatinine-adjusted urinary total arsenic, a good biomarker of aggregate ingested arsenic exposure, captures exposure from all sources including water, food, soil, and dust (Hughes 2006).
Venous whole blood samples collected at baseline were analyzed for blood arsenic concentration by inductively coupled plasma mass spectrometry (ICP-MS) using a PerkinElmer Elan DRC (dynamic reaction cell) II equipped with an AS 93+ autosampler (PerkinElmer). ICP-MS-DRC methods for metals in whole blood were developed according to published procedures (Pruszkowski et al. 1998; Stroh 1988), with modifications for blood sample preparation as suggested by the Laboratory for ICP-MS Comparison Program (Institut National de Sante Publique du Québec).
DNA methylation. DNA was extracted using DNeasy Blood kits (Qiagen, Valencia, CA, USA), and bisulfite conversion was performed using the EZ DNA Methylation Kit (Zymo Research, Irvine, CA, USA). DNA methylation was measured in 500 ng of bisulfite-converted DNA per sample using the Illumina HumanMethylation 450K BeadChip kit (Illumina, San Diego, CA, USA) according to the manufacturer’s protocol; this beadchip allows interrogation of 485,577 CpG sites per sample. The methylation score for each CpG site, represented as the β value, on a continuous scale between 0 (unmethylated) and 1 (completely methylated) was quantile normalized. Among the 413 participants for whom DNA methylation data were generated, we excluded 6 samples for which the reported sex of the participant did not correspond with predicted sex based on methylation patterns of the X and Y chromosomes, and 7 samples with > 5% of CpGs either containing missing values or having p for detection > 0.05. This resulted in 400 samples retained for analyses. We omitted individual β values that were associated with a p for detection > 0.05. We also excluded probes on the X (n = 11,232) and Y (n = 416) chromosomes, probes with missing chromosome data (mostly control probes; n = 65), and probes with > 10% missing data across samples (n = 1,932); this resulted in a total of 471,932 probes included in the statistical analyses. Quantile-normalized β values were logit transformed and adjusted for batch variability using ComBat software (Johnson et al. 2007). Based on 11 samples run in duplicate across two different plates in these experiments, the average interassay Spearman correlation coefficient (rs) was 0.987 (range, 0.974–0.993).
Gene expression. Mononuclear cells were preserved in Buffer RLT and stored at –80°C; RNA was then extracted using the RNeasy Micro Kit from QIAGEN (Valencia, CA, USA). The concentration and quality of RNA was checked on a Nanodrop 1000 spectrophotometer (Thermo Scientific, Wilmington, DE, USA). cRNA synthesis was performed using 250 ng of RNA using the Illumina TotalPrep 96 RNA Amplification kit. Gene expression was measured using the Illumina HumanHT-12-v4 BeadChip utilizing 750 ng of cRNA according to the manufacturer’s protocol. The chip contains a total of 47,231 probes covering 31,335 genes. Quantile-normalized expression values were log2 transformed and adjusted for batch variability using ComBat software (Johnson et al. 2007). Gene expression data were available for the 400 individuals included in these analyses.
Genotyping. Genotyping procedures have been described in detail previously (Pierce et al. 2012). Briefly, DNA extraction was carried out from whole blood using the QIAamp 96 DNA Blood Kit (QIAGEN, Valencia, CA, USA). Any DNA sample with a concentration < 40 ng/μL, a 260 nm/280 nm ratio outside the range of < 1.6 to ≥ 2.1 (measured by Nanodrop 1000), or fragmented DNA < 2 kb (assessed by smearing in Agilent BioAnalyzer) was excluded. Genotyping was performed using the Illumina HumanCytoSNP-12 BeadChip utilizing 250 ng DNA according to the manufacturer’s protocol. Using 257,768 genotyped single nucleotide polymorphisms (SNPs) after quality control procedures, we performed imputation using MaCH on the basis of the HapMap 3 Gujarati Indians in Houston (GIH) population (Build 36; http://hapmap.ncbi.nlm.nih.gov/downloads/phasing/2009-02_phaseIII/HapMap3_r2/), yielding 1,211,988 SNPs after quality control procedures. Genotype data were available for 393 individuals included in these analyses.
Replication study. For replication of our top differentially methylated loci, we examined associations in an independent sample of 48 Bangladeshi adult males from the ongoing Folate and Creatinine Trial (FACT), prior to intervention. No participants in this sample had manifest arsenical skin lesions. The methods used to measure and analyze DNA methylation have been described in detail by Harper et al. (2013). Briefly, the water arsenic concentration was measured for all study participants at Columbia University, as previously described (Van Geen et al. 2002), and individuals were categorized as having low (50–100 μg/L, n = 25) or high (> 100 μg/L, n = 23) exposure for statistical analyses. After Ficoll separation, DNA from peripheral blood mononuclear cells (PBMCs) was extracted using the 5 PRIME ArchivePure DNA Blood Kit (Fisher Scientific, Pittsburgh, PA, USA). Epigenome-wide methylation of PBMC DNA was measured at the Roswell Park Cancer Institute (Buffalo, NY, USA) using the Illumina HumanMethylation 450K BeadChip kit. Data were processed using a standard quality control protocol and adjusted for batch effects prior to analyses using ComBat (Johnson et al. 2007). Here, we report associations from linear regression models.
Statistical analyses. For each CpG site, a separate linear regression model was run regressing the logit-transformed β value on continuous arsenic exposure (i.e., blood arsenic or urinary total arsenic concentration), sex, and age. Here, we present model coefficients and SEs from the linear regression models comparing the 75th versus the 25th percentile of each arsenic distribution. To correct for multiple comparisons, we considered a Bonferroni-corrected (p < 1 × 10⁻⁷) significance threshold; however, we present results for all loci with p < 1 × 10⁻⁵. For differentially methylated probes with p < 1 × 10⁻⁵, we used linear regression to examine the association of methylation with corresponding RNA transcript levels of the gene containing the methylation locus, adjusted for sex, age, and urinary total arsenic concentration. Methylation and expression data were adjusted for batch effects prior to analyses using ComBat (Johnson et al. 2007).
ComBat batch-adjusted methylation data were used to infer white blood cell type fractions using the statistical method of Houseman et al. (2012). Briefly, we used 466 methylation probes previously identified to be associated with leukocyte distributions (Houseman et al. 2012) to infer the distribution of white blood cell types in our study samples. Linear regression was used to evaluate the association between quartiles of arsenic exposure, based on the distribution in our study sample, in relation to the estimated cell type fractions adjusted for sex and age.
To evaluate previously reported associations from other studies, we conducted a lookup of individual CpG loci of interest within our data set. For these analyses a CpG locus associated with p < 0.05 was considered to be statistically significant. We used the R program MethLAB v1.5 (Kilaru et al. 2012) and SAS software (SAS Institute Inc., Cary, NC, USA) to run all analyses.
Results
Characteristics of the study sample are summarized in Table 1. We ran models separately for blood and urinary total arsenic concentrations (rs = 0.91). We identified three loci that were significantly differentially methylated in relation to blood arsenic concentration based on the Bonferroni threshold p < 1 × 10⁻⁷, as shown in Figure 1. We identified four loci that were significantly differentially methylated in relation to urinary total arsenic concentration based on the Bonferroni threshold p < 1 × 10⁻⁷, as shown in Figure 2. The loci based on the Bonferroni threshold were common between the two analyses, and several overlapping associations that did not meet the strict Bonferroni threshold but that had p < 1 × 10⁻⁵ were also observed between the exposure analyses, as summarized in Table 2. Furthermore, there appeared to be enrichment for differentially methylated loci in relation to urinary and blood arsenic concentrations in ocean (isolated CpG loci in the genome) and CpG island shore regions (within 2 kb from a CpG island; see Supplemental Material, Figure S1). Only a single gene contained more than one differentially methylated locus with p < 1 × 10⁻⁵; hypermethylation of cg04605617 (chr1: 20,501,558) and cg08042135 (chr1: 20,501,758) in PLA2G2C was observed (rs = 0.53). However, after adjustment of cg08042135 by cg04605617, the associations with blood (p = 0.14) and urinary total arsenic (p = 0.24) no longer persisted. Sensitivity analyses conducted with arsenic exposure as a natural log-transformed variable did not appreciably alter the association p-values (data not shown), suggesting robust linear associations for reported loci. In addition, the methylation β values are presented by urinary total arsenic exposure quartiles in Supplemental Material, Figure S2. In general, we observed dose-dependent trends between urinary total arsenic quartiles and DNA methylation levels. Box plots looked similar for blood arsenic quartiles (data not shown).
Table 1.
Selected characteristics of the study sample.
| Characteristic | n (%) |
|---|---|
| Sex | |
| Male | 212 (53.0) |
| Female | 188 (47.0) |
| Age (years) | 43.3 ± 10.2a |
| 25–35 | 104 (26.0) |
| 36–45 | 130 (32.5) |
| 46–55 | 122 (30.5) |
| 56–65 | 44 (11.0) |
| Blood arsenic concentration (μg/L) | 9.3 ± 11.3a |
| 0.80–2.50 | 110 (27.7) |
| 2.51–4.79 | 88 (22.2) |
| 4.80–11.20 | 100 (25.2) |
| 11.21–81.60 | 99 (24.9) |
| Urinary total arsenic concentration (μg/g) | 302 ± 364.5a |
| 12.0–75.0 | 97 (24.2) |
| 75.1–139.9 | 105 (26.3) |
| 140.0–394.9 | 98 (24.5) |
| 395.0–2250.0 | 100 (25.0) |
| Values are n (%) unless otherwise noted. aMean ± SD. | |
Figure 1.
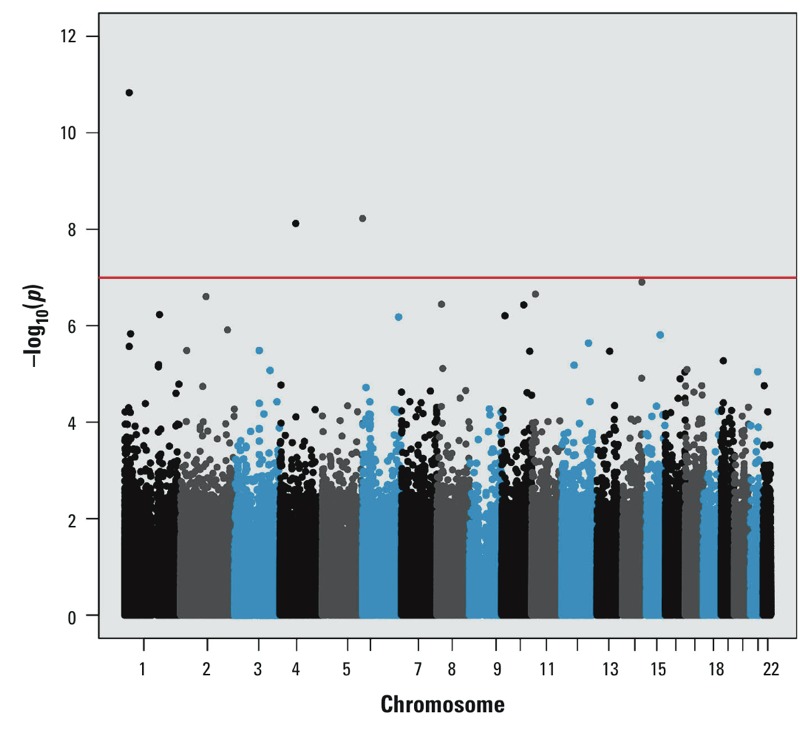
Manhattan plot for epigenome-wide association results for blood arsenic concentration. The horizontal red line corresponds to the significance threshold p = 1 × 10⁻⁷. Colors are used only to differentiate chromosomes.
Figure 2.

Manhattan plot for epigenome-wide association results for urinary total arsenic concentration. The horizontal red line corresponds to the significance threshold p = 1 × 10⁻⁷. Colors are used only to differentiate chromosomes.
Table 2.
Top 35 differentially methylated loci based on p < 1 × 10⁻⁵ in relation to blood or urinary total arsenic concentrations, sorted by chromosome (Chr).
| CpG | Chr | Position | Gene | Feature categorya | Median β value | Blood arsenic concentration | Urinary total arsenic concentration | ||||
|---|---|---|---|---|---|---|---|---|---|---|---|
| Coefficient | SE | p-Value | Coefficient | SE | p-Value | ||||||
| cg02856716 | 1 | 18,993,307 | PAX7 | Body | 0.102 | –0.014 | 0.004 | 2.28 × 10⁻⁴ | –0.019 | 0.004 | 6.46 × 10⁻⁶ |
| cg04605617b | 1 | 20,501,558 | PLA2G2C | 1st exon | 0.724 | 0.049 | 0.007 | 1.48 × 10⁻¹¹* | 0.054 | 0.008 | 3.40 × 10⁻¹¹* |
| cg08042135 | 1 | 20,501,758 | PLA2G2C | TSS200 | 0.774 | 0.019 | 0.004 | 2.71 × 10⁻⁶ | 0.020 | 0.004 | 1.37 × 10⁻⁵ |
| cg13223043 | 1 | 26,492,308 | FAM110D||ZNF593 | Intergenic | 0.448 | –0.021 | 0.004 | 1.48 × 10⁻⁶ | –0.022 | 0.005 | 6.78 × 10⁻⁶ |
| cg00857921 | 1 | 92,257,380 | TGFBR3 | Body | 0.393 | 0.016 | 0.004 | 4.12 × 10⁻⁵ | 0.021 | 0.004 | 1.98 × 10⁻⁶ |
| cg19750321 | 1 | 150,808,974 | ARNT | Body | 0.853 | 0.017 | 0.004 | 7.06 × 10⁻⁶ | 0.016 | 0.004 | 2.20 × 10⁻⁴ |
| cg03984502 | 1 | 151,805,662 | RORC | TSS1500 | 0.816 | 0.020 | 0.004 | 6.44 × 10⁻⁶ | 0.015 | 0.005 | 2.34 × 10⁻³ |
| cg07207669 | 1 | 155,102,389 | EFNA1 | Body | 0.560 | –0.023 | 0.005 | 5.90 × 10⁻⁷ | –0.025 | 0.005 | 1.27 × 10⁻⁶ |
| cg08438392 | 2 | 27,708,645 | IFT172 | Body | 0.782 | 0.020 | 0.004 | 3.27 × 10⁻⁶ | 0.022 | 0.005 | 3.66 × 10⁻⁶ |
| cg00522451 | 2 | 113,464,049 | SLC20A1||NT5DC4 | Intergenic | 0.216 | –0.025 | 0.005 | 2.49 × 10⁻⁷ | –0.028 | 0.005 | 3.16 × 10⁻⁷ |
| cg00281776c | 2 | 209,224,226 | PIKFYVE||PTH2R | Intergenic | 0.817 | –0.038 | 0.008 | 1.22 × 10⁻⁶ | –0.042 | 0.009 | 1.50 × 10⁻⁶ |
| cg25881170 | 3 | 107,810,508 | CD47 | TSS1500 | 0.473 | 0.019 | 0.004 | 3.28 × 10⁻⁶ | 0.022 | 0.005 | 1.14 × 10⁻⁶ |
| cg24262469 | 3 | 156,391,694 | TIPARP-AS1 | Body | 0.371 | 0.022 | 0.005 | 8.48 × 10⁻⁶ | 0.022 | 0.005 | 4.98 × 10⁻⁵ |
| cg06121226 | 4 | 72,134,061 | SLC4A4 | Body | 0.463 | –0.054 | 0.009 | 7.63 × 10⁻⁹* | –0.059 | 0.010 | 1.16 × 10⁻⁸* |
| cg01225779 | 5 | 179,238,473 | SQSTM1 | 5’ UTR | 0.562 | –0.042 | 0.007 | 6.00 × 10⁻⁹* | –0.048 | 0.008 | 2.37 × 10⁻⁹* |
| cg19937878 | 6 | 13,296,150 | TBC1D7 | Body | 0.820 | 0.028 | 0.007 | 1.91 × 10⁻⁵ | 0.035 | 0.007 | 1.59 × 10⁻⁶ |
| cg11230112d | 6 | 158,460,980 | SYNJ2 | Body | 0.872 | –0.029 | 0.006 | 6.60 × 10⁻⁷ | –0.029 | 0.007 | 1.54 × 10⁻⁵ |
| cg22813794 | 7 | 75,677,469 | MDH2 | TSS200; 5’ UTR | 0.039 | –0.059 | 0.014 | 5.49 × 10⁻⁵ | –0.077 | 0.016 | 1.54 × 10⁻⁶ |
| cg15310871 | 8 | 20,077,937 | ATP6V1B2 | 3’ UTR | 0.825 | –0.039 | 0.008 | 3.61 × 10⁻⁷ | –0.042 | 0.008 | 1.09 × 10⁻⁶ |
| cg22977892 | 8 | 25,907,769 | PPP2R2A | Body | 0.254 | 0.021 | 0.005 | 7.70 × 10⁻⁶ | 0.020 | 0.005 | 1.20 × 10⁻⁴ |
| cg02268561 | 10 | 15,212,066 | NMT2 | TSS1500 | 0.118 | –0.026 | 0.005 | 6.23 × 10⁻⁷ | –0.026 | 0.006 | 7.74 × 10⁻⁶ |
| cg15108641 | 10 | 99,263,321 | UBTD1 | Body | 0.365 | 0.033 | 0.006 | 3.70 × 10⁻⁷ | 0.030 | 0.007 | 3.11 × 10⁻⁵ |
| cg07545081 | 10 | 126,308,381 | FAM53B | 3’ UTR | 0.685 | 0.021 | 0.005 | 3.42 × 10⁻⁶ | 0.026 | 0.005 | 3.68 × 10⁻⁷ |
| cg02742555 | 11 | 15,200,693 | INSC | Body | 0.163 | –0.028 | 0.005 | 2.22 × 10⁻⁷ | –0.026 | 0.006 | 2.74 × 10⁻⁵ |
| cg03348792 | 12 | 53,075,482 | KRT1 | TSS1500 | 0.309 | 0.019 | 0.004 | 6.62 × 10⁻⁶ | 0.019 | 0.005 | 8.91 × 10⁻⁵ |
| cg06383241 | 12 | 116,997,023 | MAP1LC3B2 | TSS200 | 0.083 | –0.022 | 0.005 | 2.29 × 10⁻⁶ | –0.022 | 0.005 | 2.23 × 10⁻⁵ |
| cg11582226 | 13 | 77,587,297 | FBXL3 | Body | 0.756 | 0.021 | 0.004 | 3.40 × 10⁻⁶ | 0.019 | 0.005 | 1.98 × 10⁻⁴ |
| cg13651690 | 14 | 106,320,748 | IGH | Body | 0.950 | 0.035 | 0.006 | 1.24 × 10⁻⁷ | 0.039 | 0.007 | 9.16 × 10⁻⁸* |
| cg05018460 | 15 | 80,688,079 | AB240015||ARNT2 | Intergenic | 0.557 | 0.047 | 0.010 | 1.56 × 10⁻⁶ | 0.046 | 0.011 | 2.09 × 10⁻⁵ |
| cg04352288e | 16 | 87,958,408 | CA5A | Body | 0.872 | 0.047 | 0.011 | 9.20 × 10⁻⁶ | 0.056 | 0.012 | 2.60 × 10⁻⁶ |
| cg17892169 | 17 | 7,452,644 | TNFSF12-TNFSF13 | Body | 0.341 | 0.024 | 0.005 | 8.06 × 10⁻⁶ | 0.023 | 0.006 | 2.01 × 10⁻⁴ |
| cg08285388 | 17 | 27,230,177 | DHRS13 | TSS200 | 0.090 | –0.014 | 0.004 | 1.37 × 10⁻³ | –0.022 | 0.005 | 3.29 × 10⁻⁶ |
| cg13480898 | 19 | 10,195,915 | C19orf66 | TSS1500 | 0.680 | –0.023 | 0.005 | 5.35 × 10⁻⁶ | –0.026 | 0.005 | 1.63 × 10⁻⁶ |
| cg06381803 | 19 | 46,119,476 | EML2 | Body | 0.400 | –0.042 | 0.010 | 5.72 × 10⁻⁵ | –0.051 | 0.011 | 8.95 × 10⁻⁶ |
| cg26390598 | 21 | 41,032,397 | B3GALT5 | 5’ UTR | 0.340 | 0.050 | 0.011 | 9.03 × 10⁻⁶ | 0.063 | 0.012 | 5.49 × 10⁻⁷ |
| Abbreviations: TSS, transcription start site; TSS200, 200 bases from TSS; TSS1500, 1,500 bases from TSS; UTR, untranslated region. “||” indicates an intergenic region. Four probes contain SNPs with a minor allele frequency ≥ 0.01. All SNPs > 10 bases from query site. aGene feature category of the methylation locus. brs12139100. crs139141387. drs73795212. ers113904153. *p < 1 × 10⁻⁷. | |||||||||||
Among all 471,932 CpG loci evaluated, 56.6% of the methylation probes were hypermethylated (t-statistic > 0) and 43.4% were hypomethylated (t-statistic < 0) in relation to urinary total arsenic concentration. Results were similar in relation to blood arsenic concentration (data not shown). Among the top 35 differentially methylated loci, blood and urinary total arsenic levels were associated with both gene-specific DNA hypermethylation (n = 19; 54.3%) and gene-specific DNA hypomethylation (n = 16; 45.7%), as shown in Table 2 (p = 0.78 for enrichment). Furthermore, no statistically significant association of arsenic exposure was observed in relation to global methylation levels across autosomes on a genomic scale. In a global analysis evaluating the association between arsenic exposure and average β values across all available CpG sites, we observed no significant global methylation patterns for blood (p = 0.124) or urinary total arsenic (p = 0.241) concentrations.
Among the 35 differentially methylated loci with p < 1 × 10⁻⁵, 29 loci could be evaluated in the replication sample. Of these, 8 methylation loci were associated with p < 0.05, with 5 loci observed to have the same direction of effect as the discovery association (see Supplemental Material, Table S1). The strongest replication signal was observed for IGH (cg13651690; p = 5.40 × 10⁻³). The Kolmogorov test indicated that the replication p-values were significantly different from a uniform p-value distribution (p = 0.0011).
Methylation probes containing known SNPs were not removed from analyses a priori because genome-wide SNP data were available for the study sample (Pierce et al. 2012) and could be examined in stratified analyses. As shown in Table 2, among the significantly differentially methylated loci based on Bonferroni criteria, one probe contained a SNP with minor allele frequency ≥ 0.01. Methylation probe cg04605617 contained SNP rs12139100 for which genotype data were available on 363 of the 400 study participants. The A allele frequency in the study sample was 0.38. In stratified analyses, the association between blood and urinary total arsenic concentrations in relation to DNA methylation at cg04605617 was observed to be independent of the rs12139100 genotype. Among individuals with the GG genotype (n = 136), associations persisted in relation to DNA methylation for blood arsenic concentration (p = 3.08 × 10⁻⁴) and urinary total arsenic concentration (p = 6.20 × 10⁻⁵), as well as among individuals with the GA+AA genotype (n = 227) for blood arsenic concentration (p = 1.61 × 10⁻⁷) and urinary total arsenic concentration (p = 2.43 × 10⁻⁷).
We examined the correlation between white blood cell DNA methylation with corresponding PBMC gene expression for the top 35 differentially methylated probes among the 400 study participants. Gene expression signals based on RNA transcripts for the corresponding genes containing the differentially methylated loci are summarized in Table 3. Among the 35 differentially methylated loci with p < 1 × 10⁻⁵, we could evaluate corresponding RNA transcript levels from the same gene for 28 methylation loci. Of these, 15 methylation loci were significantly associated with gene expression based on p < 0.1.
Table 3.
Top 35 differentially methylated loci based on p < 1 × 10⁻⁵ in relation to peripheral blood mononuclear cell (PMBC) gene expression, sorted by chromosome (Chr).
| CpG | Chr | Position | Gene | Feature categorya | Expression probe | Probe coordinates | p-Value | Direction |
|---|---|---|---|---|---|---|---|---|
| cg02856716 | 1 | 18,993,307 | PAX7 | Body | ILMN_1835658 | 19,074,941–19,074,990 | 0.574 | + |
| ILMN_1761061 | 19,062,405–19,062,454 | 0.818 | + | |||||
| cg04605617 | 1 | 20,501,558 | PLA2G2C | 1st Exon | ILMN_3237030 | 20,501,573–20,501,622 | 0.073 | + |
| ILMN_1656867 | 20,490,548–20,490,597 | 0.324 | – | |||||
| cg08042135 | 1 | 20,501,758 | PLA2G2C | TSS200 | ILMN_1656867 | 20,490,548–20,490,597 | 0.742 | – |
| ILMN_3237030 | 20,501,573–20,501,622 | 0.758 | + | |||||
| cg13223043 | 1 | 26,492,308 | FAM110D||ZNF593 | Intergenic | NA | |||
| cg00857921 | 1 | 92,257,380 | TGFBR3 | Body | ILMN_1784287 | 92,148,163–92,148,212 | 1.620 × 10⁻⁸ | – |
| cg19750321 | 1 | 150,808,974 | ARNT | Body | ILMN_1762582 | 150,782,288–150,782,337 | 0.351 | + |
| ILMN_2347314 | 150,782,989–150,783,038 | 0.552 | – | |||||
| cg03984502 | 1 | 151,805,662 | RORC | TSS1500 | ILMN_1771126 | 151,778,991–151,779,040 | 3.001 × 10⁻⁶ | – |
| ILMN_1734366 | 151,778,901–151,778,950 | 4.770 × 10⁻⁶ | – | |||||
| ILMN_1651792 | 151,804,215–151,804,264 | 0.247 | + | |||||
| ILMN_2275399 | 151,798,406–151,798,455 | 0.992 | – | |||||
| cg07207669 | 1 | 155,102,389 | EFNA1 | Body | ILMN_2371055 | 155,107,215–155,107,264 | 0.140 | + |
| ILMN_2371053 | 155,106,804–155,106,853 | 0.272 | – | |||||
| cg08438392 | 2 | 27,708,645 | IFT172 | Body | ILMN_1784178 | 27,668,277–27,668,621 | 0.428 | – |
| cg00522451 | 2 | 113,464,049 | SLC20A1||NT5DC4 | Intergenic | NA | |||
| cg00281776 | 2 | 209,224,226 | PIKFYVE||PTH2R | Intergenic | NA | |||
| cg25881170 | 3 | 107,810,508 | CD47 | TSS1500 | ILMN_2356991 | 107,762,694–107,762,743 | 0.044 | + |
| ILMN_1771333 | 107,762,387–107,762,436 | 0.060 | + | |||||
| cg24262469 | 3 | 156,391,694 | TIPARP-AS1 | Body | ILMN_3239662 | 157,875,849–157,875,878 | 0.223 | + |
| cg06121226 | 4 | 72,134,061 | SLC4A4 | Body | ILMN_1734897 | 72,437,058–72,437,107 | 2.173 × 10⁻⁴ | + |
| ILMN_2184556 | 72,437,334–72,437,383 | 0.029 | + | |||||
| cg01225779 | 5 | 179,238,473 | SQSTM1 | 5’ UTR | NA | |||
| cg19937878 | 6 | 13,296,150 | TBC1D7 | Body | ILMN_1661622 | 13,305,354–13,305,403 | 0.567 | – |
| cg11230112 | 6 | 158,460,980 | SYNJ2 | Body | ILMN_2215119 | 158,438,833–158,438,882 | 0.752 | + |
| cg22813794 | 7 | 75,677,469 | MDH2 | TSS200; 5’ UTR | ILMN_2079004 | 75,695,852–75,695,901 | 0.867 | + |
| cg15310871 | 8 | 20,077,937 | ATP6V1B2 | 3’ UTR | ILMN_1787705 | 20,078,945–20,078,994 | 0.004 | – |
| cg22977892 | 8 | 25,907,769 | PPP2R2A | Body | NA | |||
| cg02268561 | 10 | 15,212,066 | NMT2 | TSS1500 | ILMN_2062620 | 15,147,945–15,147,994 | 0.030 | + |
| cg15108641 | 10 | 99,263,321 | UBTD1 | Body | ILMN_1794914 | 99,330,592–99,330,641 | 2.416 × 10⁻⁶ | – |
| cg07545081 | 10 | 126,308,381 | FAM53B | 3’ UTR | ILMN_2053490 | 126,308,101–126,308,150 | 0.280 | – |
| ILMN_1704571 | 126,308,260–126,308,309 | 0.834 | – | |||||
| cg02742555 | 11 | 15,200,693 | INSC | Body | ILMN_1756070 | 15,262,019–15,262,068 | 0.343 | + |
| ILMN_2340643 | 15,267,549–15,267,598 | 0.983 | + | |||||
| cg03348792 | 12 | 53,075,482 | KRT1 | TSS1500 | ILMN_1735712 | 53,068,865–53,068,914 | 0.298 | + |
| cg06383241 | 12 | 116,997,023 | MAP1LC3B2 | TSS200 | ILMN_3247613 | 115,481,580–115,481,621 | 0.005 | – |
| cg11582226 | 13 | 77,587,297 | FBXL3 | Body | ILMN_2071405 | 77,579,718–77,579,767 | 0.299 | + |
| cg13651690 | 14 | 106,320,748 | IGH | Body | NA | |||
| cg05018460 | 15 | 80,688,079 | AB240015||ARNT2 | Intergenic | NA | |||
| cg04352288 | 16 | 87,958,408 | CA5A | Body | ILMN_1731292 | 87,921,734–87,921,783 | 0.004 | + |
| cg17892169 | 17 | 7,452,644 | TNFSF12-TNFSF13 | Body | ILMN_1683700 | 7,460,967–7,461,016 | 0.022 | – |
| ILMN_2399190 | 7,462,480–7,462,529 | 0.031 | + | |||||
| ILMN_1784264 | 7,464,109–7,464,339 | 0.150 | + | |||||
| ILMN_1670188 | 7,452,806–7,453,453 | 0.335 | – | |||||
| ILMN_1680003 | 7,457,089–7,457,138 | 0.819 | + | |||||
| cg08285388 | 17 | 27,230,177 | DHRS13 | TSS200 | ILMN_1790781 | 27,224,816–27,224,865 | 0.366 | – |
| cg13480898 | 19 | 10,195,915 | C19orf66 | TSS1500 | ILMN_1750400 | 10,203,832–10,203,881 | 0.004 | + |
| cg06381803 | 19 | 46,119,476 | EML2 | Body | ILMN_3240541 | 50,804,842–50,804,886 | 0.028 | – |
| cg26390598 | 21 | 41,032,397 | B3GALT5 | 5’ UTR | ILMN_1698756 | 39,954,012–39,954,061 | 0.059 | – |
| ILMN_2378654 | 39,956,034–39,956,083 | 0.206 | – | |||||
| ILMN_1800713 | 39,956,436–39,956,485 | 0.376 | – | |||||
| Abbreviations: –, inverse association between methylation and gene expression levels; +, positive association between methylation and gene expression levels; NA, not available; TSS, transcription start site; TSS200, 200 bases from TSS; TSS1500, 1,500 bases from TSS; UTR, untranslated region. “||” indicates an intergenic region. aGene feature category of the methylation locus. | ||||||||
To evaluate the potential effect of arsenic exposure on white blood cell type proportions, we utilized estimated cell type fractions based on a validated subset of the methylation data, presented by quartiles of arsenic exposure in Table 4. We observed no notable effect of arsenic on cell type proportions, except for moderate estimated percent decreases in CD4+ T cells and natural killer (NK) cells in relation to the highest quartile of urinary total arsenic concentration as well as borderline associations (p = 0.13–0.14) in relation to the highest quartile of blood arsenic concentration.
Table 4.
Estimated change in leukocyte cell type proportions by blood and urinary total arsenic concentrations.
| Exposure | CD8+ T cells | CD4+ T cells | NK cells | B cells | Monocytes | Granulocytes |
|---|---|---|---|---|---|---|
| Blood arsenic concentration (μg/L) | ||||||
| 0.80–2.50 | Reference | Reference | Reference | Reference | Reference | Reference |
| 2.51–4.79 | 0.39 (–1.09, 1.87) | –0.57 (–1.59, 0.44) | 0.05 (–0.06, 0.15) | –0.46 (–1.18, 0.26) | 0.04 (–0.47, 0.55) | 0.55 (–1.16, 2.26) |
| 4.80–11.20 | 1.02 (–0.43, 2.47) | –0.30 (–1.29, 0.70) | 0.02 (–0.08, 0.12) | –0.39 (–1.09, 0.32) | –0.05 (–0.54, 0.45) | –0.31 (–1.99, 1.37) |
| 11.21–81.60 | 0.47 (–0.97, 1.90) | –0.75 (–1.74, 0.24) | –0.08 (–0.18, 0.02) | –0.41 (–1.11, 0.29) | 0.15 (–0.34, 0.64) | 0.61 (–1.05, 2.28) |
| Urinary total arsenic concentration (μg/g) | ||||||
| 12.0–75.0 | Reference | Reference | Reference | Reference | Reference | Reference |
| 75.1–139.9 | 0.37 (–1.08, 1.81) | –0.72 (–1.71, 0.28) | –0.08 (–0.18, 0.02) | –0.31 (–1.01, 0.39) | 0.25 (–0.24, 0.75) | 0.49 (–1.18, 2.16) |
| 140.0–394.9 | 1.21 (–0.27, 2.69) | –0.47 (–1.50, 0.55) | –0.02 (–0.13, 0.08) | –0.35 (–1.07, 0.37) | 0.20 (–0.31, 0.70) | –0.56 (–2.28, 1.15) |
| 395.0–2250.0 | 0.99 (–0.47, 2.45) | –1.18 (–2.19, –0.17)* | –0.12 (–0.22, –0.01)* | –0.68 (–1.39, 0.03) | 0.18 (–0.32, 0.68) | 0.81 (–0.88, 2.50) |
| *p < 0.05. | ||||||
Discussion
The findings of this study suggest associations of blood and urinary total arsenic concentrations with gene-specific DNA methylation changes. We identified four novel methylation loci in PLA2G2C, SQSTM1, SLC4A4, and IGH that were strongly associated with arsenic exposure (p < 1 × 10⁻⁷), as well as several suggestive associations in other gene regions. In addition, we observed that several of the differentially methylated loci were associated with corresponding gene expression levels in PBMCs.
Higher arsenic exposure was associated with increased methylation levels at cg04605617 (chr1: 20,501,558), located in the first exon of PLA2G2C. This locus was moderately associated with increased gene expression of PLA2G2C (ILMN_3237030, p = 0.073). PLA2G2C encodes a calcium-dependent phospholipase, which is an enzyme involved in the hydrolysis of phospholipids into free fatty acids and lysophospholipids. These lipid mediators have diverse biological functions relevant for cancer progression, including roles in inflammation and cell growth, signaling, and death (Dennis et al. 2011; Scott et al. 2010). Notably, phospholipase A2 enzymes have been shown to be induced by skin carcinogens (e.g., phorbol ester, ultraviolet B light), which ultimately leads to prostaglandin synthesis via cyclooxygenase-2 (COX2) leading to increased keratinocyte proliferation and skin carcinogenesis (Bowden 2004; Kast et al. 1993). Arsenic is an established skin carcinogen, with evidence from animal studies suggesting overexpression of COX2 associated with arsenic exposure (Ouyang et al. 2007; Tokar et al. 2011; Trouba and Germolec 2004).
Higher arsenic exposure was associated with decreased methylation levels at the cg01225779 locus (chr5: 179,238,473), located in the 5´ untranslated region (UTR) of SQSTM1. SQSTM1 encodes a protein that binds ubiquitin and regulates activation of the nuclear factor kappa-B (NF-κB) signaling pathway. SQSTM1 has been implicated in a number of diseases including neurodegenerative diseases, cancer, obesity, and insulin resistance (Geetha et al. 2012). In vitro studies have shown that arsenic induces the NF-κB pathway and may be a potential mechanism for skin carcinogenesis (Liao et al. 2004; Zuo et al. 2012).
Higher arsenic exposure was associated with decreased methylation levels at the cg06121226 locus (chr4: 72,134,061). This locus, located in the body of SLC4A4, was strongly associated with increased gene expression of SLC4A4 (ILMN_2356991, p = 2.173 × 10⁻⁴ and ILMN_2184556, p = 0.029). SLC4A4 encodes a sodium bicarbonate cotransporter involved in the regulation of bicarbonate secretion and absorption, as well as intracellular pH. Mutations in this gene have been associated with hypertension (Yang et al. 2012), a well-established health outcome associated with arsenic exposure (Abhyankar et al. 2012).
Higher arsenic exposure was also associated with increased methylation levels at the cg13651690 locus (chr14: 106,320,748), located in the body of IGH. The immunoglobulin heavy locus includes variable (V), diversity (D), joining (J), and constant (C) segments of immunoglobulins. Translocations in this region have been implicated in lymphoma (Guais et al. 2004). Arsenic exposure has been associated with elevated serum immunoglobulins (Islam et al. 2007), which may be involved in skin carcinogenesis (Wiemels et al. 2011). Furthermore, we observed significant replication of this locus in an independent study sample in relation to water arsenic concentration.
The biological implications of these findings must be further explored with regard to their role in various mechanisms of arsenic toxicity and arsenic-related disease outcomes. Chronic exposure to arsenic in drinking water has been associated with a multitude of health effects, including increased risks of cancer, cardiovascular disease, peripheral neuropathy, and respiratory diseases (Brouwer et al. 1992; Chen et al. 1992; Milton and Rahman 2002; Navas-Acien et al. 2005), as well as a possible association with diabetes (Argos et al. 2013; Navas-Acien et al. 2006). Future studies should be designed to evaluate phenotype-specific methylation patterns in arsenic-exposed populations. In addition, we found that the magnitude of differential methylation at each locus associated with arsenic exposure was small, although similar in size to estimated effects previously reported for arsenic and other environmental exposures (Joubert et al. 2012; Koestler et al. 2013a). The biological implications of relatively small changes in DNA methylation need to be elucidated further.
Among the seven epigenome-wide studies regarding arsenic-related traits published to date (Bailey et al. 2013; Kile et al. 2014; Koestler et al. 2013a; Liu et al. 2014; Seow et al. 2014; Smeester et al. 2011; Yang et al. 2014), only two of the studies did not use the Illumina platform for measurement of DNA methylation (Bailey et al. 2013; Smeester et al. 2011). In the present study, we observed no overlap between our top 35 differentially methylated loci and the top signals previously reported for other arsenic-related traits among studies that used the Illumina methylation array, although none of these prior studies identified statistically differentially methylated loci based on a Bonferroni threshold (p < 1 × 10⁻⁷). We also conducted a lookup of the top reported CpG signals from the previously published studies in our data set (see Supplemental Material, Table S2). Nominally significant associations in our data set have previously been reported for AGAP2 cg11511175 and RHBDF1 cg03333116 in relation to arsenical skin lesion status (Seow et al. 2014); ELL cg22489759 and SNRNP200 cg00088989 in relation to toenail arsenic concentration (Liu et al. 2014); and RIN2 cg03512414, SLC12A6 cg11293029, CBFA2T3 cg09051215, and CCDC73 cg01717164 in relation to in utero arsenic exposure (Koestler et al. 2013a).
Furthermore, we evaluated the methylation of genes that were previously reported in candidate promoter methylation studies (Banerjee et al. 2013; Chanda et al. 2013; Gribble et al. 2014; Hossain et al. 2012; Intarasunanont et al. 2012) using a lookup approach in our data set for DAPK1, CDKN2A (P16), GMDS, C10orf32/AS3MT, RASSF1, PPARG, TP53, and MLH1 (see Supplemental Material, Table S3). Our data provide supporting evidence for differential methylation specifically in the promoter regions of CDKN2A (cg03079681), RASSF1 (cg06117233), TP53 (cg05479194, cg02855142, cg08119584, and cg01620719), and MLH1 (cg11291081 and cg05670953) in relation to arsenic exposure (see Supplemental Material, Table S3). Given the notable differences in arsenic toxicity constructs, arsenic exposure levels, and participant populations across published studies, future research is needed to further synthesize the existing evidence and elucidate the role of epigenetic mechanisms in relation to arsenic exposure and related diseases.
This study has several potential limitations. We measured DNA methylation in total white blood cells, which comprise various leukocyte subtypes known to be associated with differential methylation signatures (Adalsteinsson et al. 2012; Reinius et al. 2012). If arsenic exposure was associated with a substantial shift in leukocyte subtypes, then our analyses of DNA methylation in white blood cells may be confounded due to differences in cell type proportions. Because frozen unfractioned blood was used in these experiments, we could not evaluate the association between arsenic and cell type fractions directly. Therefore, we utilized a novel statistical method to infer expected cell type fractions in our study samples based on a validated subset of methylation markers as a surrogate measure (Houseman et al. 2012); the assumptions of the statistical method have been described elsewhere (Koestler et al. 2013a, 2013b). Based on these analyses, arsenic did not appear to be strongly associated with cell-type shifts, except for associations of the highest quartile of urinary total arsenic concentration with decreased CD4+ T and NK cell fractions. Therefore, we do not believe that the results observed in our analyses can be fully explained through an immunotoxic pathway of arsenic.
Another potential consideration for the findings of our study is that all participants had manifest arsenic skin lesions, which is a proxy for both chronic arsenic exposure and genetic susceptibility to arsenic toxicity. Because genotype is known to influence DNA methylation patterns (Tycko 2010), it is possible that the associations observed in our study may not be generalizable to populations without skin lesions. However, individuals with arsenical skin lesions are at increased risk of developing arsenic-related cancers and other disease conditions; therefore, the results of this study offer valuable insight into potential mechanistic pathways related to arsenic toxicity and carcinogenesis. Another potential limitation is that we did not validate the methylation signals identified with the Illumina platform using additional confirmatory methods. Because previously published studies have indicated very good concordance of the Illumina 450K platform with pyrosequencing data (Roessler et al. 2012), we did not pursue validation methods.
The major strengths of the present study are the relatively large size of the study sample, the multiple measures of arsenic exposure, the broad exposure range, and the availability of epigenome-wide methylation data, as well as genome-wide expression and genetic data from the study sample. Whereas previous studies have demonstrated an association between arsenic exposure and DNA methylation, we were also able to evaluate potentially functional gene regulation associated with the differentially methylated loci.
Conclusions
Arsenic exposure was associated with differential gene-specific white blood cell DNA methylation at several novel loci. We also observed functional evidence of gene deregulation that corresponded with differential methylation at a subset of these loci. The clinical implications of these findings in arsenic-exposed populations require further investigation.
Supplemental Material
Acknowledgments
We thank D. Koestler for assistance and helpful discussion regarding the cell type deconvolution analyses.
Footnotes
This work was supported by the National Institutes of Health, grant R01 CA107431.
The authors declare they have no actual or potential competing financial interests.
References
- Abhyankar LN, Jones MR, Guallar E, Navas-Acien A.2012Arsenic exposure and hypertension: a systematic review. Environ Health Perspect 120494–500.; 10.1289/ehp.1103988 [DOI] [PMC free article] [PubMed] [Google Scholar]
- Adalsteinsson BT, Gudnason H, Aspelund T, Harris TB, Launer LJ, Eiriksdottir G, et al. 2012Heterogeneity in white blood cells has potential to confound DNA methylation measurements. PloS One 7e46705; 10.1371/journal.pone.0046705 [DOI] [PMC free article] [PubMed] [Google Scholar]
- Argos M, Rahman M, Parvez F, Dignam J, Islam T, Quasem I, et al. Baseline comorbidities in a skin cancer prevention trial in Bangladesh. Eur J Clin Invest. 2013;43:579–588. doi: 10.1111/eci.12085. [DOI] [PMC free article] [PubMed] [Google Scholar]
- Bailey KA, Wu MC, Ward WO, Smeester L, Rager JE, García-Vargas G, et al. Arsenic and the epigenome: interindividual differences in arsenic metabolism related to distinct patterns of DNA methylation. J Biochem Mol Toxicol. 2013;27:106–115. doi: 10.1002/jbt.21462. [DOI] [PMC free article] [PubMed] [Google Scholar]
- Banerjee N, Paul S, Sau TJ, Das JK, Bandyopadhyay A, Banerjee S, et al. Epigenetic modifications of DAPK and p16 genes contribute to arsenic-induced skin lesions and nondermatological health effects. Toxicol Sci. 2013;135:300–308. doi: 10.1093/toxsci/kft163. [DOI] [PubMed] [Google Scholar]
- Bowden GT. Prevention of non-melanoma skin cancer by targeting ultraviolet-B-light signalling. Nat Rev Cancer. 2004;4:23–35. doi: 10.1038/nrc1253. [DOI] [PubMed] [Google Scholar]
- Brouwer OF, Onkenhout W, Edelbroek PM, de Kom JF, de Wolff FA, Peters AC. Increased neurotoxicity of arsenic in methylenetetrahydrofolate reductase deficiency. Clin Neurol Neurosurg. 1992;94:307–310. doi: 10.1016/0303-8467(92)90179-7. [DOI] [PubMed] [Google Scholar]
- Chanda S, Dasgupta UB, Guhamazumder D, Gupta M, Chaudhuri U, Lahiri S, et al. DNA hypermethylation of promoter of gene p53 and p16 in arsenic-exposed people with and without malignancy. Toxicol Sci. 2006;89:431–437. doi: 10.1093/toxsci/kfj030. [DOI] [PubMed] [Google Scholar]
- Chanda S, Dasgupta UB, Mazumder DG, Saha J, Gupta B.2013Human GMDS gene fragment hypermethylation in chronic high level of arsenic exposure with and without arsenic induced cancer. Springerplus 2557; 10.1186/2193-1801-2-557 [DOI] [PMC free article] [PubMed] [Google Scholar]
- Chen CJ, Chen CW, Wu MM, Kuo TL. Cancer potential in liver, lung, bladder and kidney due to ingested inorganic arsenic in drinking water. Br J Cancer. 1992;66:888–892. doi: 10.1038/bjc.1992.380. [DOI] [PMC free article] [PubMed] [Google Scholar]
- Chen WT, Hung WC, Kang WY, Huang YC, Chai CY. Urothelial carcinomas arising in arsenic-contaminated areas are associated with hypermethylation of the gene promoter of the death-associated protein kinase. Histopathology. 2007;51:785–792. doi: 10.1111/j.1365-2559.2007.02871.x. [DOI] [PubMed] [Google Scholar]
- Dennis EA, Cao J, Hsu YH, Magrioti V, Kokotos G. Phospholipase A2 enzymes: physical structure, biological function, disease implication, chemical inhibition, and therapeutic intervention. Chem Rev. 2011;111:6130–6185. doi: 10.1021/cr200085w. [DOI] [PMC free article] [PubMed] [Google Scholar]
- Engström KS, Hossain MB, Lauss M, Ahmed S, Raqib R, Vahter M, et al. 2013Efficient arsenic metabolism—the AS3MT haplotype is associated with DNA methylation and expression of multiple genes around AS3MT. PloS One 8e53732; 10.1371/journal.pone.0053732 [DOI] [PMC free article] [PubMed] [Google Scholar]
- Geetha T, Vishwaprakash N, Sycheva M, Babu JR. Sequestosome 1/p62: across diseases. Biomarkers. 2012;17:99–103. doi: 10.3109/1354750X.2011.653986. [DOI] [PubMed] [Google Scholar]
- Gribble MO, Tang WY, Shang Y, Pollak J, Umans JG, Francesconi KA, et al. Differential methylation of the arsenic (III) methyltransferase promoter according to arsenic exposure. Arch Toxicol. 2014;88:275–282. doi: 10.1007/s00204-013-1146-x. [DOI] [PMC free article] [PubMed] [Google Scholar]
- Guais A, Solhonne B, Melaine N, Guellaen G, Bulle F. Goliath, a ring-H2 mitochondrial protein, regulated by luteinizing hormone/human chorionic gonadotropin in rat Leydig cells. Biol Reprod. 2004;70:204–213. doi: 10.1095/biolreprod.103.018820. [DOI] [PubMed] [Google Scholar]
- Harper KN, Peters BA, Gamble MV. Batch effects and pathway analysis: two potential perils in cancer studies involving DNA methylation array analysis. Cancer Epidemiol Biomarkers Prev. 2013;22:1052–1060. doi: 10.1158/1055-9965.EPI-13-0114. [DOI] [PMC free article] [PubMed] [Google Scholar]
- Heinegård D, Tiderström G. Determination of serum creatinine by a direct colorimetric method. Clin Chim Acta. 1973;43:305–310. doi: 10.1016/0009-8981(73)90466-x. [DOI] [PubMed] [Google Scholar]
- Hossain MB, Vahter M, Concha G, Broberg K. Environmental arsenic exposure and DNA methylation of the tumor suppressor gene p16 and the DNA repair gene MLH1: effect of arsenic metabolism and genotype. Metallomics. 2012;4:1167–1175. doi: 10.1039/c2mt20120h. [DOI] [PubMed] [Google Scholar]
- Houseman EA, Accomando WP, Koestler DC, Christensen BC, Marsit CJ, Nelson HH, et al. 2012DNA methylation arrays as surrogate measures of cell mixture distribution. BMC Bioinformatics 1386; 10.1186/1471-2105-13-86 [DOI] [PMC free article] [PubMed] [Google Scholar]
- Hughes MF.2006Biomarkers of exposure: a case study with inorganic arsenic. Environ Health Perspect 1141790–1796.; 10.1289/ehp.9058 [DOI] [PMC free article] [PubMed] [Google Scholar]
- Intarasunanont P, Navasumrit P, Waraprasit S, Chaisatra K, Suk WA, Mahidol C, et al. 2012Effects of arsenic exposure on DNA methylation in cord blood samples from newborn babies and in a human lymphoblast cell line. Environ Health 1131; 10.1186/1476-069X-11-31 [DOI] [PMC free article] [PubMed] [Google Scholar]
- International Agency for Research on Cancer. Arsenic, Metals, Fibres, and Dusts. IARC Monogr Eval Carcinog Risks Hum. 2012;100C:11–465. Available: http://monographs.iarc.fr/ENG/Monographs/vol100C/mono100C.pdf [accessed 5 December 2014] [PMC free article] [PubMed] [Google Scholar]
- Islam LN, Nabi AH, Rahman MM, Zahid MS. Association of respiratory complications and elevated serum immunoglobulins with drinking water arsenic toxicity in human. J Environ Sci Health A Tox Hazard Subst Environ Eng. 2007;42:1807–1814. doi: 10.1080/10934520701566777. [DOI] [PubMed] [Google Scholar]
- Johnson WE, Li C, Rabinovic A. Adjusting batch effects in microarray expression data using empirical Bayes methods. Biostatistics. 2007;8:118–127. doi: 10.1093/biostatistics/kxj037. [DOI] [PubMed] [Google Scholar]
- Joubert BR, Håberg SE, Nilsen RM, Wang X, Vollset SE, Murphy SK, et al. 2012450K epigenome-wide scan identifies differential DNA methylation in newborns related to maternal smoking during pregnancy. Environ Health Perspect 1201425–1431.; 10.1289/ehp.1205412 [DOI] [PMC free article] [PubMed] [Google Scholar]
- Kast R, Fürstenberger G, Marks F. Phorbol ester TPA- and bradykinin-induced arachidonic acid release from keratinocytes is catalyzed by a cytosolic phospholipase A2 (cPLA2). J Invest Dermatol. 1993;101:567–572. doi: 10.1111/1523-1747.ep12366000. [DOI] [PubMed] [Google Scholar]
- Kilaru V, Barfield RT, Schroeder JW, Smith AK, Conneely KN. MethLAB: a graphical user interface package for the analysis of array-based DNA methylation data. Epigenetics. 2012;7:225–229. doi: 10.4161/epi.7.3.19284. [DOI] [PMC free article] [PubMed] [Google Scholar]
- Kile ML, Baccarelli A, Hoffman E, Tarantini L, Quamruzzaman Q, Rahman M, et al. 2012Prenatal arsenic exposure and DNA methylation in maternal and umbilical cord blood leukocytes. Environ Health Perspect 1201061–1066.; 10.1289/ehp.1104173 [DOI] [PMC free article] [PubMed] [Google Scholar]
- Kile ML, Houseman EA, Baccarelli A, Quamruzzaman Q, Rahman M, Mostofa G, et al. Effect of prenatal arsenic exposure on DNA methylation and leukocyte subpopulations in cord blood. Epigenetics. 2014;9:774–782. doi: 10.4161/epi.28153. [DOI] [PMC free article] [PubMed] [Google Scholar]
- Kitchin KT, Conolly R. Arsenic-induced carcinogenesis—oxidative stress as a possible mode of action and future research needs for more biologically based risk assessment. Chem Res Toxicol. 2010;23:327–335. doi: 10.1021/tx900343d. [DOI] [PubMed] [Google Scholar]
- Koestler DC, Avissar-Whiting M, Houseman EA, Karagas MR, Marsit CJ.2013aDifferential DNA methylation in umbilical cord blood of infants exposed to low levels of arsenic in utero. Environ Health Perspect 121971–977.; 10.1289/ehp.1205925 [DOI] [PMC free article] [PubMed] [Google Scholar]
- Koestler DC, Christensen B, Karagas MR, Marsit CJ, Langevin SM, Kelsey KT, et al. Blood-based profiles of DNA methylation predict the underlying distribution of cell types: a validation analysis. Epigenetics. 2013b;8:816–826. doi: 10.4161/epi.25430. [DOI] [PMC free article] [PubMed] [Google Scholar]
- Lambrou A, Baccarelli A, Wright RO, Weisskopf M, Bollati V, Amarasiriwardena C, et al. Arsenic exposure and DNA methylation among elderly men. Epidemiology. 2012;23:668–676. doi: 10.1097/EDE.0b013e31825afb0b. [DOI] [PMC free article] [PubMed] [Google Scholar]
- Liao WT, Chang KL, Yu CL, Chen GS, Chang LW, Yu HS. Arsenic induces human keratinocyte apoptosis by the FAS/FAS ligand pathway, which correlates with alterations in nuclear factor-κB and activator protein-1 activity. J Invest Dermatol. 2004;122:125–129. doi: 10.1046/j.0022-202X.2003.22109.x. [DOI] [PubMed] [Google Scholar]
- Liu X, Zheng Y, Zhang W, Zhang X, Lioyd-Jones DM, Baccarelli AA, et al. Blood methylomics in response to arsenic exposure in a low-exposed US population. J Expo Sci Environ Epidemiol. 2014;24:145–149. doi: 10.1038/jes.2013.89. [DOI] [PMC free article] [PubMed] [Google Scholar]
- Majumdar S, Chanda S, Ganguli B, Mazumder DN, Lahiri S, Dasgupta UB. Arsenic exposure induces genomic hypermethylation. Environ Toxicol. 2010;25:315–318. doi: 10.1002/tox.20497. [DOI] [PubMed] [Google Scholar]
- Marsit CJ, Karagas MR, Danaee H, Liu M, Andrew A, Schned A, et al. Carcinogen exposure and gene promoter hypermethylation in bladder cancer. Carcinogenesis. 2006;27:112–116. doi: 10.1093/carcin/bgi172. [DOI] [PubMed] [Google Scholar]
- Milton AH, Rahman M. Respiratory effects and arsenic contaminated well water in Bangladesh. Int J Environ Health Res. 2002;12:175–179. doi: 10.1080/09603120220129346. [DOI] [PubMed] [Google Scholar]
- Navas-Acien A, Sharrett AR, Silbergeld EK, Schwartz BS, Nachman KE, Burke TA, et al. Arsenic exposure and cardiovascular disease: a systematic review of the epidemiologic evidence. Am J Epidemiol. 2005;162:1037–1049. doi: 10.1093/aje/kwi330. [DOI] [PubMed] [Google Scholar]
- Navas-Acien A, Silbergeld EK, Streeter RA, Clark JM, Burke TA, Guallar E.2006Arsenic exposure and type 2 diabetes: a systematic review of the experimental and epidemiological evidence. Environ Health Perspect 114641–648.; 10.1289/ehp.8551 [DOI] [PMC free article] [PubMed] [Google Scholar]
- Nixon DE, Mussmann GV, Eckdahl SJ, Moyer TP. Total arsenic in urine: palladium-persulfate vs nickel as a matrix modifier for graphite furnace atomic absorption spectrophotometry. Clin Chem. 1991;37:1575–1579. [PubMed] [Google Scholar]
- Ouyang W, Zhang D, Ma Q, Li J, Huang C.2007Cyclooxygenase-2 induction by arsenite through the IKKβ/NFκB pathway exerts an antiapoptotic effect in mouse epidermal Cl41 cells. Environ Health Perspect 115513–518.; 10.1289/ehp.9588 [DOI] [PMC free article] [PubMed] [Google Scholar]
- Pierce BL, Kibriya MG, Tong L, Jasmine F, Argos M, Roy S, et al. 2012Genome-wide association study identifies chromosome 10q24.32 variants associated with arsenic metabolism and toxicity phenotypes in Bangladesh. PLoS Genet 8e1002522; 10.1371/journal.pgen.1002522 [DOI] [PMC free article] [PubMed] [Google Scholar]
- Pilsner JR, Hall MN, Liu X, Ilievski V, Slavkovich V, Levy D, et al. 2012Influence of prenatal arsenic exposure and newborn sex on global methylation of cord blood DNA. PloS One 7e37147; 10.1371/journal.pone.0037147 [DOI] [PMC free article] [PubMed] [Google Scholar]
- Pilsner JR, Liu X, Ahsan H, Ilievski V, Slavkovich V, Levy D, et al. Genomic methylation of peripheral blood leukocyte DNA: influences of arsenic and folate in Bangladeshi adults. Am J Clin Nutr. 2007;86:1179–1186. doi: 10.1093/ajcn/86.4.1179. [DOI] [PubMed] [Google Scholar]
- Pilsner JR, Liu X, Ahsan H, Ilievski V, Slavkovich V, Levy D, et al. 2009Folate deficiency, hyperhomocysteinemia, low urinary creatinine, and hypomethylation of leukocyte DNA are risk factors for arsenic-induced skin lesions. Environ Health Perspect 117254–260.; 10.1289/ehp.11872 [DOI] [PMC free article] [PubMed] [Google Scholar]
- Pruszkowski E, Neubauer K, Thomas R. An overview of clinical applications by inductively coupled plasma mass spectrometry. Atom Spectrosc. 1998;19:111–115. [Google Scholar]
- Reichard JF, Puga A. Effects of arsenic exposure on DNA methylation and epigenetic gene regulation. Epigenomics. 2010;2:87–104. doi: 10.2217/epi.09.45. [DOI] [PMC free article] [PubMed] [Google Scholar]
- Reinius LE, Acevedo N, Joerink M, Pershagen G, Dahlén SE, Greco D, et al. 2012Differential DNA methylation in purified human blood cells: implications for cell lineage and studies on disease susceptibility. PloS One 7e41361; 10.1371/journal.pone.0041361 [DOI] [PMC free article] [PubMed] [Google Scholar]
- Ren X, McHale CM, Skibola CF, Smith AH, Smith MT, Zhang L.2011An emerging role for epigenetic dysregulation in arsenic toxicity and carcinogenesis. Environ Health Perspect 11911–19.; 10.1289/ehp.1002114 [DOI] [PMC free article] [PubMed] [Google Scholar]
- Roessler J, Ammerpohl O, Gutwein J, Hasemeier B, Anwar SL, Kreipe H, et al. 2012Quantitative cross-validation and content analysis of the 450k DNA methylation array from Illumina, Inc. BMC Res Notes 5210; 10.1186/1756-0500-5-210 [DOI] [PMC free article] [PubMed] [Google Scholar]
- Scott KF, Sajinovic M, Hein J, Nixdorf S, Galettis P, Liauw W, et al. Emerging roles for phospholipase A2 enzymes in cancer. Biochimie. 2010;92:601–610. doi: 10.1016/j.biochi.2010.03.019. [DOI] [PubMed] [Google Scholar]
- Seow WJ, Kile ML, Baccarelli AA, Pan WC, Byun HM, Mostofa G, et al. Epigenome-wide DNA methylation changes with development of arsenic-induced skin lesions in Bangladesh: a case–control follow-up study. Environ Mol Mutagen. 2014;55:449–456. doi: 10.1002/em.21860. [DOI] [PMC free article] [PubMed] [Google Scholar]
- Smeester L, Rager JE, Bailey KA, Guan X, Smith N, García-Vargas G, et al. Epigenetic changes in individuals with arsenicosis. Chem Res Toxicol. 2011;24:165–167. doi: 10.1021/tx1004419. [DOI] [PMC free article] [PubMed] [Google Scholar]
- Smith AH, Lingas EO, Rahman M. Contamination of drinking-water by arsenic in Bangladesh: a public health emergency. Bull World Health Organ. 2000;78:1093–1103. [PMC free article] [PubMed] [Google Scholar]
- Stroh A. Determination of Pb and Cd in whole blood using isotope dilution ICP-MS. Atom Spectrosc. 1988;14:141–143. [Google Scholar]
- Tajuddin SM, Amaral AF, Fernández AF, Rodríguez-Rodero S, Rodríguez RM, Moore LE, et al. 2013Genetic and non-genetic predictors of LINE-1 methylation in leukocyte DNA. Environ Health Perspect 121650–656.; 10.1289/ehp.1206068 [DOI] [PMC free article] [PubMed] [Google Scholar]
- Tokar EJ, Diwan BA, Ward JM, Delker DA, Waalkes MP. Carcinogenic effects of “whole-life” exposure to inorganic arsenic in CD1 mice. Toxicol Sci. 2011;119:73–83. doi: 10.1093/toxsci/kfq315. [DOI] [PMC free article] [PubMed] [Google Scholar]
- Trouba KJ, Germolec DR. Micromolar concentrations of sodium arsenite induce cyclooxygenase-2 expression and stimulate p42/44 mitogen-activated protein kinase phosphorylation in normal human epidermal keratinocytes. Toxicol Sci. 2004;79:248–257. doi: 10.1093/toxsci/kfh132. [DOI] [PubMed] [Google Scholar]
- Tycko B. Allele-specific DNA methylation: beyond imprinting. Hum Mol Genet. 2010;19:R210–R220. doi: 10.1093/hmg/ddq376. [DOI] [PMC free article] [PubMed] [Google Scholar]
- Van Geen A, Ahsan H, Horneman AH, Dhar RK, Zheng Y, Hussain I, et al. Promotion of well-switching to mitigate the current arsenic crisis in Bangladesh. Bull World Health Organ. 2002;80:732–737. [PMC free article] [PubMed] [Google Scholar]
- Wiemels JL, Wiencke JK, Li Z, Ramos C, Nelson HH, Karagas MR. Risk of squamous cell carcinoma of the skin in relation to IgE: a nested case–control study. Cancer Epidemiol Biomarkers Prev. 2011;20:2377–2383. doi: 10.1158/1055-9965.EPI-11-0668. [DOI] [PMC free article] [PubMed] [Google Scholar]
- Wilhelm CS, Kelsey KT, Butler R, Plaza S, Gagne L, Zens MS, et al. Implications of LINE1 methylation for bladder cancer risk in women. Clin Cancer Res. 2010;16:1682–1689. doi: 10.1158/1078-0432.CCR-09-2983. [DOI] [PMC free article] [PubMed] [Google Scholar]
- Yang HC, Liang YJ, Chen JW, Chiang KM, Chung CM, Ho HY, et al. 2012Identification of IGF1, SLC4A4, WWOX, and SFMBT1 as hypertension susceptibility genes in Han Chinese with a genome-wide gene-based association study. PloS One 7e32907; 10.1371/journal.pone.0032907 [DOI] [PMC free article] [PubMed] [Google Scholar]
- Yang TY, Hsu LI, Chiu AW, Pu YS, Wang SH, Liao YT, et al. Comparison of genome-wide DNA methylation in urothelial carcinomas of patients with and without arsenic exposure. Environ Res. 2014;128:57–63. doi: 10.1016/j.envres.2013.10.006. [DOI] [PubMed] [Google Scholar]
- Zhang AH, Bin HH, Pan XL, Xi XG. Analysis of p16 gene mutation, deletion and methylation in patients with arseniasis produced by indoor unventilated-stove coal usage in Guizhou, China. J Toxicol Environ Health. 2007;70:970–975. doi: 10.1080/15287390701290808. [DOI] [PubMed] [Google Scholar]
- Zuo Z, Ouyang W, Li J, Costa M, Huang C. Cyclooxygenase-2 (COX-2) mediates arsenite inhibition of UVB-induced cellular apoptosis in mouse epidermal Cl41 cells. Curr Cancer Drug Targets. 2012;12:607–616. doi: 10.2174/156800912801784802. [DOI] [PMC free article] [PubMed] [Google Scholar]
Associated Data
This section collects any data citations, data availability statements, or supplementary materials included in this article.