Abstract
Aromatic amino acid side chains have a rich role within proteins and are often central to their structure and function. Suitable isotopic labelling strategies enable studies of sub-nanosecond aromatic ring dynamics using solution NMR relaxation methods. Surprisingly, we find that the three aromatic side chains in human ubiquitin show a sharp thermal dynamical transition at ~312 K. Hydrostatic pressure has little effect on the low temperature behaviour but decreases somewhat the amplitude of motion in the high temperature regime. Thus below the transition temperature ring motion is largely librational. Above it complete ring rotation that is most consistent with a continuous rotational diffusion not requiring transient creation of a large activated free volume occurs. Molecular dynamics simulations qualitatively corroborate this view and reinforce the notion that the dynamical character of the protein interior has a much more liquid alkane-like properties than previously appreciated.
Keywords: conformational dynamics, aromatic ring motion, thermal activation, high-pressure NMR, NMR relaxation, protein dynamics
Aromatic amino acid side chains have a rich structural role within proteins[1] and are often central to their biological function, particularly in the context of molecular recognition[2] and catalysis.[3] Thus the motional character of aromatic residues would seem to be of central importance in a range of protein structure-function issues. In this context, solution NMR spectroscopy has a long history in the investigation of aromatic ring dynamics in proteins. Early investigations were largely restricted to information about motion on the millisecond to second time regime as manifested in line broadening or population exchange phenomena.[4] Symmetry considerations suggested that slowly moving Phe and Tyr rings were “flipping” about the associated χ2 torsion angle. The temperature[5] and pressure[6] dependence of the rate of ring flipping further suggested a jump-like rather than continuous diffusive motion with a high enthalpy barrier and a large activated volume. As pointed out recently,[7] experimental measurements of ring-flip rates have been limited to the handful of cases that show separate peaks for symmetry related nuclei and constitute a very small fraction of aromatic resonances that have been reported. In the past, aromatic rings that do not show line broadening or non-degenerate symmetry related resonances were generally assumed to be flipping at rates much faster than the anticipated difference in chemical shifts of the interchanged nuclei i.e. greater than 103 s−1. Absent from this classical view is insight into more restricted (i.e. librational) motion within a rotamer well.
There has been a recent renaissance of interest in the details of aromatic ring motion with the introduction of new experimental strategies that have broadened the spectrum of insight available. Particularly noteworthy is the use of supercooled water to access temperatures where aromatic ring dynamics with low activation enthalpies can be more favorably studied using line broadening and chemical exchange phenomena.[5] More recently, a number of isotopic labeling strategies have been introduced to enable relaxation studies to probe the ps-ns and μs-ms time scales.[9] These labeling strategies are designed to ameliorate confounding spin-spin interactions that have previously limited measurement of 13C-relaxation in aromatic ring systems to natural abundance.[10]
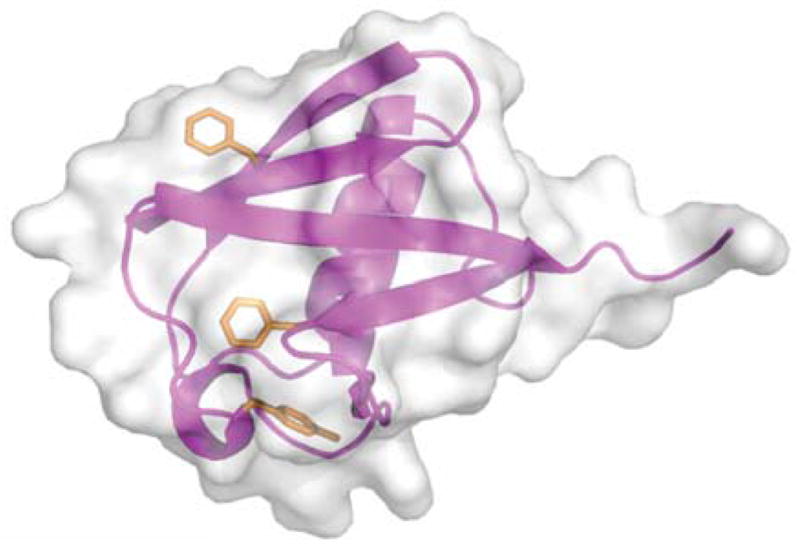
Here we use 13C-relaxation to characterize the fast internal motion of Phe and Tyr ring systems in the protein ubiquitin as a function of hydrostatic pressure and temperature. Ubiquitin is a small (76-residue) protein essential to the eukaryotic ATP-dependent protein degradation pathway.[11] For such a small protein, ubiquitin displays a surprising range of secondary structure that includes a five-stranded mixed β-sheet, α-, and 310-helices and a number of tight turns.[8] The protein also contains three aromatic residues: Phe-4, Phe-45 and Tyr-59. These residues are largely buried (Figure 1).
Figure 1.

Ribbon representation of ubiquitin (PDB code: 1UBQ)[8] with surface rendering. Shown from top to bottom as orange stick figures are the side chains of Phe-4, Phe-45 and Tyr-59. These residues have 55 Å2 (31%), 36 Å2 (21%), and 39 Å2 (21%) solvent accessible surface area. Drawn with PyMol.
For classical relaxation phenomena used to probe fast subnanosecond motions, aromatic residues present a difficult situation. In addition to the concern about the isolation of the spin interaction of interest from extraneous contributions, aromatic ring systems suffer from extensive homo- and heteronuclear scalar interactions that can also complicate relaxation data. To isolate a 1H-13C pair in the aromatic ring in an otherwise perdeuterated background we used a biosynthetic scheme based on 13C4-eyrthrose.[9b] The protein was also uniformly labeled with 15N.[12]
Measurement of 13C-relaxation was carried out using standard pulse sequences. Relaxation data was obtained at 283, 293, 303, 308, 313, 323 and 328 K at ambient pressure. Relaxation measurements were also made at elevated pressures of 1200 and 2500 bar at 283, 303 and 323 K using procedures described elsewhere.[12] The 15N- and 13C-relaxation data was analyzed using the model-free treatment of Lipari & Szabo[13] as described previously.[9b] 15N relaxation data was obtained to determine macromolecular tumbling and analyzed as described in detail elsewhere[12] (Tables S1 and S2 in the Supporting Information). Based on 15N relaxation, the determined tumbling models at 283 and 303 K at all pressures (1 bar, 1200 bar, and 2500 bar) were fully anisotropic whereas those at 313 and 323 K at all pressures were axially symmetric (Table S1). The fitted squared generalized order parameters (O2) and associated effective correlation times (τe) for the 1H-13C5 aromatic bond vectors were of high precision (Figures 2 & 3 and Tables S3 & S4).
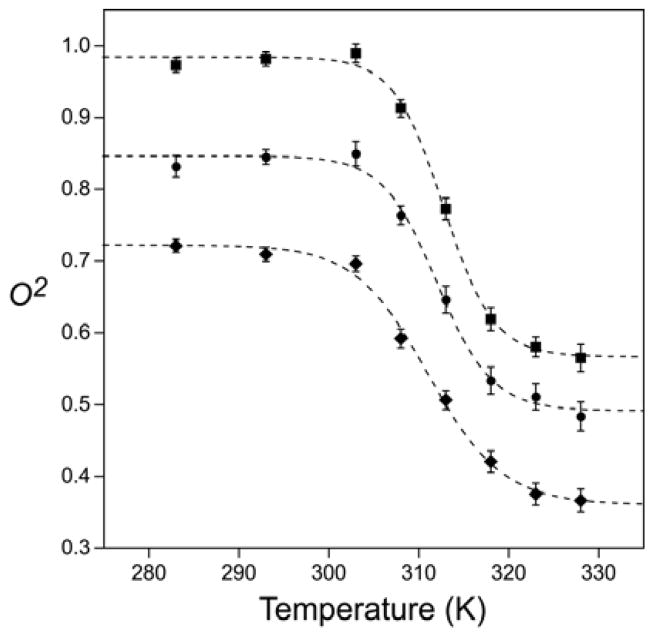
Figure 2.
Experimentally observed temperature dependence of ps-ns aromatic ring motion in ubiquitin. Lipari-Szabo model-free squared generalized order parameters of the C5-H ring bond vectors of Tyr-59 (■), Phe-4 (◆) and Phe-45 (●) determined by 13C-relaxation. The dashed lines are fitted sigmoidal curves.
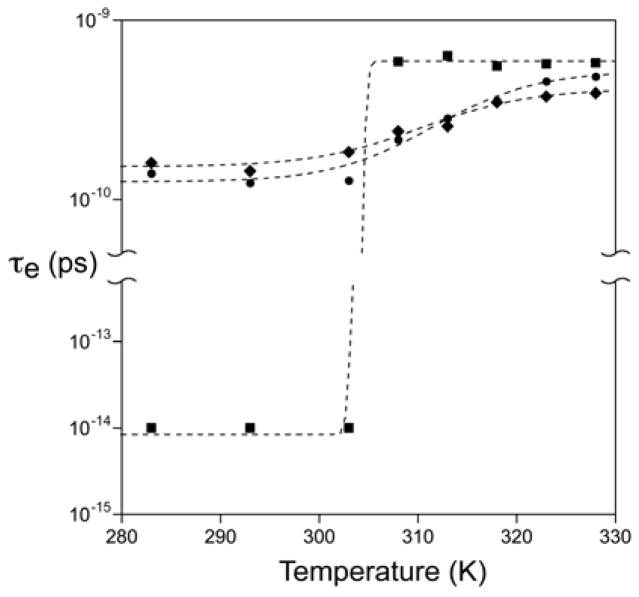
Figure 3.
Experimentally observed temperature dependence of ps-ns aromatic ring motion in ubiquitin. Semi-log plot of t he Lipari-Szabo effective correlation times of the motion of the C5-H ring bond vectors of Tyr-59 (■), Phe-4 (◆) and Phe-45 (●) determined by 13C-relaxation. The fitted errors are less than the size of the symbols. The dashed lines are fitted sigmoidal curves.
Classical NMR relaxation of the type used here probes motions on a time scale faster than macromolecular tumbling, which is on the order of 3 ns. At low temperatures, the O2 parameters of the C5-H bond vectors of Phe-4, Phe-45 and Tyr-59 are high, with that of Tyr-59 being close to the theoretical limit of 1 indicating nearly complete rigidity within the molecular frame. There is little temperature dependence of the order parameters up to about 303 K where are sharp transition to lower values begins. All three aromatic rings display this transition that is complete by 330 K. The fitted mid-point of this transition is ~312 ± 1 K, which is well below the thermal unfolding transition observed by calorimetry.[14] The sharpness of the observed dynamical transition suggests that the associated activation enthalpy is small. Indeed, there is only the barest hint of it in the pre-transition region of the differential scanning calorimetry trace of the protein.[14] It should be again noted that the protein undergoes a slight change in hydrodynamic character in this temperature range (Table S1) but this does not influence the interpretation of the observed relaxation data (Table S5).
Following the dynamical transition centered around ~310 K the order parameters of the probes for all three aromatic rings settle at significantly lower values (Figure 2). The order parameters appear to be temperature-independent above the transition. It is tempting to treat the dynamical transition as a two-state phenomenon and undertake a van’t Hoff analysis. This leads to an obviously erroneous activation enthalpy of ~30 kcal mol−1 (not shown). The temperature dependence of the effective correlation times associated with this dynamical transition indicates why a simple two-state view is inappropriate. During the transition the fitted τe values increase substantially (Figure 3). We will return to this below. The effective correlation time of Tyr-59 undergoes an extremely sharp transition with an apparent midpoint of 305 ± 2 K. Phe-4 and Phe-45 both show a more gradual transition in effective correlation times with similar midpoint temperatures (~314 ± 2 K).
The sharpness of the thermally induced transition of fast motion of the aromatic rings would suggest the onset of a qualitatively different motion. The rigid nature of the aromatic ring allows for relatively straightforward modeling of the influence of available motions about the connected χ1 and χ2 torsion angles on the obtained O2 parameter.[15] Steric considerations suggest that motion about χ1 can be neglected. At temperatures below the dynamical transition the high values of O2 strongly suggest the absence of aromatic ring rotation or flipping and that the ring is undergoing librational motion. The restricted diffusion model of Wittebort & Szabo[16] predicts libration angles of 9, 27 and 39 degrees for Tyr-59, Phe-45 and Phe-4, respectively. These are remarkably large excursions. There is very little temperature dependence indicating an essentially freely diffusive motion. The dynamical transition most likely results from the onset of rotation of the aromatic ring as this is the only reasonable physical mechanism for reducing the O2 parameter to 0.5 and below. [15] It is important to note that the motions of methyl bearing side chains generally show a small, linear dependence in this temperature range.[17]
To substantiate this interpretation molecular dynamics simulations of ubiquitin were carried out at 283, 293, 303, 308, 313 and 323 K. Simulations were performed using the NAMD simulation package, the CHARMM27 potential function, a solvent boundary of at least 5 Å of explicit TIP3P water, Particle Mesh Ewald boundary conditions, at constant temperature and pressure of 1 bar for a time of 120 ns at each temperature. Other simulation details and the protocol for calculation of O2 and τc values are described elsewhere.[18] The simulations qualitatively reproduced the effect of temperature on O2 values, but with some differences (Figure S1). Below 300 K the order parameters of the three aromatic groups are high. With increasing temperature O2 for both Phe residues decreases sharply and in concert to a low value above 300 K. However, O2 for Tyr-59 does not decrease over the temperature range 283 – 323 K, in contrast to experiment. The tyrosine hydroxyl participates both as a hydrogen bond acceptor and donor. The poor correspondence between experiment and simulation may arise from this feature. Simulations carried out at 353 K also failed to show ring flipping. In contrast, the temperature dependence of O2 for the two Phe residues is almost identical, in agreement with experiment, although the transition from high to low O2 occurs about 10 K lower. The dynamic behavior of the two Phe residues was then examined in detail. For temperatures less than 300 K O2 values are determined almost entirely by ~15° librations around the χ2 angle. No ring flips were seen in 120 ns of simulation. The libration has a very fast time scale, with τt < 1ps (Figure S2). As T increases above 300 K both Phe residues undergo ring flips with increasing frequency. Ring flipping is several orders of magnitude slower than libration (Figure S2) and only contributes significantly to relaxation at higher temperature (Figure S7). This explains why the data in Figs 2 and 3 show lower values of O2, but a larger overall τe values at higher temperature. To determine whether the parallel T-dependence of the two Phe residues indicated cooperative behavior, the correlation between ring flips was examined. For each flip in either Phe-4 or Phe-45, the time delay (positive or negative) between it and the closest flip of the other residue was determined. From this the mean delay time <δt> over the 120 ns simulation was computed. <δt> was statistically indistinguishable from that expected from two completely independent, stochastic events. No evidence of direct Phe-Phe correlation in ring flip dynamics was detectable. We next addressed the mechanism of T-activation of ring flipping. In a solid-state view of a well-packed native protein, increasing T promotes increased amplitude and frequency of packing defects, which could then permit more frequent ring flipping. Examination of both the overall packing efficiency, and the packing efficiency of Phe-4 and Ph45 side chains showed no support for this model for ring-flip activation: Temperature had no significant effect on average packing or fluctuations in packing (Figure S3). A more nuanced and physically realistic measure of packing comes from the van der Waals (vdw) contribution to the pressure virial[19] vij = rijUij, where rij and Uij are the distance and interaction potential, respectively, between atoms i and j. The repulsive and attractive parts of vdw term of the pressure virial are shown in Figure S4. There is no significant change over the temperature range of 293 K to 303 K where the ring flipping becomes active. Together the simulations support the view of aromatic rings undergoing independent, stochastic ring flipping in a ‘liquid-like’ environment.
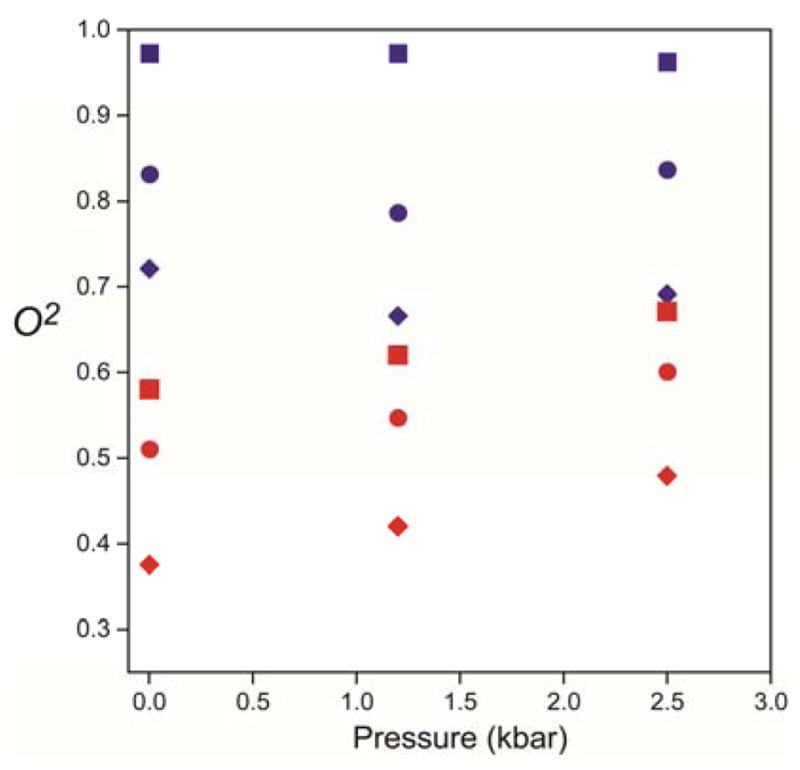
Application of hydrostatic pressure has been used in the past to investigate the volumetric properties of slow ring flipping processes in proteins.[6] In the few cases examined, the associated activation volumes are large and range from ~30–50 mL mol−1. In distinct contrast, the application of hydrostatic pressure affects the fast ring motion observed in ubiquitin very little (Figure 4). Below the thermal transition, the O2 parameters decrease slightly and correspond to reduction in effective restricted diffusion angles by three degrees or less at the highest pressure examined. The corresponding effective correlation times are similarly insensitive to applied pressure. Above the thermal transition, where fast ring flipping or rotation is present, the pressure sensitivity of the O2 parameters of all three rings is significant. It is important to remember that the order parameter is a measure of equilibrium fluctuations.[13] Thus its sensitivity to pressure indicates the presence of a significant contribution of large amplitude continuous diffusion to the high temperature motion since a pure jump-like ring flip motion interconverts two identical (for Phe) and nearly identical (for Tyr) states and would be predicted to be insensitive to pressure. Interestingly, the motions of methyl-bearing side chains closest to the aromatic rings show a non-linear experimental pressure dependence.[12]
Figure 4.

Experimentally observed pressure sensitivity of aromatic ring motion in ubiquitin above and below the thermal transition temperature for ring flipping. Lipari-Szabo model-free squared generalized order parameters of the C5-H ring bond vectors of Tyr-59 (■), Phe-4 (◆) and Phe-45 (●) determined by 13C-relaxation at 283 K (blue symbols) and 323 K (red symbols).
The associated effective correlation times for ring motion above the dynamical transition temperature are also quite responsive to hydrostatic pressure. Unfortunately, the interpretation of the effective correlation time is fraught with qualifications.[13] The effective correlation time depends both on the microscopic diffusion or jump constants and the spatial nature of the motion. Furthermore, for the diffusive motion evident here, the internal correlation function is potentially defined as an infinite sum of exponentials[13, 20] and cannot be associated with a simple rate constants. Nevertheless, the increase in effective correlation times is consistent with the thermally induced motions being somewhat slower than the more restricted motion seen below the transition temperature.
MD simulations reproduce the qualitative effects of pressure on the Phe order parameters well (Figure S5). Below the transition, temperature the order parameters are high and pressure has no significant effect. Above the transition temperature, the order parameters increase sharply as the pressure is increased to 2500 bar. This increase is not accompanied by any significant change in either the packing of the protein, globally or around the Phe residues, nor by any change in the volume fluctuations. Consideration of the pressure sensitivity of the order parameters indicates that the thermally induced dynamical transition involves the onset of a qualitatively distinct larger amplitude but diffusive rotation of the aromatic rings. This view is in contrast to that seen in slowly interconverting systems where ring rotation is characterized by discrete jumps, high activation volumes and large activation enthalpies.[6] The large scale diffusive motions identified here clearly indicate that the protein interior is more liquid-like than perhaps previously appreciated. From a liquid-state perspective, the viscous properties of the protein interior would be more important than packing or volume fluctuations. It is well known that pressures in the range 1200–2500 bar can increase the viscosity of liquid alkanes 4–5-fold with only 14–16% changes in density.[21] Similar magnitude changes operating in the apolar core of ubiquitin would account for the effects seen here. Finally, it is striking that the thermal activation of all three aromatic ring systems in ubiquitin share a common transition temperature, which corresponds to physiological temperature. The generality of this observation remains to be determined.
Experimental Section
NMR Sample Preparation
Human ubiquitin was expressed during growth on M9 minimal media prepared in 99% D2O with 1.0 g/L of 15NH4Cl and 2.0 g/L of 12C-deuterated pyruvate and supplemented at an OD600 of 0.5 with 1.0 g/L of [4-13C]-erythrose as described previously.[9b] The protein was purified as described previously[22] and yielded 9 mg/L. Labeling was confirmed by NMR (Figure S6). Uniformly 15N enriched and 13C5 aromatic-labeled ubiquitin (1.0 mM) was prepared in 50 mM sodium acetate pH 5.0, 50 mM NaCl, 0.02% (w/v) NaN3, 8% D2O.
NMR Relaxation Experiments
Uniformly 15N enriched and 13C aromatic-labeled ubiquitin (1.0 mM) was prepared in 50 mM sodium acetate pH 5.0, 50 mM NaCl, 0.02% (w/v) NaN3, 8% D2O. Relaxation experiments were carried out on Bruker Avance III NMR spectrometers equipped with cryoprobes and operating at 500 and 600 MHz (1H) essentially as described previously.[9b] 15N relaxation experiments were carried out at 10° C, 30° C, 40° C, and 50° C. 13C side-chain aromatic relaxation were carried out at 10, 20, 30, 35, 40, 45, 50 and 55 °C. The 15N R1 relaxation periods were 0.02,* 0.08, 0.15, 0.24, 0.33,* 0.44, 0.55, 0.67* and 0.80 seconds at both 500 MHz and 600 MHz. Duplicate data was collected at the asterisked delays. For 15N R2 experiments, the relaxation periods used were 0.016, 0.032,* 0.048, 0.064, 0.082,* 0.098, 0.115, 0.131,* and 0.148 seconds at 500 MHz and with relaxation periods of 0.016, 0.032,* 0.048, 0.064, 0.080,* 0.096, 0.112, 0.129,* and 0.145 seconds at 600 MHz. 13C relaxation experiments were collected in an interleaved manner with two-dimensional spectra comprised of 1024 × 48 complex points with sixty-four scans for each t1 increment using an inter-scan recycle delays of 2.5 seconds (500 MHz) and 3 seconds (600 MHz). For 13C R1 relaxation, the relaxation periods used were 0.01, 0.04,* 0.08, 0.12, 0.17,* 0.22, 0.27, 0.34,* and 0.40 seconds at 500 MHz. At 600 MHz the relaxation periods were 0.03,* 0.08, 0.15, 0.24, 0.33,* 0.44, 0.55, 0.67,* and 0.80 seconds. For 13C R1ρ relaxation the relaxation periods used at 500 MHz were 2.4, 6.8,* 12.5, 19.3, 26.9,* 35.3, 44.5, 54.4,* and 65 milliseconds and at 600 MHz the relaxation periods were 1.8,* 5.2, 9.6, 14.8, 20.7,* 27.0, 34.2, 41.9,* and 50.0 milliseconds. High-pressure NMR experiments were carried out using a 2.5 kbar rated NMR cell (3.0 mm i.d./5.0 mm o.d.) and an Xtreme-60 automated pressure generator (Daedalus Innovations, Aston, PA).
Relaxation data analysis
Backbone motion and macromolecular tumbling analysis[23] was based on 15N relaxation obtained at 10, 30, 40, and 50 °C as described elsewhere using trimmed data sets and pairwise comparisons of obtained F-values.[12] Tumbling of ubiquitin at 10 and 30 °C and all pressures examined (1 bar, 1200 bar, and 2500 bar) were fully anisotropic whereas those at 40 and 50 °C and all pressures examined were axially symmetric (see Table S1). Since the viscosity of water varies smoothly between 10 and 60 °C tumbling times at intermediate temperatures were obtained by interpolation (see Table S2). Lipari-Szabo model-free squared generalized order parameters (O2) and effective correlation times (τe) were determined using a grid search[24] approach using in-house software.[9b] An effective C-H bond length of 1.09 Å and residue-type specific chemical shift anisotropy tensors with axially symmetric and anisotropic CSA values for Phe and Tyr, respectively.[25] An effective bond N-H bond length of 1.04 Å and 15N chemical shift anisotropy tensor breadth of −170 p.p.m. were used. The precision of model-free parameters was estimated using Monte Carlo sampling based on the experimental precision of relaxation observables.
Supplementary Material
Acknowledgments
Supported by NIH grant GM102447 and, in part, by a grant from the G. Harold & Leila Y. Mathers Foundation.
Footnotes
Supporting information for this article is given via a link at the end of the document.
AJW declares a competing financial interest as a Member of Daedalus Innovations, LLC, a manufacturer of high-pressure NMR apparatus.
References
- 1.a Thomas KA, Smith GM, Thomas TB, Feldmann RJ. Proc Nat Acad Sci USA. 1982;79:4843–4847. doi: 10.1073/pnas.79.16.4843. [DOI] [PMC free article] [PubMed] [Google Scholar]; b Burley SK, Petsko GA. Science. 1985;229:23–28. doi: 10.1126/science.3892686. [DOI] [PubMed] [Google Scholar]; c Burley SK, Petsko GA. FEBS Lett. 1986;203:139–143. doi: 10.1016/0014-5793(86)80730-x. [DOI] [PubMed] [Google Scholar]; d Dill KA. Biochemistry. 1990;29:7133–7155. doi: 10.1021/bi00483a001. [DOI] [PubMed] [Google Scholar]
- 2.a Birtalan S, Fisher RD, Sidhu SS. Mol Biosystems. 2010;6:1186–1194. doi: 10.1039/b927393j. [DOI] [PubMed] [Google Scholar]; b Bogan AA, Thorn KS. J Mol Biol. 1998;280:1–9. doi: 10.1006/jmbi.1998.1843. [DOI] [PubMed] [Google Scholar]
- 3.Bartlett GJ, Porter CT, Borkakoti N, Thornton JM. J Mol Biol. 2002;324:105–121. doi: 10.1016/s0022-2836(02)01036-7. [DOI] [PubMed] [Google Scholar]
- 4.Wüthrich K, Wagner G. FEBS Lett. 1975;50:265–268. doi: 10.1016/0014-5793(75)80504-7. [DOI] [PubMed] [Google Scholar]
- 5.Skalicky JJ, Mills JL, Sharma S, Szyperski T. J Am Chem Soc. 2001;123:388–397. doi: 10.1021/ja003220l. [DOI] [PubMed] [Google Scholar]
- 6.a Wagner G. FEBS Lett. 1980;112:280–284. doi: 10.1016/0014-5793(80)80198-0. [DOI] [PubMed] [Google Scholar]; b Hattori M, Li H, Yamada H, Akasaka K, Hengstenberg W, Gronwald W, Kalbitzer HR. Protein Sci. 2004;13:3104–3114. doi: 10.1110/ps.04877104. [DOI] [PMC free article] [PubMed] [Google Scholar]
- 7.Weininger U, Respondek M, Low C, Akke M. J Phys Chem B. 2013;117:9241–9247. doi: 10.1021/jp4058065. [DOI] [PubMed] [Google Scholar]
- 8.Vijay-Kumar S, Bugg CE, Cook WJ. J Mol Biol. 1987;194:531–544. doi: 10.1016/0022-2836(87)90679-6. [DOI] [PubMed] [Google Scholar]
- 9.a Teilum K, Brath U, Lundstrom P, Akke M. J Am Chem Soc. 2006;128:2506–2507. doi: 10.1021/ja055660o. [DOI] [PubMed] [Google Scholar]; b Kasinath V, Valentine KG, Wand AJ. J Am Chem Soc. 2013;135:9560–9563. doi: 10.1021/ja4001129. [DOI] [PMC free article] [PubMed] [Google Scholar]; c Lichtenecker RJ, Weinhaupl K, Schmid W, Konrat R. J Biomol NMR. 2013;57:327–331. doi: 10.1007/s10858-013-9796-9. [DOI] [PubMed] [Google Scholar]
- 10.Palmer AG, Hochstrasser RA, Millar DP, Rance M, Wright PE. J Am Chem Soc. 1993;115:6333–6345. [Google Scholar]
- 11.Glickman MH, Ciechanover A. Physiol Rev. 2002;82:373–428. doi: 10.1152/physrev.00027.2001. [DOI] [PubMed] [Google Scholar]
- 12.Fu Y, Kasinath V, Moorman VR, Nucci NV, Hilser VJ, Wand AJ. J Am Chem Soc. 2012;134:8543–8550. doi: 10.1021/ja3004655. [DOI] [PMC free article] [PubMed] [Google Scholar]
- 13.Lipari G, Szabo A. J Am Chem Soc. 1982;104:4546–4559. [Google Scholar]
- 14.Ibarra-Molero B, Loladze VV, Makhatadze GI, Sanchez-Ruiz JM. Biochemistry. 1999;38:8138–8149. doi: 10.1021/bi9905819. [DOI] [PubMed] [Google Scholar]
- 15.Levy RM, Sheridan RP. Biophys J. 1983;41:217–221. doi: 10.1016/S0006-3495(83)84422-1. [DOI] [PMC free article] [PubMed] [Google Scholar]
- 16.Wittebort RJ, Rothgeb TM, Szabo A, Gurd FR. Proc Nat Acad Sci USA. 1979;76:1059–1063. doi: 10.1073/pnas.76.3.1059. [DOI] [PMC free article] [PubMed] [Google Scholar]
- 17.Song XJ, Flynn PF, Sharp KA, Wand AJ. Biophys J. 2007;92:L43–45. doi: 10.1529/biophysj.106.102160. [DOI] [PMC free article] [PubMed] [Google Scholar]
- 18.a Kasinath V, Sharp KA, Wand AJ. J Am Chem Soc. 2013;135:15092–15100. doi: 10.1021/ja405200u. [DOI] [PMC free article] [PubMed] [Google Scholar]; b Prabhu NV, Lee AL, Wand AJ, Sharp KA. Biochemistry. 2003;42:562–570. doi: 10.1021/bi026544q. [DOI] [PubMed] [Google Scholar]
- 19.Allen MP, Tildesley DJ. Computer Simulations of Liquids. Clarendon Press; Oxford: 1990. [Google Scholar]
- 20.Wittebort RJ, Szabo A. J Phys Chem. 1978;69:1722–1736. [Google Scholar]
- 21.Brazier DW, Freeman GR. Can J Chem. 1969;47:893–899. [Google Scholar]
- 22.Wand AJ, Urbauer JL, McEvoy RP, Bieber RJ. Biochemistry. 1996;35:6116–6125. doi: 10.1021/bi9530144. [DOI] [PubMed] [Google Scholar]
- 23.Tjandra N, Feller SE, Pastor RW, Bax A. J Am Chem Soc. 1995;117:12562–12566. [Google Scholar]
- 24.Dellwo MJ, Wand AJ. J Am Chem Soc. 1989;111:4571–4578. [Google Scholar]
- 25.Ye CH, Fu RQ, Hu JZ, Hou L, Ding SW. Magn Reson Chem. 1993;31:699–704. [Google Scholar]
Associated Data
This section collects any data citations, data availability statements, or supplementary materials included in this article.


