

Abstract
Tandem mass spectrometry (MS/MS)-based relative quantification by isobaric labeling is a useful technique to compare different metabolic expression levels in biological systems. For the first time, we have labeled primary and secondary amine-containing small molecules using 4-plex isobaric N,N-dimethyl-leucine (DiLeu) to perform relative quantification. Good labeling efficiency and quantification accuracy were demonstrated with a mixture of 12 metabolite standards including amino acids and small molecule neurotransmitters. Labeling amine-containing metabolites with DiLeu reagents also enabled the separation of polar metabolites by nanoRPLC and improved the detection sensitivity by CE-ESI-MS. The 4-plex DiLeu labeling technique combined with LC-MS/MS and CE-MS/MS platforms were applied to profile and quantify amine-containing metabolites in mouse urine. The variability of concentrations of identified metabolites in urine samples from different mouse individuals was illustrated by the ratios of reporter ion intensities acquired from online data-dependent analysis.
Introduction
Endogenous metabolites represent a diverse group of small molecules that can directly reflect enzymatic activities in the biological system. Specifically, amine-containing small molecules like amino acids and neurotransmitters serve as the basic building blocks and key regulators of biological organisms.1 The dysregulation of amine metabolites in biofluids has been studied for a number of diseases, such as Parkinson’s disease, kidney cancer, and Alzheimer’s disease.1-7 Serotonin plays important roles in the biochemistry of memory, depression, and anxiety disorder; the decline of dopamine levels has been shown to be directly related to Parkinson’s disease;6 γ-Aminobutyric acid (GABA) is the main inhibitory neurotransmitter in the central nervous system.8 Monitoring the expression levels of amine containing metabolites using hyphenated mass spectrometric techniques is essential to study the complex processes of life. However, the detection and separation of amine-containing metabolites with MS-based platforms are still challenging because of their low abundance, high polarity and poor ionization efficiency. Several strategies involve chemical derivatization of metabolites prior to C18 reversed phase (RP) LC-MS and the use of other LC-MS platforms such as hydrophilic interaction chromatography (HILIC)-MS9, 10 and ion-pairing reversed phase chromatography-MS.11, 12 Additionally, capillary zone electrophoresis (CZE) separates free metabolites based on charge-to-size ratio and has been coupled to MS for metabolomics studies.13-18
Mass spectrometry-based quantification is another key component in amine metabolite analysis. For absolute quantification, an isotopic analogue of the analyte (2H- or 13C- analogues) is spiked into samples as an internal standard.19, 20 However, the use of isotopic internal standard is usually expensive and only suitable for some targeted analyses because of the unavailability of many isotopic metabolite standards. Therefore, relative quantification through label-free or chemical derivatization approaches offers an alternative and often more useful way to compare different biological states. Determining the relative abundance of metabolites with MS-based techniques has been successfully applied to discover potential metabolic biomarkers of various human diseases.21-24
Stable isotope labeling is an accurate and high-throughput methodology for relative quantification. It has been widely used for quantitative proteomics and peptidomics and also adopted to quantify small molecules in recent years.25, 26 Stable isotope labeling can be categorized into two groups, mass-difference labeling and isobaric labeling. Mass-difference labeling, such as 12C-/13C-methyl acetimidate,27 dansylation,28, 29 and formaldehyde dimethylation,30 introduces a fixed mass difference for the same metabolite in a MS spectrum. Relative quantification is achieved by comparing extracted ion chromatogram peak areas of the heavy and light isotopic forms of the same metabolite. Isobaric labeling with TMT31, 32 and iTRAQ33, 34 tags has also been employed for the quantification of primary and secondary amine-containing metabolites. Most recently, Murphy et al.32 employed 10-plex TMT tags to measure amino acids in parallel with cellular proteins from cancer cells. Generally, isobaric labeling reagents are comprised of an isotopically-coded reporter, a balance group, and an amine reactive group. The balanced structure of each label shifts precursor mass values by the same amount upon chemical incorporation. Upon MS/MS fragmentation, the reporter is cleaved from the balance group, and each labeled sample produces a unique reporter ion whose intensity represents the relative abundance of the metabolite from the original sample.
To enrich and advance MS-based quantification with isobaric labeling, the multiplex N,N-dimethyl leucines (DiLeu) reagent was designed and synthesized in our lab with several advantages in terms of cost, labeling efficiency, quantitative accuracy, and fragmentation. 4-plex DiLeu tags (Scheme 1A) have been previously developed and utilized for the relative quantification of proteins and peptides35-38 with excellent accuracy and reproducibility. Unlike mass-difference reagents, isobaric DiLeu tags do not increase mass spectral complexity, as the same compound labeled with isobaric DiLeu tags produces a single peak in the MS scan with a mass increase of 145.14 Da. This is especially important for complex biological samples containing a variety of different compounds. Relative quantification can be achieved by comparing the intensities of reporter ions (m/z 115.1, 116.1, 117.1, 118.1) in MS/MS fragmentation. DiLeu reagents also showed increased reporter ion signal over iTRAQ.36 In addition, because of the relatively simple synthetic route, the reagents cost for synthesizing a set of 4-plex DiLeu tags (1mg) for one quantification experiment is less than $5.00, which is a significant monetary decrease compared to more expensive commercial isobaric tags like TMT (6-plex: $500) and iTRAQ (4-plex: $275).
Scheme 1.
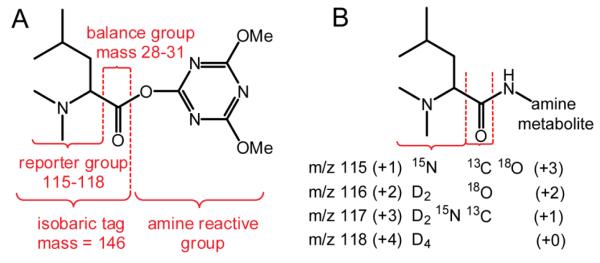
General structures of 4-plex DiLeu isobaric tag (A) and DiLeu labeled amine metabolite (B). DiLeu reagent contains an isotopically coded reporter group, a balance group, and an amine reactive group that targets the amine group of a metabolite. A new covalent bond can be formed at the amine group of a metabolite during the labeling reaction.
Herein we describe the first application of the 4-plex DiLeu tags to relative quantification of amine-containing metabolites (Scheme 1B). We demonstrated good separation and quantification of DiLeu labeled metabolites using both nanoLC-ESI-MS/MS and CE-ESI-MS/MS platforms. We further employed the MS-based DiLeu labeling strategy for the identification and relative quantification of primary and secondary amine-containing metabolites in mouse urine samples.
Experimental
Chemicals and Reagents
Optima LC/MS grade acetonitrile, methanol and water, N,N-dimethylformamide (DMF), and 4-(4, 6-dimethoxy-1, 3, 5-triazin-2-yl)-4-methylmorpholinium chloride (DMTMM) were purchased from Fisher Scientific (Fair Lawn, NJ). N-methylmorpholine (NMM) was purchased from TCI America (Tokyo, Japan). 12 Metabolite standards (histidine, valine, tyrosine, leucine, lysine, phenylalanine, tryptophan, alanine, serotonin, dopamine, γ-aminobutyric acid, and norepinephrine), 3-aminoquinoline, and triethylammonium bicarbonate (TEAB) was purchased from Sigma (St. Louis, MO). Formic acid (FA) (≥98%) was obtained from Fluka (Büchs, Switzerland). C18 and OMIX SCX Ziptips were purchased from Millipore and Agilent, respectively. Deionized water (18.2 MΩ·cm) was prepared with a Milli-Q Millipore system (Billerica, MA).
N,N-dimethylated leucine (DiLeu) synthesis and activation
4-plex DiLeu reagent synthesis was previously described by Xiang et al.36 Dry DiLeu labels were stored at −20 °C until usage. DiLeu reagents were activated to DiLeu triazine ester immediately before metabolite labeling. Each 1 mg dried DiLeu label was activated by mixing with 1.86 mg DMTMM, 0.74 μL NMM and 50 μL DMF, and then vortexed at room temperature for 1h. After activation, each isobaric DiLeu triazine ester was used separately for labeling.
Labeling metabolite standards
Stock solution containing 1mM of each metabolite standard was prepared and stored at −20 °C before use. 10 μL of diluted stock solution containing 10 μM of each metabolite was dried with a SC 110 SpeedVac concentrator (Thermo Electron Corporation, West Palm Beach, FL), redissolved in 0.5M TEAB solution, and divided into four aliquots with molar ratios of 1:1:1:1 or 1:2:5:10. Each aliquot was mixed with activated DiLeu triazine ester 115, 116, 117, or 118, respectively. For each labeling reaction, activated DiLeu reagents and metabolites mixture were reacted at a molar ratio of 20:1 to ensure efficient and complete labeling under room temperature for 2 h with shaking. The reaction was then quenched by adding 100 μL of water and shaking for 30 min. Subsequently, labeled samples were each dried in vacuo and combined at equal ratios. OMIX SCX Ziptips (10 μL) were used to remove residual labeling chemicals, with 0.1% FA in H2O used as the reconstitution and washing solutions, and 5% NH3·H2O in 30% MeOH as elution solution. The eluate was concentrated to dryness and stored at −20 °C until analysis.
Labeling urinary metabolites
Urine samples from individual mice were collected in metabolic cages and stored at −80 °C until further usage. An aliquot of 60 μL from each mouse urine sample was transferred to a 0.6 mL eppendorf tube and centrifuged at 10000g for 10 min to remove cellular debris. 50 μL of the supernatant was transferred into a new tube and diluted with 100 μL of water. Metabolite fractions of urine were obtained by using 3 kDa molecular weight cut-off filters (Millipore Amicon Ultra) to remove urinary proteins. The flow-through fraction was collected and concentrated to dryness. Dried urinary metabolites from four mice were labeled with 4-plex DiLeu reagents separately, combined at equal ratios, and cleaned up with SCX Ziptips using the same procedures described above. Labeled mouse urine sample was dried down and reconstituted in 0.1% FA in H2O for LC-MS analysis or 0.1% FA in 50% MeOH for CE-MS analysis.
Direct infusion ESI-MS and ESI-MS/MS
Mixtures of 12 DiLeu labeled metabolite standards (1:1:1:1 ratio and 1:5:2:10 ratio) were re-dissolved in 100 μL of 0.1% FA in 50% acetonitrile (ACN) solution, and directly infused into a Waters Synapt-G2 Q-TOF mass spectrometer (Waters Corp., Milford, MA) with a flow rate of 1 μL/min. Electrospray emitter tips were prepared with a Sutter P-2000 laser capillary puller (Novator, CA, USA) from 75 μm i.d., 360 μm o.d. capillary tubing (Polymicro Technologies, Phoenix, AZ, USA). The capillary voltage was set to 2.7 kV, sampling cone voltage to 20 V, extraction cone voltage to 4 V, source temperature to 70 °C, and cone gas to 30. Data were acquired in positive ESI, resolution mode, with a scan rate of 1 s/scan. MS and MS2 analysis were acquired from m/z 80-500 and m/z 100-500, respectively. MS2 analysis of each labeled metabolite was achieved by collision induced activation (CID) using argon as the collision gas with a collision energy of 30 eV and a precursor isolation window of ~3 Th. Acquired data were analyzed with MassLynx 4.1 software. A total of 118 MS/MS scans of each labeled compound were combined for the measurement of reporter ion intensity.
Reversed phase nanoLC-ESI-MS/MS
Reversed phase nanoLC-ESI-MS/MS analyses of labeled metabolite standards and mouse urine samples were conducted using a Waters nanoAcquity ultra-performance liquid chromatography (UPLC) system coupled online to a Waters Synapt-G2 Q-TOF mass spectrometer. Mobile phase A was 0.1% FA in H2O and mobile phase B was 0.1% FA in ACN. The sample was dissolved in 10 μL of 0.1% FA in H2O, and 3 μL was loaded onto a sample loop connected to a homemade C18 column (75.1 μm × 150mm, 1.7 μm, 100 Å). The 35 min binary gradient at a flow rate of 0.35 μL/min was set as follows: 0- 10 min, 0- 40% solvent B; 10- 30 min, 40%- 85% solvent B; 31- 35min, 97% solvent B. Full MS scan was acquired with a mass range of 100 ~ 800 m/z and a scan rate of 0.5 s/scan. In the selected reaction monitoring (SRM) acquisition, 12 SRM channels were developed for 12 precursor masses of DiLeu labeled metabolites. The collision energy was 30 eV and the cycle time was 0.1s for each SRM channel. In the top 5 data dependent acquisition, a survey scan was followed by three MS2 scans of each precursor ion within the top 5 intensities. The collision energy was 30 eV and precursor isolation window was ~3 Th. Dynamic exclusion was set to 60 s and 15 masses from interfering background peaks were programmed in the precursor exclusion list.
CE-ESI-MS/MS
An HP Agilent G1600AX 3D CE system was coupled with the Synapt-G2 mass spectrometer using a flow-through microvial CE-ESI-MS interface developed by Maxwell et al.39 The sample dissolved in 0.2% FA in 50% MeOH was injected into the column by applying 50 mbar for 20 s at the inlet end. 0.2% FA in 50% MeOH was used as the background electrolyte and modifier solution. During separation, 30 kV was applied at the inlet of the 80 cm long, 50 μm ID bare fused-silica capillary column, and the modifier solution was infused at 0.3 μL/min by a syringe pump. Between runs, the capillary was flushed with the background electrolyte solution for 5 min. Full MS and top 5 data dependent acquisition were conducted in positive mode with the same parameters as those in nanoLC-MS/MS.
Results and discussion
Labeling efficacy of metabolites by DiLeu reagents
Although the workflow of DiLeu labeling has already been established for peptide analysis in a previous study36, specific conditions for metabolite labeling need to be further optimized. The labeling efficiency was evaluated by directly infusing DiLeu labeled metabolite standards onto a Synapt G2 Q-TOF mass spectrometer. DiLeu activation for one hour and labeling for two hours were found to be optimal conditions for metabolite labeling. The spectral comparison between labeled and unlabeled metabolites is shown in Fig. 1 (A, B). Metabolite labeled by 4-plex DiLeu reagents showed a single peak in the MS spectrum with a mass shift of 145.14 Da compared to the unlabeled counterpart. Because lysine contains another primary amine group on its side chain, the mass shift of a completely labeled Lysine is 290.28 Da. As illustrated in Fig. 1 (A), lysine only showed a completely labeled peak (m/z 437.4). Unlabeled metabolite standard peaks were not observed in the DiLeu labeled spectrum, indicating good labeling efficiency under optimized conditions. In order to remove salts, excessive DiLeu reagents, and reaction by-products in the reaction mixture while maintaining high recovery of labeled metabolites, C18 and SCX Ziptips were employed and their clean-up performances were compared. OMIX SCX Ziptips, with an eluting solution of 5% NH3·H2O in 30% MeOH, were selected as the purification method prior to instrumental analysis.
Fig. 1.

Mass spectra of 12 DiLeu labeled (A) and unlabeled (B) metabolite standards mixture (5 μM each), and MS/MS spectrum of DiLeu labeled norepinephrine (C). The 12 metabolites include alanine (Ala), γ-aminobutyric acid (GABA), valine (Val), leucine (Leu), dopamine (DA), histidine (His), norepinephrine (NE), phenylalanine (Phe), tyrosine (Tyr), tryptophan (Trp), serotonin (5-HT), and lysine (Lys). CID collision energy for MS/MS fragmentation was 30 eV. The intensities of reporter ions (m/z 115.1. 116.1, 117.1, 118.1) were used for relative quantification.
Tandem mass spectrometry based relative quantification of isobarically labeled metabolite standards
In order to examine the accuracy and reproducibility of relative quantification, two sets of metabolite standard mixtures with known concentration ratios (1:1:1:1 and 1:5:2:10) were differentially labeled by 4-plex DiLeu and pooled together with equal ratios. Combined labeled metabolites were purified with SCX Ziptips and analyzed by direct infusion ESI-MS/MS analysis. The precursor ion of each labeled compound was isolated by the quadrupole and subjected to CID fragmentation with 30 eV collision energy. In addition to reporter ions, a neutral loss of H2O can be observed in MS/MS spectra of some labeled metabolites. An example of a MS/MS spectrum of DiLeu labeled norepinephrine is shown in Fig. 1 (C). Relative quantification of the metabolite was achieved by calculating the intensity ratios of DiLeu reporter ions (m/z 115.1, 116.1, 117.1, 118.1) produced in MS/MS fragmentation. Because of the natural 13C isotope and the isotopic impurities from synthesis reagents, the intensities of DiLeu reporter ions which are approximately 1Da apart from each other can be interfered by isotopic impurities. Raw reporter ion intensities must be corrected to account for the losses to, and gains from, other reporter ions. Purity-correction was performed in an excel spreadsheet to correct reporter ion intensities obtained from MS/MS spectra.38, 40 Correction factors and equations can be found in Fig. S1 (See supporting information). The ratios of reporter ion intensities were then calculated from the corrected values for each metabolite. The results were summarized in the box plots in Fig. 2. The median ratios measured among 12 metabolites were 1:0.92:0.89:0.88 with a theoretical ratio of 1:1:1:1, and 1:4.83:1.87:9.59 with a theoretical ratio of 1:5:2:10. Both groups showed satisfactory accuracy (within 12% error) for relative quantification. Linear dynamic range of at least one order of magnitude was also confirmed with the 1:5:2:10 ratio group. Linear regression of experimental ratios to the theoretical 1:5:2:10 ratio of each labeled metabolite showed satisfactory slope (close to 1) and linear correlation (Table 1). Examples of linear regression of labeled metabolites can be found in Fig. S2 (See supporting information).
Fig. 2.
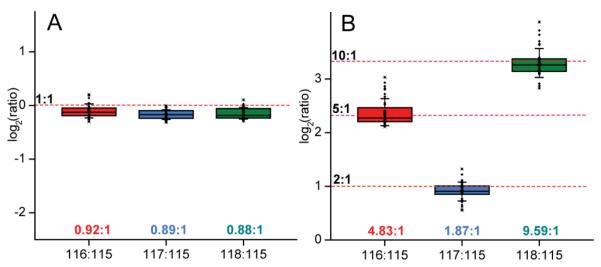
Box plots of reporter ion ratios of DiLeu labeled metabolite standards at a theoretical 1:1:1:1 ratio (A) and a 1:5:2:10 ratio (B). Each box contains 36 data points from 12 metabolite standards with three replicates, obtained from direct infusion ESI-MS/MS analysis. Box denotes 25th and 75th percentiles; line within box denotes 50th percentile; whiskers denote standard deviation.
Table 1.
Reproducibility, linearity, and sensitivity of metabolites analysis in different platforms.
| Compound | Label free metabolites in CE-MS |
Labeled metabolites in CE-MS |
Labeled metabolites in LC-MS |
Relative quantification |
||||
|---|---|---|---|---|---|---|---|---|
| R2
(linearity)a |
Migration time (min)b |
LODc
(μmol/L) |
Migration time (min)b |
LODc
(μmol/L) |
Retention time (min)b |
LODc
(μmol/L) |
R2 (linearity)d |
|
| Ala | 0.9995 | 18.85 ± 0.21 | 1.24 | 17.50 ± 0.17 | 0.16 | 16.45 ± 0.02 | 0.11 | 0.9935 |
| GABA | 0.9998 | 14.12 ± 0.13 | 0.83 | 17.39 ± 0.17 | 0.11 | 16.95 ± 0.25 | 0.03 | 0.9185 |
| Val | 0.9981 | 19.85 ± 0.26 | 0.32 | 17.84 ± 0.12 | 0.04 | 17.03 ± 0.17 | 0.01 | 0.9999 |
| Leu | 0.9969 | 19.97 ± 0.25 | 0.43 | 17.95 ± 0.16 | 0.12 | 18.02 ± 0.03 | 0.03 | 0.9827 |
| Lys | 0.9990 | 15.70 ± 0.12 | 0.45 | 15.24 ± 0.17 | 0.06 | 18.56 ± 0.20 | 0.08 | 0.9977 |
| DA | 0.9926 | 15.03 ± 0.11 | 0.57 | 17.94 ± 0.25 | 0.21 | 17.34 ± 0.06 | 0.16 | 0.9975 |
| His | 0.9973 | 21.91 ± 0.33 | 0.36 | 14.45 ± 0.24 | 0.23 | 16.89 ± 0.25 | 0.20 | 0.9991 |
| Phe | 0.9995 | 16.32 ± 0.15 | 0.15 | 18.35 ± 0.19 | 0.02 | 18.41 ± 0.13 | 0.007 | 0.9997 |
| NE | 0.9970 | 15.83 ± 0.12 | 0.89 | 18.52 ± 0.17 | 0.10 | 16.80 ± 0.22 | 0.05 | 0.9916 |
| 5-HT | 0.9933 | 22.33 ± 0.35 | 0.21 | 18.18 ± 0.18 | 0.09 | 18.96 ± 0.08 | 0.09 | 0.9963 |
| Tyr | 0.9975 | 21.32 ± 0.30 | 0.13 | 18.95 ± 0.22 | 0.05 | 17.15 ± 0.17 | 0.009 | 0.9999 |
| Trp | 0.9975 | 14.58 ± 0.16 | 0.20 | 18.70 ± 0.20 | 0.09 | 18.70 ± 0.17 | 0.01 | 0.9988 |
R2 for each label free metabolite was calculated from calibration curve at 0.5, 1, 5, 10, 20 μmol/L concentration.
average ± standard deviation (n = 6)
LOD = 3*SD (blank)/ slope
R2 for relative quantification of each labeled metabolite was determined from intensity ratios of reporter ions in the 1:5:2:10 ratio labeling experiment.
RPLC-ESI-MS and CE-ESI-MS analysis of DiLeu labeled metabolite standards
Studies have shown that polar metabolites usually elute within the first few minutes on a regular C18 RPLC column.41-43 Furthermore, nanoRPLC-MS systems detect most polar metabolites infrequently if at all. Poorly retained metabolites are most likely washed away or highly diluted during the trapping process. DiLeu labeling of metabolites enables the separation of polar metabolites by nanoRPLC due to the increased hydrophobicity. Extracted ion chromatograms of 12 DiLeu labeled metabolite standards using nanoRPLC is shown in Fig. 3. Unlabeled metabolites do not retain on the nanoRPLC column, barely showing any signal. Conversely, after DiLeu labeling, 12 metabolite standards were well separated with greatly increased sensitivity.
Fig. 3.

Extracted ion chromatograms of 12 DiLeu labeled metabolite standards mixture (5 μM each) in nanoRPLC-ESI-MS. Samples were dissolved in 10 μL of 0.1% FA in H2O and 3 μL was loaded onto the nanoRPLC column.
DiLeu labeling of metabolites was also evaluated with CE-MS, which is routinely utilized to separate charged and polar molecules as an alternative platform to LC-MS. A flow-through microvial CE-ESI-MS interface, where CE effluent combined with modifier flow inside the microvial at the end of the separation column,29 was utilized to build a stable and sensitive CE-MS platform.39, 44 DiLeu labeling of metabolites significantly enhanced their signals in CE-MS analysis with a fold change larger than 10 for most metabolite standards. The extracted ion electropherograms of label free and Dileu labeled 12 metabolite standards are compared in Fig. 4. The signal intensity was increased by more than 200 fold for alanine after labeling with DiLeu. Improved detection sensitivity by DiLeu labeling was due to the increased hydrophobicity and electrospray ionization efficiency. The DiLeu tag most likely facilitates the migration of metabolites to the surface of droplets and improves their ability to acquire a proton before or during escape from the surface of electrospray droplets,45 increasing the electrospray ionization efficiency of amine-containing metabolites. In addition, the migration time and order of metabolites during the CE separation were also changed by DiLeu labeling due to the increased pKa and molecular size. Free metabolites were separated between 13.9 min to 22.2 min, while labeled metabolites eluted from 14.2 min to 18.9 min. The compromised CE separation efficiency might be a potential pitfall for separating complex biological samples since DiLeu labeling reduced the structural differences among different metabolites. To address this limitation, an orthogonal separation technique such as ion mobility, which can separate gas phase ions based on charge and collision cross section (CCS), can be integrated into our current separation platform.38 Additionally, interfering background signals in the low mass range (m/z 50-200) usually complicate MS-based metabolomics studies since metabolite intensities can be suppressed by background signals, especially for low abundance analytes. DiLeu labeling helps alleviate this issue by shifting metabolite masses into a higher m/z range with fewer interference peaks.
Fig. 4.

Extracted ion electropherograms of 12 DiLeu labeled (dark grey) and unlabeled (red) metabolite standards (5 μM each) in CE-ESI-MS. Peak intensity of unlabeled Ala was enlarged by 10 fold in order to be clearly seen in the figure.
The reproducibility, linearity and sensitivity of the labeling approach for 12 metabolite standards were tested in comparison with the label free method (Table 1). Limits of detection (LOD) of 12 unlabeled metabolites ranged from 0.13 to 1.24 μmol/L using the CE-MS platform. Detection sensitivity was significantly improved by DiLeu labeling with LODs ranging from 0.02 to 0.23 μmol/L in CE-MS. The LC-MS platform showed even better detection sensitivity for DiLeu labeled metabolites (LODs = 0.007 ~ 0.20 μmol/L). Because CE usually only loads a few nanoliter of sample and is more sensitive to environmental fluctuation, the migration time of CE is not as reproducible as the retention time of LC (Table 1). To ensure the reproducibility of CE, background electrolyte was freshly made each day before analysis, and a sample containing a mixture of free metabolite standards was used as quality control to monitor system performance and stability each day before real sample analysis in CE-MS. An internal standard (3-aminoquinoline, 1 μM, m/z 145.076, migration time 13.5 min) was also spiked into the sample for the purpose of migration time correction, peak area normalization, and post-acquisition mass calibration of CE-MS data.
The deuterium effect is known to affect the retention time of compounds in reversed phase chromatography.31, 36, 46 Deuterium atoms are integrated in reporter groups (two deuterium atoms in tag 116 and 117, and four deuterium atoms in tag 118) of 4-plex DiLeu reagents. To investigate this potential retention time shift, SRM acquisitions were performed with 4-plex DiLeu labeled metabolite standards in both CE-MS/MS and LC-MS/MS platforms. Because CE separation uses open tubular columns and the interaction between the capillary surface and labeled compounds is minimal, the deuterium effect is not observed with CE –MS platform. As expected, isobarically labeled metabolites migrated at the exact same time in CE-MS/MS analysis (Fig. S3 A, B). The extracted ion chromatograms of four tags showed negligible retention time differences in LC-MS/MS analysis (Fig. S3 C, D), demonstrating the co-elution of isobarically labeled metabolite and the consistency of reporter ion intensity ratios throughout the elution profile.
Mouse urine metabolite identification and quantification
Urine is an important biological fluid that has been used in diagnosing diseases for many years.2, 3 Endogenous metabolites in urine can reflect enzymatic activities, allowing for direct monitoring of different biological states. Compared to other biofluids such as cerebrospinal fluid and serum, urine collection is non-invasive, and the volume is less likely to be restricted. Here, urine samples collected from four individual mice were prepared by 3 kDa molecular weight cut-off ultracentrifugation to obtain urinary metabolite fractions, and utilized to validate DiLeu derivatization and quantification of metabolites. The schematic workflow is illustrated in Fig. 5.
Fig. 5.

Mouse urine analysis workflow. Urine samples were collected from four individual mice. Urinary metabolites obtained from 3 kDa molecular weight cut-off ultracentrifugation were labeled separately with 4-plex DiLeu, combined, and purified prior to LC-MS/MS or CE-MS/MS analysis.
DiLeu labeling not only enables multiplexed quantitative analysis in one run, but also increases the confidence of metabolite identification since DiLeu reagents only target primary and secondary amine groups. In three top 5 DDA LC-MS/MS acquisitions of four labeled urine samples, more than 500 MS/MS events were triggered, among which more than 300 MS/MS spectra contained adequate DiLeu reporter ion intensities. Precursor masses that generated DiLeu reporter ions were subtracted by 145.14 Da and searched against multiple online databases for identification including Metlin,47 Human Metabolome Database (HMDB),48 and Madison Metabolomics Consortium Database (MMCD).49 Putative identification was achieved by accurate mass matching within 20 ppm. The presence of MS/MS reporter ions narrowed potential matches to primary and secondary amine-containing metabolites from many potential hits in databases.
The analysis of labeled urine samples by both LC-ESI-MS/MS and CE-ESI-MS/MS platforms offered cross validation and complementary coverage of urinary metabolites. A total of 40 amine-containing metabolites were putatively identified and relatively quantified in mouse urine (Table 2). 35 labeled metabolites were detected in LC-MS/MS, 25 were detected in CE-MS/MS, and 20 metabolites were commonly shared between platforms. The base peak ion chromatogram of DiLeu labeled mouse urine samples can be found in Fig. S4 (see supporting information). The relative quantification of identified metabolites was accomplished by comparing the intensity ratio of DiLeu reporter ions. Examples of MS/MS spectra are given in Fig. 6, representing the different concentrations of metabolites from four individual mouse urine samples with good reproducibility across three technical replicates. More examples of MS/MS spectra of labeled metabolites from mouse urine samples can be found in Fig. S5 (see supporting information).
Table 2.
Primary amine-containing metabolites that were labeled and putatively identified from mouse urine samples in LC-MS/MS and CE-MS/MS (top 5 DDA) platforms.
| Compound | Formula | Molecular weight |
Mass of labeled metabolite |
LC-MS/MS |
CE-MS/MS |
||
|---|---|---|---|---|---|---|---|
| Retention time (min) |
Δppm | Migration time (min) |
Δppm | ||||
| Glycine | C2H5NO2 | 75.0320 | 221.1798 | 17.12 | 4.2 | 15.90 | 5.1 |
| Putrescine | C4H12N2 | 88.1000 | 379.3883 | 18.57 | −13.1 | 18.30 | −12.6 |
| Alanine | C3H7NO2 | 89.0477 | 235.1954 | 17.16 | −4.4 | 17.61 | −6.1 |
| 3-Aminoisobutanoate | C4H9NO2 | 103.0633 | 249.2111 | 17.55 | 8.1 | — | — |
| Serine | C3H7NO3 | 105.0426 | 251.1903 | 17.22 | −4.9 | 17.30 | −6.9 |
| Creatinine | C4H7N3O | 113.0589 | 259.2067 | 17.81 | 12.9 | 16.72 | 7.5 |
| Proline | C5H9NO2 | 115.0633 | 261.2111 | 17.87 | −11.4 | — | — |
| Valine | C5H11NO2 | 117.0790 | 263.2267 | — | — | 17.90 | 9.0 |
| Threonine | C4H9NO3 | 119.0582 | 265.2060 | 16.73 | 2.7 | 18.46 | 9.8 |
| Methylhistamine | C6H11N3 | 125.0953 | 271.2430 | 16.50 | −0.5 | — | — |
| Creatine | C4H9N3O2 | 131.0695 | 277.2172 | 17.88 | 6.4 | 19.10 | 6.0 |
| Isoleucine/ Leucine | C6H13NO2 | 131.0946 | 277.2424 | 18.44 | −5.7 | 17.92/18.01 | −5.0 |
| Asparagine | C4H8N2O3 | 132.0535 | 423.3417 | 19.19 | −4.5 | 18.52 | 9.2 |
| D-Ornithine | C5H12N2O2 | 132.0899 | 423.3781 | 19.78 | −5.4 | — | — |
| Aspartic acid | C4H7NO4 | 133.0375 | 279.1853 | 22.94 | −7.0 | 18.70 | −4.5 |
| Guanidinobutyrate | C5H11N3O2 | 145.0851 | 291.2329 | — | — | 13.21 | −9.5 |
| Glutamine | C5H10N2O3 | 146.0691 | 292.2169 | 16.77 | −2.4 | 18.32 | 10.6 |
| Lysine | C6H14N2O2 | 146.1055 | 437.3937 | 17.78 | 10.6 | — | — |
| Methionine | C5H11NO2S | 149.0510 | 295.1988 | 17.95 | 3.4 | — | — |
| Histidine | C6H9N3O2 | 155.0695 | 301.2172 | 16.45 | 10.2 | — | — |
| Allantoin | C4H6N4O3 | 158.0440 | 304.1917 | — | — | 13.76 | 7.4 |
| Aminoadipate | C6H11NO4 | 161.0688 | 307.2166 | 17.76 | 6.3 | 18.32 | 6.0 |
| 5-Hydroxylysine | C6H14N2O3 | 162.1004 | 453.3887 | 22.18 | −9.2 | 20.21 | −9.4 |
| Pterin | C6H5N5O | 163.0494 | 309.1972 | 17.76 | 9.8 | 14.56 | 9.2 |
| Phenylalanine | C9H11NO2 | 165.0790 | 311.2267 | 19.74 | 5.7 | — | — |
| 3-Methoxytyramine | C9H13NO2 | 167.0946 | 313.2424 | 18.45 | −0.6 | — | — |
| N-Methyl-histidine | C7H11N3O2 | 169.0851 | 315.2329 | 16.46 | 7.1 | — | — |
| Citrulline | C6H13N3O3 | 175.0957 | 466.3839 | 18.99 | 3.8 | 21.22 | 2.3 |
| Hippuric acid | C9H9NO3 | 179.0582 | 325.2060 | 17.26 | 10.2 | 15.20 | 9.3 |
| Tyrosine | C9H11NO3 | 181.0739 | 327.2216 | 17.70 | 1.4 | 18.79 | 3.8 |
| Epinephrine | C9H13NO3 | 183.0895 | 329.2373 | 22.24 | 5.2 | — | — |
| N-Acetylspermidine | C9H21N3O | 187.1685 | 333.3162 | — | — | 20.12 | 8.1 |
| Trimethyllysine | C9H20N2O2 | 188.1525 | 334.3002 | 20.39 | −14.4 | — | — |
| Aminohippuric acid | C9H10N2O3 | 194.0691 | 340.2169 | — | — | 14.16 | 4.7 |
| 4-Hydroxyhippurate | C9H9NO4 | 195.0532 | 341.2009 | 21.74 | −0.1 | — | — |
| Tryptophan | C11H12N2O2 | 204.0899 | 350.2376 | 18.96 | 7.4 | 15.19 | 14.8 |
| N-acetyl-arginine | C8H16N4O3 | 216.1222 | 362.2700 | 17.68 | −13.2 | — | — |
| 3-Nitrotyrosine | C9H10N2O5 | 226.0590 | 372.2067 | 22.78 | 0.5 | 22.23 | −1.4 |
| Carnosine | C9H14N4O3 | 226.1066 | 372.2543 | 20.03 | −12.5 | — | — |
Fig. 6.

Examples of MS/MS spectra of DiLeu labeled metabolites from mouse urine samples showing the reporter ion region. 4-plex DiLeu labeled glycine (A, parent ion m/z 221.18) and histidine (B, parent ion m/z 301.22). Means and standard deviations of reporter ions from three replicates are shown in inserted tables.
Conclusions
A qualitative and quantitative strategy for amine-containing metabolite analysis was established based on 4-plex DiLeu labeling. Isobaric DiLeu labeling facilitated the accurate relative quantification of amine-containing metabolites, improved the throughput of analysis, and enhanced the electrospray ionization efficiency. Reversed phase LC separation efficiency and CE-MS detection sensitivity of metabolites were greatly improved by DiLeu labeling. This approach was also applied to the profiling and relative quantification of amine-containing metabolites in mouse urine samples, using both nanoLC-ESI-MS/MS and CE-ESI-MS/MS platforms. We believe that the MS-based DiLeu labeling will provide a useful tool for potential metabolic biomarker discovery in the future.
Supplementary Material
Acknowledgements
The authors would like to thank Professor Paul Marker at the University of Wisconsin for providing mouse urine samples and Professor David D.Y. Chen at the University of British Columbia for generously providing the flow-through microvial interface unit of CE-ESI-MS. We also thank Dustin Frost and Zhidan Liang in the Li Research Group for participating in the synthesis of 4-plex DiLeu reagents. We thank Christopher Lietz and Qing Yu in the Li Group for helpful discussions. This work was supported by National Institute of Health through Grants 1P20DK097826, R56 DK071801 and UW Graduate School IEDR Program.
Footnotes
Notes
Electronic Supplementary Information (ESI) is available.
References
- 1.Mamas M, Dunn WB, Neyses L, Goodacre R. Arch Toxicol. 2011;85:5–17. doi: 10.1007/s00204-010-0609-6. [DOI] [PubMed] [Google Scholar]
- 2.Zhang AH, Sun H, Wang P, Han Y, Wang XJ. J Proteomics. 2012;75:1079–1088. doi: 10.1016/j.jprot.2011.10.027. [DOI] [PubMed] [Google Scholar]
- 3.Ganti S, Weiss RH. Urol Oncol-Semin Ori. 2011;29:551–557. doi: 10.1016/j.urolonc.2011.05.013. [DOI] [PMC free article] [PubMed] [Google Scholar]
- 4.Oresic M, Hyotylainen T, Herukka SK, Sysi-Aho M, Mattila I, Seppanan-Laakso T, Julkunen V, Gopalacharyulu PV, Hallikainen M, Koikkalainen J, Kivipelto M, Helisalmi S, Lotjonen J, Soininen H. Transl Psychiat. 2011:1. doi: 10.1038/tp.2011.55. [DOI] [PMC free article] [PubMed] [Google Scholar]
- 5.Trushina E, Dutta T, Persson XMT, Mielke MM, Petersen RC. Plos One. 2013:8. doi: 10.1371/journal.pone.0063644. [DOI] [PMC free article] [PubMed] [Google Scholar]
- 6.Suppa A, Lezzi E, Conte A, Belvisi D, Marsili L, Modugno N, Fabbrini G, Berardelli A. Cereb Cortex. 2010;20:2224–2233. doi: 10.1093/cercor/bhp288. [DOI] [PubMed] [Google Scholar]
- 7.Villas-Boas SG, Mas S, Akesson M, Smedsgaard J, Nielsen J. Mass Spectrom Rev. 2005;24:613–646. doi: 10.1002/mas.20032. [DOI] [PubMed] [Google Scholar]
- 8.Sofie C, Jerome H, Jean-Michel R, Piet S, Niels H. J Neuroimmunol. 2010;228:37–37. [Google Scholar]
- 9.Alpert AJ. J Chromatogr. 1990;499:177–196. doi: 10.1016/s0021-9673(00)96972-3. [DOI] [PubMed] [Google Scholar]
- 10.Creek DJ, Jankevics A, Breitling R, Watson DG, Barrett MP, Burgess KEV. Anal Chem. 2011;83:8703–8710. doi: 10.1021/ac2021823. [DOI] [PubMed] [Google Scholar]
- 11.Knee JM, Rzezniczak TZ, Barsch A, Guo KZ, Merritt TJS. J Chromatogr B. 2013;936:63–73. doi: 10.1016/j.jchromb.2013.07.027. [DOI] [PubMed] [Google Scholar]
- 12.Piraud M, Vianey-Saban C, Petritis K, Elfakir C, Steghens JP, Bouchu D. Rapid Commun Mass Sp. 2005;19:1587–1602. doi: 10.1002/rcm.1957. [DOI] [PubMed] [Google Scholar]
- 13.Zhao SS, Zhong XF, Tie C, Chen DDY. Proteomics. 2012;12:2991–3012. doi: 10.1002/pmic.201200221. [DOI] [PubMed] [Google Scholar]
- 14.Kim WS, Dahlgren RL, Moroz LL, Sweedler JV. Anal Chem. 2002;74:5614–5620. doi: 10.1021/ac025917q. [DOI] [PubMed] [Google Scholar]
- 15.Nemes P, Knolhoff AM, Rubakhin SS, Sweedler JV. Anal Chem. 2011;83:6810–6817. doi: 10.1021/ac2015855. [DOI] [PMC free article] [PubMed] [Google Scholar]
- 16.Nemes P, Rubakhin SS, Aerts JT, Sweedler JV. Nat Protoc. 2013;8:783–799. doi: 10.1038/nprot.2013.035. [DOI] [PMC free article] [PubMed] [Google Scholar]
- 17.Edwards JL, Chisolm CN, Shackman JG, Kennedy RT. J Chromatogr A. 2006;1106:80–88. doi: 10.1016/j.chroma.2005.08.082. [DOI] [PubMed] [Google Scholar]
- 18.Kuehnbaum NL, Britz-McKibbin P. Chem Rev. 2013;113:2437–2468. doi: 10.1021/cr300484s. [DOI] [PubMed] [Google Scholar]
- 19.Carter MD, Calcutt MW, Malow BA, Rose KL, Hachey DL. J Mass Spectrom. 2012;47:277–285. doi: 10.1002/jms.2051. [DOI] [PMC free article] [PubMed] [Google Scholar]
- 20.Pauwels S, Antonio L, Jans I, Lintermans A, Neven P, Claessens F, Decallonne B, Billen J, Vanderschueren D, Vermeersch P. Anal Bioanal Chem. 2013;405:8569–8577. doi: 10.1007/s00216-013-7259-5. [DOI] [PubMed] [Google Scholar]
- 21.Slupsky CM, Steed H, Wells TH, Dabbs K, Schepansky A, Capstick V, Faught W, Sawyer MB. Clin Cancer Res. 2010;16:5835–5841. doi: 10.1158/1078-0432.CCR-10-1434. [DOI] [PubMed] [Google Scholar]
- 22.Sugimoto M, Wong DT, Hirayama A, Soga T, Tomita M. Metabolomics. 2010;6:78–95. doi: 10.1007/s11306-009-0178-y. [DOI] [PMC free article] [PubMed] [Google Scholar]
- 23.Kim K, Taylor SL, Ganti S, Guo LN, Osier MV, Weiss RH. Omics. 2011;15:293–303. doi: 10.1089/omi.2010.0094. [DOI] [PMC free article] [PubMed] [Google Scholar]
- 24.Lin L, Huang ZZ, Gao Y, Chen YJ, Hang W, Xing JC, Yan XM. Proteomics. 2012;12:2238–2246. doi: 10.1002/pmic.201200016. [DOI] [PubMed] [Google Scholar]
- 25.Lorenz MA, El Azzouny MA, Kennedy RT, Burant CF. J Biol Chem. 2013;288:10923–10935. doi: 10.1074/jbc.M112.414961. [DOI] [PMC free article] [PubMed] [Google Scholar]
- 26.C. Yang W, E. Regnier F, Jiang Q, Adamec J. J Chromatogr A. 2010;1217:667–675. doi: 10.1016/j.chroma.2009.12.002. [DOI] [PMC free article] [PubMed] [Google Scholar]
- 27.Shortreed MR, Lamos SM, Frey BL, Phillips MF, Patel M, Belshaw PJ, Smith LM. Anal Chem. 2006;78:6398–6403. doi: 10.1021/ac0607008. [DOI] [PubMed] [Google Scholar]
- 28.Guo K, Bamforth F, Li L. J Am Soc Mass Spectrom. 2011;22:339–347. doi: 10.1007/s13361-010-0033-4. [DOI] [PubMed] [Google Scholar]
- 29.Guo K, Li L. Anal Chem. 2009;81:3919–3932. doi: 10.1021/ac900166a. [DOI] [PubMed] [Google Scholar]
- 30.Hsu JL, Huang SY, Chow NH, Chen SH. Anal Chem. 2003;75:6843–6852. doi: 10.1021/ac0348625. [DOI] [PubMed] [Google Scholar]
- 31.Thompson A, Schafer J, Kuhn K, Kienle S, Schwarz J, Schmidt G, Neumann T, Hamon C. Anal Chem. 2003;75:4942–4942. doi: 10.1021/ac0262560. [DOI] [PubMed] [Google Scholar]
- 32.Murphy JP, Everley RA, Coloff JL, Gygi SP. Anal Chem. 2014 doi: 10.1021/ac500153a. [DOI] [PMC free article] [PubMed] [Google Scholar]
- 33.Ross PL, Huang YLN, Marchese JN, Williamson B, Parker K, Hattan S, Khainovski N, Pillai S, Dey S, Daniels S, Purkayastha S, Juhasz P, Martin S, Bartlet-Jones M, He F, Jacobson A, Pappin DJ. Mol Cell Proteomics. 2004;3:1154–1169. doi: 10.1074/mcp.M400129-MCP200. [DOI] [PubMed] [Google Scholar]
- 34.Kaspar H, Dettmer K, Chan Q, Daniels S, Nimkar S, Daviglus ML, Stamler J, Elliott P, Oefner PJ. J Chromatogr B. 2009;877:1838–1846. doi: 10.1016/j.jchromb.2009.05.019. [DOI] [PMC free article] [PubMed] [Google Scholar]
- 35.Hui LM, Xiang F, Zhang YZ, Li LJ. Peptides. 2012;36:230–239. doi: 10.1016/j.peptides.2012.05.007. [DOI] [PMC free article] [PubMed] [Google Scholar]
- 36.Xiang F, Ye H, Chen RB, Fu Q, Li LJ. Anal Chem. 2010;82:2817–2825. doi: 10.1021/ac902778d. [DOI] [PMC free article] [PubMed] [Google Scholar]
- 37.Wang JH, Zhang YZ, Xiang F, Zhang ZC, Li LJ. J Chromatogr A. 2010;1217:4463–4470. doi: 10.1016/j.chroma.2010.02.084. [DOI] [PMC free article] [PubMed] [Google Scholar]
- 38.Sturm RM, Lietz CB, Li LJ. Rapid Commun Mass Sp. 2014;28:1051–1060. doi: 10.1002/rcm.6875. [DOI] [PMC free article] [PubMed] [Google Scholar]
- 39.Maxwell EJ, Zhong XF, Zhang H, van Zeijl N, Chen DDY. Electrophoresis. 2010;31:1130–1137. doi: 10.1002/elps.200900517. [DOI] [PubMed] [Google Scholar]
- 40.Shadforth IP, Dunkley TPJ, Lilley KS, Bessant C. Bmc Genomics. 2005;6 doi: 10.1186/1471-2164-6-145. [DOI] [PMC free article] [PubMed] [Google Scholar]
- 41.Theodoridis G, Gika HG, Wilson ID. Trac-Trend Anal Chem. 2008;27:251–260. [Google Scholar]
- 42.Gika HG, Theodoridis G, Extance J, Edge AM, Wilson ID. J Chromatogr B. 2008;871:279–287. doi: 10.1016/j.jchromb.2008.04.020. [DOI] [PubMed] [Google Scholar]
- 43.Pham-Tuan H, Kaskavelis L, Daykin CA, Janssen HG. J Chromatogr B. 2003;789:283–301. doi: 10.1016/s1570-0232(03)00077-1. [DOI] [PubMed] [Google Scholar]
- 44.Zhong XF, Maxwell EJ, Chen DDY. Anal Chem. 2011;83:4916–4923. doi: 10.1021/ac200636y. [DOI] [PubMed] [Google Scholar]
- 45.Mirzaei H, Regnier F. Anal Chem. 2006;78:4175–4183. doi: 10.1021/ac0602266. [DOI] [PubMed] [Google Scholar]
- 46.Guo K, Ji CJ, Li L. Anal Chem. 2007;79:8631–8638. doi: 10.1021/ac0704356. [DOI] [PubMed] [Google Scholar]
- 47.Smith CA, O'Maille G, Want EJ, Qin C, Trauger SA, Brandon TR, Custodio DE, Abagyan R, Siuzdak G. Ther Drug Monit. 2005;27:747–751. doi: 10.1097/01.ftd.0000179845.53213.39. [DOI] [PubMed] [Google Scholar]
- 48.Wishart DS, Jewison T, Guo AC, Wilson M, Knox C, Liu YF, Djoumbou Y, Mandal R, Aziat F, Dong E, Bouatra S, Sinelnikov I, Arndt D, Xia JG, Liu P, Yallou F, Bjorndahl T, Perez-Pineiro R, Eisner R, Allen F, Neveu V, Greiner R, Scalbert A. Nucleic Acids Res. 2013;41:D801–D807. doi: 10.1093/nar/gks1065. [DOI] [PMC free article] [PubMed] [Google Scholar]
- 49.Cui Q, Lewis IA, Hegeman AD, Anderson ME, Li J, Schulte CF, Westler WM, Eghbalnia HR, Sussman MR, Markley JL. Nat Biotechnol. 2008;26:162–164. doi: 10.1038/nbt0208-162. [DOI] [PubMed] [Google Scholar]
Associated Data
This section collects any data citations, data availability statements, or supplementary materials included in this article.