Abstract
Morbidity and mortality remain high for patients with hypoplastic left heart syndrome during the interstage period between Norwood and Glenn despite ongoing QI efforts. We sought to identify associations between the site of interstage care, interstage events, and mortality. Data for patients enrolled in the National Pediatric Cardiology Quality Improvement Collaborative (NPC-QIC) registry from July 2008 through February 2013 were reviewed. Patients had outpatient interstage care at (1) the surgical site (SS) performing Norwood, (2) a non-surgical site (NSS), or (3) a combination. Interstage events were compared among these groups and, when applicable, by distance from SS to NSS. 688 patients from 47 sites met entry criteria. Patients were followed at the SS 411 (60%), NSS 121 (17%), or a combination 143 (21%). Data was not available for 13 (2%). There were 66 deaths (10%) among the entire cohort: 37 (9%) at SS, 13 (11%) of at NSS, 15 (10%) at a combination. The proportion of deaths among these groups was not statistically significant (p=0.60), nor was there a difference based on SS to NSS distance. Patients followed at the SS were more likely to have problems detected with feeding (p=0.03) and breathing (p=0.002), and ED visits (p<0.001).
Conclusions
The site of interstage care was not associated with mortality, nor was the interstage care distance from the SS. Patients followed at the SS had more detected breathing and feeding problems, and ED visits. Further study is required to elucidate the clinical significance of these differences.
Keywords: congenital heart disease, Hypoplastic left heart syndrome, Interstage, Quality Improvement
INTRODUCTION
Recent quality improvement efforts for infants with Hypoplastic Left Heart Syndrome (HLHS) have focused on morbidity and mortality during the fragile interstage period between Stage 1 Norwood and bidirectional Glenn.(1–3) Progress has been made in interstage nutrition, with movement toward standardized nutrition to improve weight-for-age Z-score at Glenn.(4) Despite these and other improvements, recent studies suggest that interstage mortality remains largely unchanged over the last several years at approximately 10%.(5, 6) Other medical problems and the complexity of medical care involving multiple providers during the interstage remain a challenge.(7–9)
The goal of the National Pediatric Cardiology Quality Improvement Collaborative (NPC-QIC) is to define variation in interstage care and elucidate care practices that confer survival benefit and enhance quality of life.(1) One source of variation is the site of interstage care relative to the site of surgical care. After Norwood, infants can be cared for in a variety of settings.(5) This may be the surgical site (SS) that performed the Norwood. Other children, however, are followed at a non-surgical site (NSS), which might be a non-surgical referring medical facility, a satellite office of the surgical center, or at a private cardiologist. Some children are followed in a combination of SS and NSS.(5) Furthermore, the distance of a non-surgical from a surgical center can vary greatly. The objective of this study was to determine an association between the site of interstage care, morbidity and mortality. A secondary objective of this study was to gain a more robust understanding of mortality during the interstage period in a recent, multi-center cohort of patients.
METHODS
Data for patients enrolled in the NPC-QIC database from July 2008 through February 2013 were retrospectively reviewed for demographic and clinical information. Interstage care was categorized into one of the following settings: (1) the surgical site (SS) that performed the Norwood procedure, (2) a non-surgical site (NSS) as described above or (3) a combination of SS and NSS. This determination was made by the surgical center submitting data at the time of discharge after Norwood. Among patients followed at a NSS or a combination, the distance of the NSS to the SS was calculated using publicly available zip code data and software (MapQuest). The database was queried for interstage events, including: (1) deaths (2) feeding problems (3) breathing problems (4) emergency room visits and (5) readmissions. Among patients who died, the reason for and location of death was recorded.
Statistical Analysis
Characteristics of interstage events were compared for SS versus NSS and SS versus NSS/combination using Fisher’s exact test for categorical variables and the Wilcoxon rank sum test for continuous variables. The chi-square test was used to examine the association between interstage death and distance from the primary surgical center (0–10 miles, 10–50 miles, 50–100 miles, and >100 miles).
RESULTS
Patients and site of interstage care
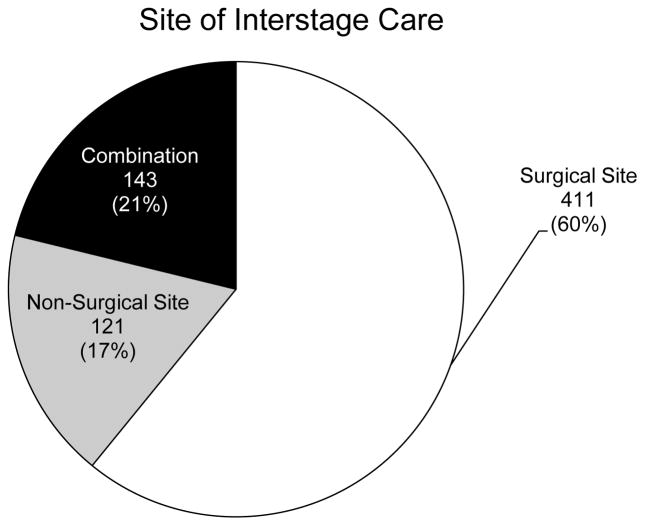
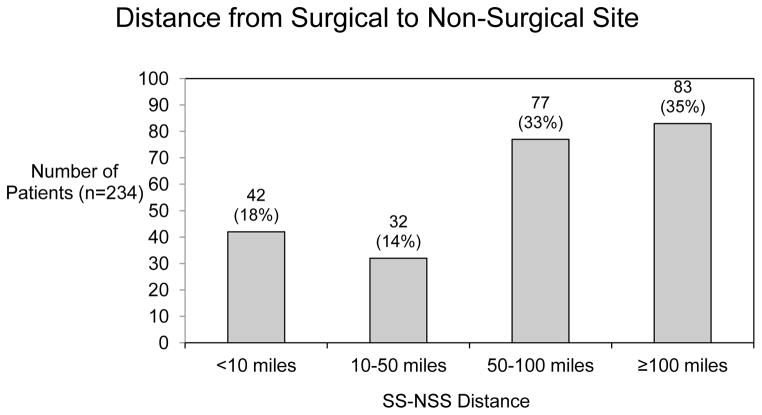
Demographic characteristics of the cohort are summarized in Table 1. There were a total of 688 patients from 47 sites who met entry criteria. The number of patients enrolled at each site varied, with most patients cared for at a site with 10–29 patients enrolled. Most patients (680) were discharged from the same facility where the Norwood was performed. Only 8 patients were discharged from another facility. The SS that performed the Norwood followed 411 patients (60%). The remaining patients were followed at a NSS (121 patients, 17%) or at a combination of the above (143 patients, 21%) (Figure 1). Data were not available for 13 patients (2%). Among the 264 patients followed at a non-surgical center or a combination of SS and NSS, there was variation in the distance at which patients were followed. Among these patients, the majority was followed at a NSS that was a distance of 50 miles or greater from the SS (160 patients, 23% of the entire cohort) and 83 patients (12%) were followed at a distance of 100 miles or greater from the SS (Figure 2). These data were not available for 21 patients.
Table 1.
Demographic characteristics for 688 interstage patients
| N=688(100%) | |
|---|---|
| Male gender | 423 (61%) |
| Race* | |
| White | 507 (74%) |
| Black | 97 (14%) |
| Asian | 4 (1%) |
| Other | 89 (13%) |
| Cardiac Diagnosis† | |
| HLHS MA/AA | 241 (35%) |
| HLHS MS/AS | 99 (14%) |
| HLHS MS/AA | 98 (14%) |
| HLHS MA/AS | 19 (3%) |
| DORV MA | 37 (5%) |
| DILV | 29 (4%) |
| DIRV | 2 (≪1%) |
| Unbalanced CAVC | 29 (4%) |
| Other | 134 (19%) |
| Number of patients enrolled per site | |
| <10 | 84 (12%) |
| 10–19 | 193 (28%) |
| 20–29 | 154 (22%) |
| 30–39 | 102 (15%) |
| ≥40 | 155 (23%) |
| Age at discharge post Norwood (days) | 34 (1–312) |
| Discharged from Norwood facility | 680 (99%) |
| Weight at discharge (kg) | 3.5 (2.0–10.0) |
Some patients entered more than one race.
HLHS, hypoplastic left heart syndrome; MA, mitral atresia; AA, aortic atresia; MS, mitral stenosis; AS, aortic stenosis; DORV, double outlet right ventricle; DILV, double inlet left ventricle; DIRV, double inlet right ventricle; CAVC, complete atrioventricular canal defect.
Figure 1.
Site of outpatient interstage care among patients in the cohort. Data were available for 675 patients. Data were not available for 13 patients (2%).
Figure 2.
Distance of the non-surgical site from the surgical site among those 234 patients followed either exclusively or in part at a non-surgical site.
Interstage events
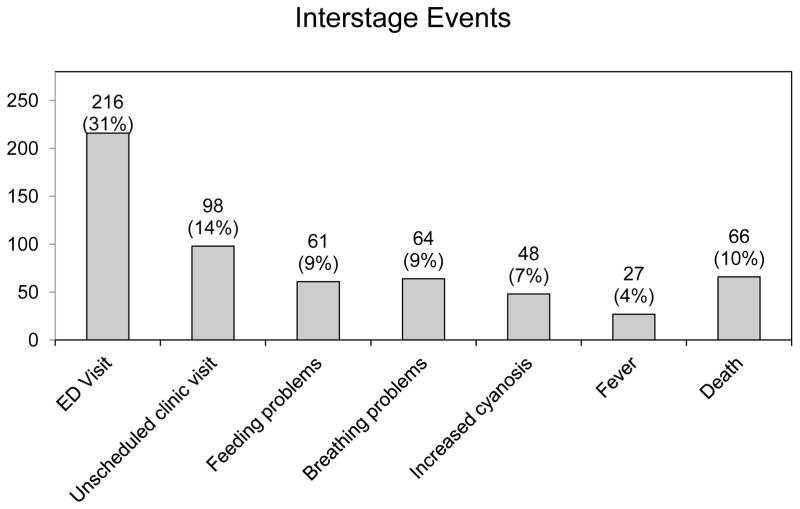
Interstage events are summarized in Table 2. These were documented to occur in 113 patients (16%). Of those with interstage events, the most common events were feeding problems, which occurred in 61 patients (9%) and breathing problems, which occurred in 64 patients (9%). Cyanosis and gastrointestinal problems were also common. Emergency department visits occurred frequently, with nearly one third of the entire cohort having at least one emergency department visit during the interstage period (216 patients, 31%) (Figure 3). Of note, the number of emergency department visits exceeded the number of interstage events, suggesting that several emergency department visits were prompted by events not routinely documented in the collaborative database.
Table 2.
Comparison of interstage events among patients followed at the surgical center, non-surgical center, and a combination of the two
| Surgical site (n=411) | Non-surgical site (n=121) | P value | Non-surgical site + combination (n=264) | P value | |
|---|---|---|---|---|---|
| Number of clinic visits | 5 (0–20) | 4 (0–15) | <0.001 | 4 (0–15) | 0.002 |
| Ever had red flag event | 69 (17%) | 21 (17%) | 0.89 | 41 (16%) | 0.75 |
| Breathing problems | 44 (11%) | 5 (4%) | 0.03 | 16 (6%) | 0.04 |
| Feeding problems | 47 (11%) | 3 (2%) | 0.002 | 16 (6%) | 0.02 |
| Emergency room visit | 149 (36%) | 24 (20%) | <0.001 | 60 (23%) | <0.001 |
| Readmission | 318 (77%) | 77 (64%) | 0.003 | 177 (67%) | 0.003 |
| Death | 37 (9%) | 13 (11%) | 0.59 | 28 (11%) | 0.51 |
| Death at home | 10 (2%) | 10 (8%) | 0.48 | 5 (2%) | 0.55 |
| Death in ER | 11 (3%) | 6 (5%) | 0.32 | 11 (4%) | 0.44 |
| Non-cardiac death | 0 (0%) | 2 (2%) | 0.06 | 2 (1%) | 0.18 |
Figure 3.
Number and percentage of patients experiencing interstage events among the entire cohort.
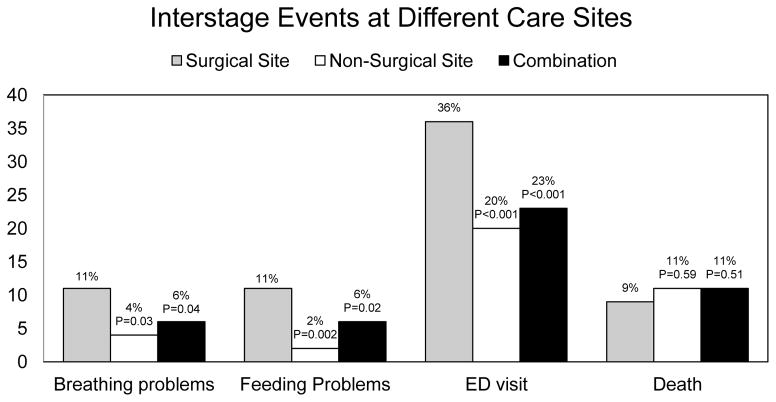
A comparison of interstage events among patients followed at the SS, the NSS, and combination is shown in Figure 4. When comparing SS and NSS patients, there was a significantly higher documentation of breathing problems (p=0.03) and feeding problems (p=0.002) in the SS group. In addition, patients followed at the SS were more likely to have an emergency room visit (p<0.001). These data were similar when patients followed at the SS were compared with patients followed at a combination of sites. There was no difference in the location of death or reason for death based on SS or NSS.
Figure 4.
Comparison of the percentage of patients experiencing interstage events by site of interstage care. Grey bars represent those followed only at the surgical site. White bars represent those followed exclusively at a non-surgical site. Black bars represent those followed at a combination. P-values are noted above their respective bars
Interstage Exit and Mortality
Reasons for interstage exit are listed in Table 3. Of the 688 patients in the cohort, 601 patients had Glenn surgery. The median age at Glenn among patients followed at surgical sites, non-surgical sites and a combination was identical at 148 days of age (interquartile range 124–170, 119–184, and 128–177 days respectively; p=0.80). The remaining 87 patients did not achieve Glenn surgery. Among those 87 patients, the reasons included death in 66 patients, which represented approximately 10% of the entire cohort, and 76% of the patients who did not achieve Glenn. The median age at death was 94 days of age (interquartile range 60–131 days). Transplant was performed in 13 patients, which represented 2% of the entire cohort, and 15% of the patients who did not achieve Glenn. The median age at transplant was 150 days (interquartile range 116–200 days). The remaining 8 patients (1%) were felt not to be Glenn candidates. Details were not available for these 8 patients.
Table 3.
Interstage exit characteristics
| N=688 (100%) | |
|---|---|
| Glenn | 601 (87%) |
| Not Glenn candidate | 8 (1%) |
| Heart transplant | 13 (2%) |
| Death | 66 (10%) |
| Location of Death (n=66) | |
| Home | 15 (23%) |
| ICU | 24 (36%) |
| Emergency Department | 22 (33%) |
| Hospital ward | 2 (3%) |
| Other | 2 (3%) |
| Unknown | 1 (2%) |
| Manner of death | |
| Sudden unexpected | 18 (27%) |
| Arrest with unsuccessful resuscitation | 31 (47%) |
| Withdrawal of support | 12 (18%) |
| Non-cardiac death | 2 (3%) |
| Unknown | 3 (5%) |
| Cause of death | |
| Congestive heart failure | 3 (5%) |
| Low cardiac output | 8 (12%) |
| Failure to wean from ECMO | 2 (3%) |
| Multiorgan system failure | 3 (5%) |
| CNS injury | 3 (5%) |
| Aspiration | 2 (3%) |
| Pneumonia | 1 (2%) |
| Sepsis | 1 (2%) |
| Other | 12 (18%) |
| Unknown | 31 (47%) |
The reasons for and locations of death are also summarized in Table 3. The majority of patients did not die in an inpatient hospital setting, with 15 patients (23% of this group) dying at home and 22 patients (33%) dying in an emergency room. Intensive care unit deaths accounted for 24 patients (36%), and only 2 patients (3% of patients who died) passed away in a non-ICU inpatient setting. Of the 66 patients who died during the interstage, 51 patients (74%, the vast majority), experienced sudden, unexpected death or had a witnessed arrest followed by unsuccessful resuscitation. Of all of the patients who died in the interstage, the cause was unknown in nearly half (31 patients, 47%). There was no statistical difference in location or manner of death among the interstage site types. Similarly, there was no correlation between the distance of the NSS from the SS and mortality.
CONCLUSIONS
A large proportion of interstage patients receive care at sites other than that which provided the Norwood surgery. This study revealed no demonstrable differences in mortality comparing these patients to those followed at the Norwood center. Furthermore, among those patients followed at a non-surgical site, the distance of that NSS from the SS did not affect mortality.
Among patients in the cohort, however, those followed at the surgical center had a greater number of captured interstage events. This may represent a higher degree of vigilance at the surgical center, resulting in the higher rate of problem detection. That in turn may result in a greater number of readmissions or emergency department visits. This is interesting to consider in light of the fact that there was no difference in mortality or in the age at Glenn.
Alternatively, the higher rate of emergency visits might simply reflect greater access to care, and a willingness on the part of families to utilize resources if they are close by. Another feasible explanation is that when care is provided at a non-surgical center, there are poorly understood factors which portend a lower likelihood of interstage problems. These data suggest that a higher number of emergency department visits and readmissions do not affect mortality. This may then prove to be a useful target to reduce the cost of interstage care. Conversely, decreased mortality alone may not be the only measure of successful interstage care; other factors not captured by the NPC-QIC database may benefit from this resource utilization in the interstage period.
These data suggest that there is no difference in the cause of mortality when comparing SS and NSS. In addition, there is no difference in the cause of mortality based on the distance of the NSS from its respective SS. However, the findings regarding withdrawal from the interstage are notable. The mortality rate throughout the collaborative remains approximately 10%. Moreover, the cause of death continues to be elusive in nearly half of all interstage cases. Equally concerning is the fact that many patients die in their home or in an emergency department, ostensibly before an evaluation has been completed. In fact, only the minority of patients die in an inpatient setting. These data reveal that continued efforts are required to the clarify causes of interstage death.
Limitations
There are several limitations to this study. The non-surgical site category is broad, and could represent any number of different medical care practice settings, ranging from a large academic but non-surgical center to the office of a single practitioner. Greater study is required to elucidate finer differences in available services and quality of care at the various types of non-surgical sites. If any setting were noted to have an increased prevalence of mortality, then perhaps additional resources could be diverted to that provider setting to facilitate interstage care. Similarly, the interstage event categories of feeding and breathing problems are broad and limit a more nuanced understanding of these common issues.
Another limitation of this study is the way in which those patients followed at satellite centers were categorized. Patients were somewhat arbitrarily categorized by distance into the categories utilized in this study. If greater refinements were made to collecting distance data, it is possible that an association between some cutoff value and higher mortality could be determined. Finally, due to the limitations of the collaborative database, data may have been disproportionately missing or unreported between SS and NSS groups.
Acknowledgments
This study was supported in part by a National Institutes of Health T32 training grant.
References
- 1.Kugler JD, Beekman RH, III, Rosenthal GL, Jenkins KJ, Klitzner TS, Martin GR, et al. Development of a pediatric cardiology quality improvement collaborative: from inception to implementation. From the Joint Council on Congenital Heart Disease Quality Improvement Task Force. Congenit Heart Dis. 2009;4(5):318–28. doi: 10.1111/j.1747-0803.2009.00328.x. [DOI] [PubMed] [Google Scholar]
- 2.Ghanayem NS, Cava JR, Jaquiss RDB, Tweddell JS. Home monitoring of infants after stage one palliation for hypoplastic left heart syndrome. Seminars in Thoracic and Cardiovascular Surgery: Pediatric Cardiac Surgery Annual. 2004;7(1):32–8. doi: 10.1053/j.pcsu.2004.02.017. [DOI] [PubMed] [Google Scholar]
- 3.Ghanayem NS, Hoffman GM, Mussatto KA, Cava JR, Frommelt PC, Rudd NA, et al. Home surveillance program prevents interstage mortality after the Norwood procedure. J Thorac Cardiovasc Surg. 2003;126(5):1367–75. doi: 10.1016/s0022-5223(03)00071-0. [DOI] [PubMed] [Google Scholar]
- 4.Anderson JB, Iyer SB, Schidlow DN, Williams R, Varadarajan K, Horsley M, et al. Variation in growth of infants with a single ventricle. J Pediatr. 2012;161(1):16–21. e1. doi: 10.1016/j.jpeds.2012.01.009. quiz e2–3. [DOI] [PubMed] [Google Scholar]
- 5.Schidlow DN, Anderson JB, Klitzner TS, Beekman RH, 3rd, Jenkins KJ, Kugler JD, et al. Variation in interstage outpatient care after the Norwood procedure: a report from the Joint Council on Congenital Heart Disease National Quality Improvement Collaborative. Congenit Heart Dis. 2011;6(2):98–107. doi: 10.1111/j.1747-0803.2011.00509.x. [DOI] [PubMed] [Google Scholar]
- 6.Pearl JM, Nelson DP, Schwartz SM, Manning PB. First-stage palliation for hypoplastic left heart syndrome in the twenty-first century. Ann Thorac Surg. 2002;73(1):331–9. doi: 10.1016/s0003-4975(01)02720-5. discussion 9–40. [DOI] [PubMed] [Google Scholar]
- 7.Connor JA, Arons RR, Figueroa M, Gebbie KM. Clinical outcomes and secondary diagnoses for infants born with hypoplastic left heart syndrome. Pediatrics. 2004;114(2):e160–5. doi: 10.1542/peds.114.2.e160. [DOI] [PubMed] [Google Scholar]
- 8.Karamlou T, Diggs BS, Ungerleider RM, Welke KF. Evolution of treatment options and outcomes for hypoplastic left heart syndrome over an 18-year period. J Thorac Cardiovasc Surg. 2010;139(1):119–26. doi: 10.1016/j.jtcvs.2009.04.061. discussion 26–7. [DOI] [PubMed] [Google Scholar]
- 9.Jenkins PC, Flanagan MF, Jenkins KJ, Sargent JD, Canter CE, Chinnock RE, et al. Morbidities in patients with hypoplastic left heart syndrome. Pediatr Cardiol. 2004;25(1):3–10. doi: 10.1007/s00246-003-0471-x. [DOI] [PubMed] [Google Scholar]


