

Abstract
NMDA receptors are ligand-gated ion channels that mediate excitatory synaptic transmission in the central nervous system. Partial agonists elicit submaximal channel activation, but crystal structures of the ligand-binding domains (LBDs) bound with partial and full agonists show little difference. To uncover the molecular mechanism for partial agonism, here we computed the free energy surfaces of the GluN1 (an obligatory subunit of NMDA receptors) LBD bound with a variety of ligands. The free energy minima are similarly positioned for full and partial agonists, but the curvatures are significantly reduced in the latter case, indicating higher probabilities for sampling conformations with a not fully closed domain cleft. The free energy surfaces for antagonists have both shifted minima and further reduced curvatures. Reduced curvature of free energy surface appears to explain well the partial agonism at NMDA receptors and may present a unique paradigm in producing graded responses for receptors in general.
Introduction
Ionotropic glutamate receptors (iGluRs) are a family of ligand-gated tetrameric ion channels that convert chemical signals carried by neurotransmitters into excitatory electrical signals (Traynelis et al., 2010). The three major subtypes of this family, i.e., AMPA, NMDA and kainite receptors, share a common modular architecture, including an amino-terminal domain (ATD), a ligand-binding domain (LBD), and a transmembrane domain (TMD) (Karakas and Furukawa, 2014; Lee et al., 2014; Sobolevsky et al., 2009). NMDA receptors are heteromeric assemblies composed of two obligatory GluN1 subunits and two GluN2/N3 subunits, and require simultaneous binding of glycine and glutamate/glycine for activation (Johnson and Ascher, 1987). The LBD can be further divided into the D1 and D2 lobes and is reminiscent of a clam-shell, with the ligand binding site situated within the cleft (Armstrong et al., 1998). Agonist binding induces cleft closure, whose effect is transmitted by LBD-TMD linkers to open the channel pore (Dai and Zhou, 2013; Dong and Zhou, 2011; Kazi et al., 2014).
Full agonists elicit maximal channel activation whereas antagonists inhibit channel activation. In comparison, partial agonists possess submaximal efficacy, and thereby provide a unique perspective into the link between ligand-induced conformational change and channel activation (Inanobe et al., 2005). Clinically, GluN1-binding partial agonists, such as D-cycloserine and GLYX-13, have emerged as promising drug leads to treat neurological diseases. D-cycloserine was used to facilitate extinction of fear (Ressler et al., 2004) and augment therapy for social anxiety disorder (Hofmann et al., 2006). GLYX-13 was shown to have antidepressant effects without side effects found for ketamine, a channel blocker (Burgdorf et al., 2013). Therefore, it is of great interest to understand the molecular mechanism underlying the partial agonism at NMDA receptors.
Partial agonists for AMPA receptors induce graded LBD cleft closure in crystal structures, correlating with submaximal channel activation (Armstrong and Gouaux, 2000; Durr et al., 2014; Jin et al., 2003). In contrast, for NMDA receptors, a correlation between the degree of cleft closure and agonist efficacy was not observed: structures of GluN1-3 LBDs bound with their respective full and partial agonists show essentially the same degrees of cleft closure (Furukawa and Gouaux, 2003; Hansen et al., 2013; Inanobe et al., 2005; Vance et al., 2011; Yao et al., 2008). Crystallography has thus not yielded an explanation for the partial agonism at NMDA receptors. Corresponding results for kainate receptors appear mixed. Earlier structures of GluK1-2 LBDs bound with full agonists, partial agonists, and an antagonist suggested a correlation between cleft closure and agonist efficacy (Hald et al., 2007; Mayer, 2005; Nanao et al., 2005; Naur et al., 2005), but more recently a weak partial agonist was found to induce full cleft closure in the GluK1 LBD (Frydenvang et al., 2009).
In addition to the degree of cleft closure, several lines of evidence suggest that the stability of LBD cleft closure also contributes to partial agonism at AMPA receptors. For example, mutations that disrupted an inter-lobe hydrogen bond in GluA2 decreased both agonist affinity and efficacy (Robert et al., 2005). NMR data indicated that, compared to partial agonists with high efficacies, those with low efficacies induced a less stable cleft closure of the GluA2 LBD (Ahmed et al., 2013; Maltsev et al., 2008). According to single molecule FRET experiments on the GluA2 LBD in complex with several partial agonists, the fraction of time that the LBD spent in cleft-closed conformations correlated with the extent of channel activation (Ramaswamy et al., 2012). Molecular dynamics simulations have also presented evidence of conformational flexibility associated with partial-agonist binding (Arinaminpathy et al., 2006; Postila et al., 2011).
A mechanistic model that bridges the gap between structural and functional studies and convincingly explains the partial agonism at NMDA receptors is still missing, although some factors have been put forward as potential determinants. In particular, the interaction between LBD and ATD was thought to regulate agonist efficacy and channel gating (Dravid et al., 2010; Hansen et al., 2013; Yuan et al., 2009). However, ATD is not an indispensible component for channel gating, as removal of ATD from NMDA receptors had only minor effects (Yuan et al., 2009), similar to observations on ATD-removed AMPA and kainate receptors (Pasternack et al., 2002; Plested and Mayer, 2007). Given the absence of graded cleft closure in the LBD structures, motion in an orthogonal direction, i.e., the inter-lobe relative twist around an axis along the domain hinge, was proposed as an alternative cause of partial agonism (Birdsey-Benson et al., 2010; Bjerrum and Biggin, 2008), even though such twist is hardly detectable in the crystal structures. Based on steered molecular dynamics simulations, it was also suggested that a partial-agonist bound GluN1 LBD was not as firmly closed as a full-agonist bound counterpart (Ylilauri and Pentikainen, 2012).
Whereas crystal structures represent single conformations, likely corresponding to free energy minima, during channel gating the LBD must traverse a range of conformations, dictated by the free energy surface. The free energies generated by GluA2 LBD cleft closure upon binding a variety of ligands have been calculated (Lau and Roux, 2007, 2011). Very recently, calculations of free energy surfaces for apo and full-agonist bound GluN1-3 LBDs were used to characterize their conformational spaces (Yao et al., 2013).
To uncover the molecular mechanism underlying partial agonism at NMDA receptors, here we calculated the free energy surfaces of the GluN1 LBD bound with various ligands, including two full agonists, three partial agonists, and two antagonists. For the full and partial agonists, the positions of the free energy minima are in close proximity, in line with the crystal structures. However, the curvatures of the free energy basins are different: those for the full agonists are steep, whereas for partial agonists with increasingly larger sizes and lower efficacies, the curvatures are progressively reduced. The free energy surfaces for antagonists have both shifted minima and even broader basins. The reduced curvatures indicate weakened inter-lobe interactions and give rise to higher probabilities to open the LBD cleft, thereby leading to reduced agonist efficacy. A potential curvature determinant is Asp732 on the D2 lobe, which, in response to increasing ligand size, becomes more likely to adopt a second rotamer, leading to weakened inter-lobe interactions. Reduced curvature of free energy surface may present a unique paradigm in producing graded responses for receptors in general.
Results
Apparent anti-correlation between ligand size and efficacy
Seven GluN1-binding ligands were studied here (Figure 1A), including two full agonists, glycine (Gly) and D-serine (DSN); three partial agonists, D-cycloserine (DCS), 1-aminocyclopropane-1-carboxylic acid (ACPC), and 1-aminocyclobutane-1-carboxylic acid (ACBC); and two antagonists, 1-aminocyclopentane-1-carboxylic acid (CLE) and 5,7-dichlorokynurenic acid (DCKA). Previously it was observed on both AMPA receptors and acetylcholine receptors that an anti-correlation exists between ligand size and efficacy (Du et al., 2012). The same trend is also apparent for these GluN1-binding ligands (Figure 1B). The full agonists are among the smallest in size; partial agonists with decreasing efficacies have increasing sizes; and the antagonists are the largest in size. Whereas the LBDs in AMPA receptors apparently respond to ligand size through the degree of cleft closure, the response of the GluN1 LBD is different, as detailed below.
Figure 1. Anti-correlation between ligand size and efficacy.

(A) Chemical structures of seven GluN1 ligands. Full agonists: glycine (Gly) and D-serine (DSN); partial agonists: D-cycloserine (DCS), 1-aminocyclopropane-1-carboxylic acid (ACPC), and 1-aminocyclobutane-1-carboxylic acid (ACBC); antagonists: 1-aminocyclopentane-1-carboxylic acid (cycloleucine or CLE) and 5,7-dichlorokynurenic acid (DCKA).
(B) A plot of the relative efficacies of the ligands (Traynelis et al., 2010) against their volumes. Linear regression (red line) on the data for six ligands (other than DCKA) has R2 = 0.72. DSN is less compact than DCS but its hydroxyl can hydrogen bond with the LBD, thereby stabilizing the cleft-closed structure.
Free energy surfaces of GluN1 LBD bound with full and partial agonists have similar minimum positions
Our guiding hypothesis was that the free energy landscape of the GluN1 LBD is ligand-dependent, and the resulting difference in conformational sampling may lead to differences in the extent of channel activation. Since the two lobes of the LBD are relatively rigid, likely it is their relative motion that is functionally important. Following Lau and Roux (2007), we used two inter-lobe distances, ξ1 and ξ2, to describe the relative motion (Figure 2A). The free energy surface over (ξ1, ξ2) for each ligand-bound species was calculated via umbrella sampling, specifically, by running molecular dynamics simulations with ξ1 and ξ2 harmonically restrained to 171 target values. For the Gly-bound case, the initial conformations of these simulations were generated by a series of targeted molecular dynamics simulations, starting from the crystal structure (entry 1PB7 in the Protein Data Bank (PDB)). The resulting free energy surface, combining data over a total simulation time of 513 ns, is shown in Figure 2B.
Figure 2. Reaction coordinates and the free energy surface of the glycine-bound GluN1 LBD.

(A) Two inter-lobe distances, ξ1 and ξ2, are defined to describe the relative motion between the lobes. The view is directly into the domain cleft, with D1 in green and D2 in cyan.
(B) Free energy surface of the Gly-bound GluN1 LBD, presented as contours. The free energy minimum is highlighted by a white dot. Also shown are (ξ1c, ξ2c) values calculated on the crystal structures of the LBD bound with three ligands: Gly (white star; PDB 1PB7), CLE (gray star; PDB 1Y1M), and DCKA (black star; PDB 1PBQ). The coordinate with fixed at (ξ1m – ξ2m)/2 is shown by a white line.
See also Table S1.
The last snapshots of the 171 umbrella-sampling simulations in the Gly-bound case were used to seed simulations for the next larger ligand (i.e., DCS). This procedure of replacing a smaller ligand with the next larger one was repeated, resulting in free energy surfaces for the LBD bound with the six non-Gly ligands (Figure S1). As references, (ξ1, ξ2) values are also indicated over the free energy surfaces (Figure 2B and Figure S1) for the crystal structures of the GluN1 LBD bound with Gly, CLE, and DCKA.
The values of the two “reaction” coordinates at the free energy minima, denoted as (ξ1m, ξ2m), are collected in Table S1. These values are very similar for the five full and partial agonists. Specifically, ξ1m and ξ2m values fall in the narrow ranges of 8.65 to 9.05 Å and 8.45 to 8.65 Å, respectively. This finding is in line with the similarity of the crystal structures of these complexes. In comparison, ξ1m and ξ2m are larger for the two antagonists, especially for DKCA, also in line with the corresponding crystal structures. The calculated minimum positions are somewhat different from the values, (ξ1c, ξ2c), for the corresponding crystal structures (Table S1), with slight overestimation in ξ2m for the full and partial agonists but underestimation in ξ2m for CLE. Such deviations have been seen in previous computational studies (Lau and Roux, 2007; Yao et al., 2013), and probably result from a combination of packing in the crystal lattice and deficiency in the computation.
Reduced curvature of free energy surface may explain submaximal efficacy
Further insight into energetic differences arising from full- and partial-agonist binding is gained by overlaying the free energy surface in the Gly-bound case to each of the other six free energy surfaces (Figure 3A; all the surfaces are contoured to 8 kcal/mol above the free energy minima). The free energy contours for the two agonists nearly overlap, with the basin for DSN only slightly broader. With the binding of the three partial agonists (DCS, ACPC, and ACBC), there are slight increases in ξ1m, but more prominently, the basins broaden progressively as the ligand size is increased. The reduced curvature will increase the probabilities of the LBD to move away from the free energy minima, i.e., to sample conformations with a not fully closed cleft. For the two antagonists (CLE and DCKA), the outward shifts of the minimum positions are accompanied by significant broadening of the free energy basins. Therefore the LBD will have even higher probabilities of sampling open-cleft conformations, as to be expected for antagonists.
Figure 3. Comparison between free energy surfaces of the LBD bound with Gly and non-Gly ligands.

(A) Overlay of free energy contours for the Gly-bound case (black) and the indicated non-Gly counterpart (red).
(B) Slices of the free energy surfaces along ξ1 for the full and partial agonists (solid curves). The results for the two antagonists are shown as dashed curves for reference.
See also Figure S1.
The differences in free-energy basin curvature among the various ligands can be seen more clearly when the free energy surfaces are sliced along a particular direction, specifically along the new coordinate when its orthogonal coordinate is fixed at (ξ1m – ξ2m)/2 (shown as a white line in Figure 2B and Figure S1). Again, for the two full agonists and three partial agonists, the slices of the free energy surfaces show only slight changes in minimum positions but progressive reductions in curvature as the ligand size increases and agonist efficacy decreases (Figure 3B). Therefore, even though partial agonists can induce full LBD cleft closure as observed in crystal structures, the likelihood, identified here, that the LBD also samples cleft-open conformations will lead to a reduced extent of channel activation.
Ligand size influences LBD’s propensity to stay in cleft-open conformations
During the umbrella-sampling simulations, the LBD cleft was forced to open by harmonic restraints on the inter-lobe distances ξ1 and ξ2. Of course each LBD-ligand complex was also under the control of its intrinsic free energy surface. The latter as presented in Figure 3A was obtained by removing the biasing effects of the harmonic restraints using the weighted histogram analysis method (Kumar et al., 1992). We now would like to gain further physical insight into the free energy surface, in particular regarding potential causal link of its curvature to ligand size. Although the umbrella-sampling simulations show the combined effects of the harmonic restraints and the intrinsic free energy surface, one can in fact read off information on the latter’s curvature directly from the umbrella-sampling simulations. This is because when the free energy surface rises sharply, the corresponding strong intrinsic force would pull ξ1 and ξ2 toward the free energy minimum irrespective of the harmonic restraints. In contrast, when the free energy basin is shallow such that the intrinsic force to move toward the free energy minimum is weak, the ξ1 and ξ2 coordinates are likely to stay close to their restraint values. Therefore, in the umbrella-sampling simulations, a higher tendency to move toward the free energy minimum reflects a larger curvature of the free energy surface, whereas a lower tendency to move toward the free energy minimum reflects a smaller curvature of the free energy surface. By comparing the distributions of ξ1 and ξ2 in the umbrella-sampling simulations with varied ligands but the same harmonic restraints, we can directly demonstrate differences in free-energy basin curvature.
Based on the preceding reasoning and reinforcing the results in Figure 3, the distributions of ξ1 and ξ2 indicate that the tendency to stay in open-cleft conformations becomes higher as the ligand size is increased (Figure 4A). For example, with the cleft restrained partially open at (ξ1, ξ2) = (10.5, 10.5), the distributions of ξ1 and ξ2 in the Gly-bound case peak at (10.0, 10.2), a significant shift toward (ξ1m, ξ2m) that reflects a large curvature of the free energy surface. In comparison, the peak position at (10.2, 10.2) in the ACBC-bound case is closer to the restraint values and thus reflects a higher tendency to maintain a partially open cleft. The more open conformations sampled when the LBD is bound with the larger ligand can be illustrated by a comparison of the last snapshots of the Gly- and ACBC-bound simulations (Figure 4B). The emerging picture is that the larger ACBC, similar to the even larger DCKA (an antagonist; Figure 4C), is better able to pry open the LBD cleft, apparently by weakening D1-D2 interactions.
Figure 4. Influence of ligand size on the propensity of LBD to stay open.

(A) Distributions of ξ1 and ξ2 for the LBD bound with Gly (gray curves) and ACBC (red curves) in umbrella-sampling simulations with (ξ1, ξ2) restrained at (10.5, 10.5). The corresponding results for DCKA are shown as dashed curves for reference. The restraint values are shown as vertical lines.
(B) Comparison of the LBD bound with ACBC (red) and Gly (gray) in the last snapshots of the umbrella-sampling simulations. Superposition is made on the Cα atoms of the six D1 residues used for defining ξ1 and ξ2 (i.e., Leu517-Ile519 and His404-Glu406).
(C) Corresponding results for the DCKA-bound case are shown (orange) as reference.
Asp732 acts as a switch for regulating inter-lobe interactions
How does the LBD sense the change in ligand size? By analyzing the hydrogen bonding network around the bound ligand (Figure 5A), we identified a potential key residue, namely Asp732, in regulating D1-D2 interactions, leading to modulation of the curvature of free energy surface and ultimately the efficacy in channel activation. Asp732 is the only residue on the D2 lobe that forms a hydrogen bond with the amino group of the full and partial agonists in the crystal structures. In the simulations with the cleft restrained partially open, the Asp732 sidechain can switch its hydrogen-bonding partner(s) from the ligand amino group to the sidechain of Gln536 on the domain hinge and/or the backbone amide of Ala734 on the D2 lobe (Figure 5B). The latter two form a hydrogen bond in the cleft-closed structures, which is broken when either partner hydrogen bonds to Asp732. The ligand-Asp732 and Gln536-Ala734 hydrogen bonds appear to contribute significantly to the stability of the cleft-closed conformations. When the ligand size increases, these hydrogen bonds are more and more likely replaced by Asp732-Gln536 and Asp732-Ala734 hydrogen bonds (Figure 5C), thereby weakening inter-lobe interactions.
Figure 5. Asp732 as a potential key residue for regulating D1-D2 interactions.
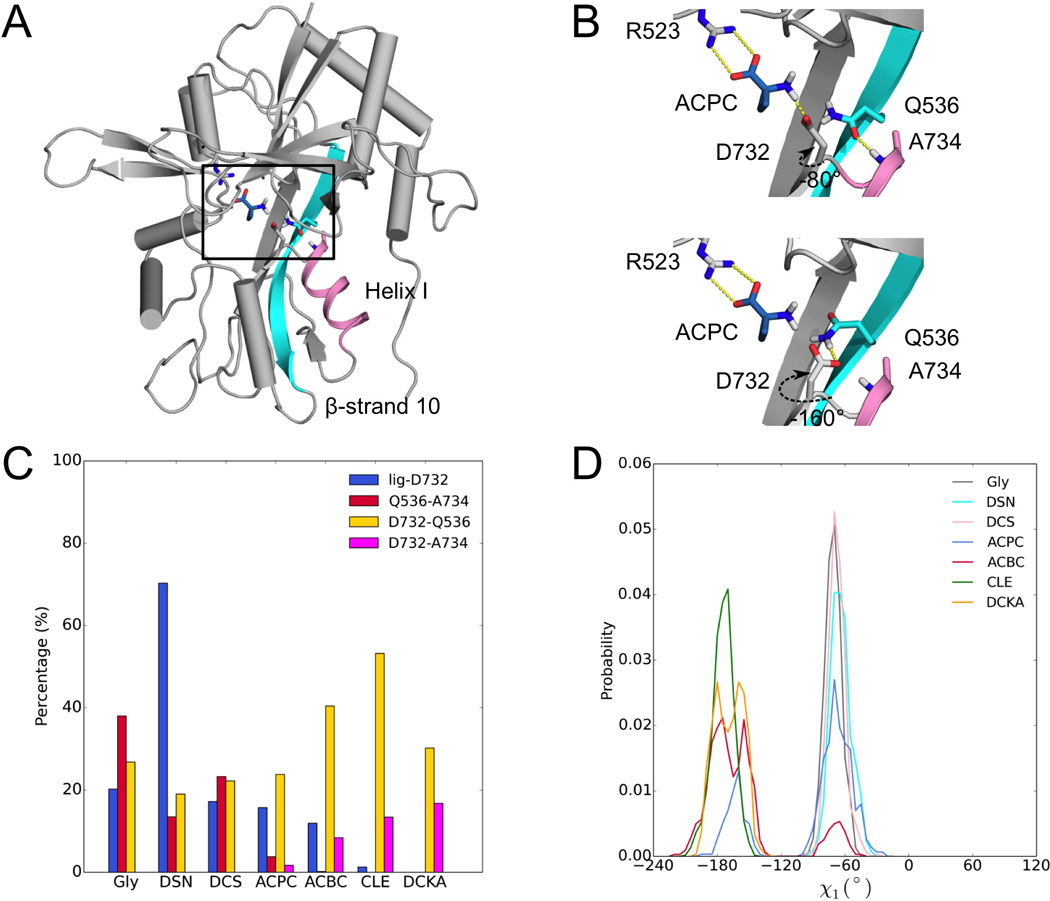
(A) The protein-ACPC complex in a snapshot from an umbrella-sampling simulation, highlighting the ligand and the surrounding residues (boxed). Helix-I, on which Ala734 occupies an N-terminal position, is shown as ribbon in magenta; β-strand 10, which contains the hinge region, is shown in cyan. In the simulation, (ξ1, ξ2) were restrained at (10.0, 10.0).
(B) Two snapshots from this simulation. Top: Asp732 has χ1 at ~ 60° and hydrogen bonds with the ligand, while Gln536 and Ala734 also form a hydrogen bond; bottom: Asp732 has χ1 at ~ –180° and hydrogen bonds with Gln536 (and potentially with Ala734 also).
(C) Percentages of time when four ligand-protein and intra-protein hydrogen bonds are formed in two umbrella-sampling simulations, in which (ξ1, ξ2) were restrained at (10.0, 10.0) or (10.5, 10.5).
(D) Distributions of Asp732 χ1 for the seven protein-ligand systems in these simulations.
See also Figure S2.
The switch in hydrogen-bonding partners is achieved through a change in the sidechain χ1 torsion angle of Asp732: the partner(s) is the ligand at χ1 ~ –60° but is Gln536/Ala734 at χ1 ~ –180° (Figure 5B). In the simulations with the cleft restrained partially open, the probability for Asp732 to adopt the –180° rotamer increases with increasing ligand size (Figure 5D). Interestingly, the switch of hydrogen-bonding partners through the change in rotamers and the influence of ligand size on the latter change, manifested in the umbrella-sampling simulations, are also seen in GluN1-3 crystal structures. In the structures of the GluN1 LBD bound with the six smaller ligands, χ1 is ~ –60° and Asp732 hydrogen bonds with the ligands, but in the structure with DCKA bound, χ1 is ~ –180° and Asp732 hydrogen bonds with Ala734 and Val735. In the apo GluN1 LBD structure (PDB 4KCC), Asp732 can adopt both rotamers, and potentially forms hydrogen bonds with Gln536 and Ala734 in the –180° rotamer. In the structure of the Gly-bound GluN3A LBD (PDB 2RC7), χ1 of the residue corresponding to Asp732 is ~ –60°, just like in the GluN1 counterpart. In contrast, the structure of GluN2A bound with glutamate (PDB 2A5S), a larger agonist, has the Asp732 counterpart adopting the –180° rotamer, and forming a hydrogen bond with the Val735 counterpart. It is perhaps no coincidence that the cleft openings of the glutamate-bound GluN2 LBDs are larger than those of the Gly-bound GluN1 and GluN3 LBDs (Figure S2). The crystal structures thus reinforce the finding of our simulations that GluN1 Asp732 can respond to the increase in ligand size by adopting a second rotamer, leading to weakened inter-lobe interactions.
Discussion
In this study, we have computed the free energy surfaces of the GluN1 LBD bound with a variety of ligands, in order to bridge the gap between structural and functional studies and uncover the molecular mechanism for the partial mechanism at NMDA receptors. When the LBD is bound with full and partial agonists, the free energy surfaces have similarly positioned minima, in line with crystal structures, but the curvatures are progressively reduced as the ligand size is increased and agonist efficacy is lowered. The free energy surfaces for antagonists have minima that are shifted toward conformations with the LBD cleft more open as well as curvatures that are further reduced. These results demonstrate that not only the minimum position but also the curvature of the free energy surface of the ligand-bound LBD can be a determinant for the efficacy in eliciting channel activation.
Our study highlights the free-energy basin curvature as a potential determinant of partial agonism. Although one might be tempted to make quantitative predictions on agonist efficacy from the free energy surfaces calculated here, one has to proceed with caution since doing so would involve assumptions that are beyond what this study can justify. Firstly one has to assume that the equilibrium population fraction of the LBD in some “active” region of the conformational space provides a direct measure of agonist efficacy. Secondly one has to specify the boundary of this active region. For the purpose of illustration, let us assume that the active region is specified by ξ1 < 9 Å and ξ2 < 9 Å. Then the active population fraction is given by the integration of the Boltzmann factor of the free energy W(ξ1, ξ2) in the active region divided by the corresponding integration over the full conformational space. The resulting active population fractions of the LBD are 0.77 for the agonist Gly, 0.37 for the partial agonist ACBC, and 0.02 for the antagonist CLE. These differences in active population fraction confirm the expectation that the ability of a partial agonist to induce LBD active conformations is intermediate between those of a full agonist and an antagonist. It is plausible that they are linked, either directly or indirectly, to the differences in agonist efficacy. However, we stress that, rather than making quantitative predictions, the value of our study lies in presenting a molecular mechanistic explanation for partial agonism.
The free energy surface defined here specifically probes the energetic cost to open the LBD cleft. The stability of LBD closure has been proposed, in addition to the degree of cleft closure, as a contributor to partial agonism (Ahmed et al., 2013; Arinaminpathy et al., 2006; Maltsev et al., 2008; Postila et al., 2011; Ramaswamy et al., 2012; Robert et al., 2005; Ylilauri and Pentikainen, 2012), especially at AMPA receptors. The curvature of the free energy basin highlighted in the present study provides a quantitative measure of the cleft closure stability. We have shown that the curvature is dictated by the strength of inter-lobe interactions, and identified a potential key residue, Asp732, for regulating inter-lobe interactions by a rotameric switch in response to the increase in ligand size. This role of Asp732 appears to be supported by GluN1-3 crystal structures and can be further tested by functional assays of mutants.
We further speculate that Asp732 might be involved in ligand recognition during the binding process. In the apo form, the sidechain of Asp732 samples two rotameric states, with χ1 around −60° and 180°, respectively. When an agonist initially binds to the D1 lobe, the sidechain of Asp732 stays in the −60° rotamer to form a strong interaction with the former’s amino group, thereby stabilizing the cleft-closed conformations (Figure 5B, top panel). On the other hand, when an antagonist binds to the D1 lobe, Asp732 switches to the 180° rotamer and stabilize the cleft-open conformations (Figure 5B, bottom panel). In the GluA2 LBD, residue Lys730 was proposed to act as a switch during ligand binding (Armstrong and Gouaux, 2000). Specifically, in the apo form, Lys730 interacts with Glu705 (the counterpart of GluN1 Asp732), but in the agonist-bound form, it switches to interact with Asp728, thereby releasing Glu705 to interact with the ligand’s amino group.
In a recent functional and computational study on LBD-TMD linker insertion mutants of NMDA receptors, Kazi et al. (2014) presented strong evidence for a mechanical pulling model of channel opening. The study here further suggests that the pulling force is generated by the ligand-bound LBD behaving like an extended spring (Figure 6). The spring constant is just the free-energy basin curvature. As the ligand size is increased, the spring constant is reduced, thus generating a smaller pulling force and hence a less likelihood of channel opening. There is an opportunity to directly test this refined mechanical model by the type of functional assays of Kazi et al. (2014).
Figure 6. Mechanical model of NMDA receptors.

For clarity, only two of the four subunits are shown. In each subunit, the LBD is modeled as an extended spring, which generates a pulling force on the LBD-TMD linker. The TMD is also modeled as a spring (Fowler and Sansom, 2013). The spring constant of the LBD is given by the curvature of free energy surface, and can be reduced when the ligand size is increased (from left panel to right panel), leading to a smaller pulling force on the linker.
Whereas the LBDs in AMPA receptors largely respond to ligand size through the degree of cleft closure (Armstrong and Gouaux, 2000; Durr et al., 2014; Jin et al., 2003), the response of the GluN1 LBD is found here to be through the curvature of free energy surface. A correlation between ligand size and efficacy was observed previously for AMPA receptors (Du et al., 2012). This correlation can now be extended to NMDA receptors (Figure 1B), with the curvature of free energy surface apparently providing the mechanistic link. The mechanistic difference may explain different manifestations of partial agonism at AMPA and NMDA receptors at the single-channel level. AMPA receptors possess subconductance states and partial agonism there has been attributed to a population shift from states with higher conductance to states with lower conductance (Jin et al., 2003; Poon et al., 2010). In contrast, NMDA receptors have one conductance state, and partial agonism there is thought to reflect a decrease in open channel probability as opposed to open channel conductance (Erreger et al., 2005; Kussius and Popescu, 2009). We can speculate that, when a partial agonist binds to AMPA receptors, it induces a graded cleft closure, thereby shifting the population from high to low conductance states. On the other hand, when a partial agonist binds to NMDA receptors, it can produce full closure of the LBD cleft, but also allows a certain probability for the LBD to sample conformations with a not fully closed cleft, leading to channel closure.
The present study of the partial agonism at NMDA receptors is limited to the cleft closure energetics of the GluN1 LBD monomer. It should be noted, however, channel activation involves concerted actions of the different domains in the context of a tetramer (Figure 6). Coupled motions of the LBDs and the TMD tetramer and interactions between the four subunits can all be expected to contribute to agonist efficacy. Still, we note that the LBDs are the first responders to agonist binding. Other domains would transmit, amplify, or attenuate the effects of the agonist-induced LBD cleft closure, but the closure has to occur in the first place. Also, given the modular architecture of NMDA receptors, we speculate that at least some of our computational results on the GluN1 LBD, in particular the influence of ligand size on inter-lobe interactions, may apply to the full-length tetramer context. Recently the structures of the full-length GluN1-GluN2 receptor have been determined (Karakas and Furukawa, 2014; Lee et al., 2014). When the GluN1 subunits are bound with Gly (PDB 4PE5), the degree of LBD cleft closure is nearly the same as in the isolated LBD (PDB 1PB7; Figure S2). In contrast, when bound with ACPC, which is larger and a partial agonist, the GluN1 LBDs in the full-length receptor (PDB 4TLM) are more open than in the isolated LBD (PDB 1Y20; Figure S2). The more open structure may reflect ACPC-induced weakening of inter-lobe interactions in the full-length context.
Like the GluN1-3 subunits, a more distantly related iGluR (AvGluR1) has been found to have similar LBD structures when bound with agonists spanning a range of efficacies (Lomash et al., 2013). A similar observation can be made on the crystal structures of β1-adrenergic receptor, a prototypic G-protein coupled receptor, bound with a full agonist and a partial agonist (PDB 2Y02 and 2Y04) (Warne et al., 2011). It is tempting to hypothesize that a reduced curvature of free energy surface contributes to the partial agonism at these receptors, and may present a unique paradigm in producing graded responses for receptors in general. Further experimental and computational studies have to be done to test this hypothesis.
Methods
Ligand parameterization
Structures of the seven ligands, Gly, DSN, DCS, ACPC, ACBC, CLE, and DCKA, were obtained from the crystal structures of their complexes with the GluN1 LBD (PDB entries 1PB7, 1PB8, 1PB9, 1Y20, 1Y1Z, 1Y1M, and 1PBQ, respectively). Hydrogen atoms were added to the ligands using UCSF Chimera (Pettersen et al., 2004). Partial charges were obtained by fitting to molecular electrostatic potentials from quantum chemistry calculations through the R.E.D. server (Vanquelef et al., 2011), with the net charges of the first six ligands constrained to 0 and that of DCKA to –1. Other force field parameters for the ligands were taken from the general Amber force field (Wang et al., 2004).
Simulations of the LBD-Gly complex
The system was prepared using the tLeap tool of Amber 12 (Case et al., 2005), started from the crystal structure of the GluN1 LBD bound with Gly. Missing residues (D441 to R448) on loop 1 were built using MODELLER (Eswar et al., 2006). A water box with a 10.75-Å buffer zone was used to solvate the system. Crystal water molecules were retained, and 37 sodium and 39 chloride ions were added to neutralize the system.
All simulations were done in NAMD 2.9 (Phillips et al., 2005), using the Amber99SB force field for the protein (Hornak et al., 2006). The solvated system was first energy minimized for 5000 steps with the protein Cα atoms fixed. It was then gradually heated up to 310 K in 310 ps, and equilibrated for 1 ns, while restraining the protein Cα atoms with a force constant of 1.0 kcal/mol/Å2.
Subsequently targeted molecular dynamics simulations were used to generate various initial conformations and simulations with harmonic restraints were used to carry out umbrella sampling. In both of these simulations, the stable bifurcate hydrogen bond between the α-carboxylate oxygens of the ligand and the N1 and N2 atoms of Arg523 was maintained by restraining the two interatomic distances each with a one-sided flat-bottom harmonic potential that starts at a 3.0-Å distance and has a mild force constant of 2.0 kcal/mol/Å2. These restraints ensured that the ligand remained bound to the D1 lobe (McFeeters and Oswald, 2002). In addition, the core regions of the D1 and D2 lobes were restrained to their conformations at the start of the targeted molecular dynamics simulations, each by a one-sided flat-bottom harmonic potential that starts at a 1.0-Å Cα root-mean-square-deviation and has a force constant of 100 kcal/mol/Å2. The D1 core region consisted of residues Leu398 to Glu422, Val431 to Gly438, Val451 to Thr486, Asn499 to Lys534, and Phe758 to Arg794, whereas the D2 core region consisted of residues Leu538 to Thr748.
Two reaction coordinates were defined to describe inter-lobe relative motion (Lau and Roux, 2007). The first, ξ1, is the distance between the Cα centers of mass (COMs) of Leu517-Ile519 on D1 and Ser688-Val689 on D2; and the second, ξ2, is the distance between the COMs of His404-Glu406 on D1 and Ala714-Ala715 on D2. The targeted molecular dynamics simulations consisted of two phases. In phase 1, (ξ1, ξ2) were forced to gradually change from their values, (8.6, 7.7), in the crystal structure first to (12.0, 12.5) during the course of 5 ns and then to (16.0, 16.5) during the course of another 4 ns, roughly along the diagonal line. In phase 2, off-diagonal positions were populated. Specifically, starting from a snapshot from phase 1, ξ1 was restrained at each of 9.0, 9.5, …, 15.5, 16.0 Å while ξ2 was forced to increase from an initial value up to 16.5 Å (at a rate of 1.0 Å per ns of simulation time) in order to cover one side of the diagonal and then vice versa to cover the opposite side of the diagonal. In total, 171 conformations were generated, with (ξ1, ξ2) values covering a 2-dimensioanal grid at roughly a 0.5-Å spacing in each direction.
In the umbrella-sampling simulations, (ξ1, ξ2) were restrained to various target values with a force constant of 10.0 kcal/mol/Å2. Each restrained simulation lasted 3 ns. The weighted histogram analysis method (Kumar et al., 1992) was used to generate the free energy surface from the distributions of (ξ1, ξ2).
Simulations the LBD bound with non-Gly ligands
The last snapshots of the umbrella-sampling simulations in the Gly-bound case were used to seed the umbrella-sampling simulations for the next larger ligand, DCS. Specifically, Gly was replaced by DCS after superimposing five corresponding backbone atoms of the two ligand molecules (i.e., CA, C, N, O, and NG on DCS and CA, C, N, O, OXT on Gly). The resulting solvated LBD-DCS complex was energy minimized for 5000 steps with the protein Cα atoms fixed, and equilibrated for 400 ps while restraining protein Cα atoms with a force constant of 1.0 kcal/mol/Å2. The subsequent umbrella-sampling simulations and data analysis were identical to those in the Gly-bound case.
This procedure of replacing a ligand with the next larger ligand was repeated to calculate the free energy surfaces for the remaining ligands. For the two antagonists, which are larger in size, steric clashes were encountered in some initial conformations after ligand replacement, and were relieved by manually adjusting the ligand positions. For the DCKA-bound case, a water molecule was randomly selected and replaced by a sodium ion, in order to maintain charge neutrality of the system. The 171 umbrella-sampling simulations for CLE were uniformly extended to 6 ns, and no significant changes in the free energy surface were found.
Supplementary Material
Acknowledgments
We thank Dr. Lonnie Wollmuth for discussion. This work was supported by National Institutes of Health Grant GM58187.
Footnotes
Author contributions
H.-X.Z. designed the research. J.D. performed the research and analyzed the data. J.D. and H.-X.Z. wrote the manuscript.
Competing financial interests: The authors declare no competing financial interests.
References
- Ahmed AH, Ptak CP, Fenwick MK, Hsieh CL, Weiland GA, Oswald RE. Dynamics of cleft closure of the GluA2 ligand-binding domain in the presence of full and partial agonists revealed by hydrogen-deuterium exchange. J Biol Chem. 2013;288:27658–27666. doi: 10.1074/jbc.M113.495564. [DOI] [PMC free article] [PubMed] [Google Scholar]
- Arinaminpathy Y, Sansom MS, Biggin PC. Binding site flexibility: molecular simulation of partial and full agonists within a glutamate receptor. Mol Pharmacol. 2006;69:11–18. doi: 10.1124/mol.105.016691. [DOI] [PubMed] [Google Scholar]
- Armstrong N, Gouaux E. Mechanisms for activation and antagonism of an AMPA-sensitive glutamate receptor: crystal structures of the GluR2 ligand binding core. Neuron. 2000;28:165–181. doi: 10.1016/s0896-6273(00)00094-5. [DOI] [PubMed] [Google Scholar]
- Armstrong N, Sun Y, Chen GQ, Gouaux E. Structure of a glutamate-receptor ligand-binding core in complex with kainate. Nature. 1998;395:913–917. doi: 10.1038/27692. [DOI] [PubMed] [Google Scholar]
- Birdsey-Benson A, Gill A, Henderson LP, Madden DR. Enhanced efficacy without further cleft closure: reevaluating twist as a source of agonist efficacy in AMPA receptors. J Neurosci. 2010;30:1463–1470. doi: 10.1523/JNEUROSCI.4558-09.2010. [DOI] [PMC free article] [PubMed] [Google Scholar]
- Bjerrum EJ, Biggin PC. Rigid body essential X-ray crystallography: distinguishing the bend and twist of glutamate receptor ligand binding domains. Proteins. 2008;72:434–446. doi: 10.1002/prot.21941. [DOI] [PubMed] [Google Scholar]
- Burgdorf J, Zhang XL, Nicholson KL, Balster RL, Leander JD, Stanton PK, Gross AL, Kroes RA, Moskal JR. GLYX-13, a NMDA receptor glycine-site functional partial agonist, induces antidepressant-like effects without ketamine-like side effects. Neuropsychopharmacol. 2013;38:729–742. doi: 10.1038/npp.2012.246. [DOI] [PMC free article] [PubMed] [Google Scholar]
- Case DA, Cheatham TE, 3rd, Darden T, Gohlke H, Luo R, Merz KM, Jr, Onufriev A, Simmerling C, Wang B, Woods RJ. The Amber biomolecular simulation programs. J Comput Chem. 2005;26:1668–1688. doi: 10.1002/jcc.20290. [DOI] [PMC free article] [PubMed] [Google Scholar]
- Dai J, Zhou HX. An NMDA receptor gating mechanism developed from MD simulations reveals molecular details underlying subunit-specific contributions. Biophys J. 2013;104:2170–2181. doi: 10.1016/j.bpj.2013.04.013. [DOI] [PMC free article] [PubMed] [Google Scholar]
- Dong H, Zhou HX. Atomistic mechanism for the activation and desensitization of an AMPA-subtype glutamate receptor. Nat Commun. 2011;2:354. doi: 10.1038/ncomms1362. [DOI] [PMC free article] [PubMed] [Google Scholar]
- Dravid SM, Burger PB, Prakash A, Geballe MT, Yadav R, Le P, Vellano K, Snyder JP, Traynelis SF. Structural determinants of D-cycloserine efficacy at the NR1/NR2C NMDA receptors. J Neurosci. 2010;30:2741–2754. doi: 10.1523/JNEUROSCI.5390-09.2010. [DOI] [PMC free article] [PubMed] [Google Scholar]
- Du J, Dong H, Zhou HX. Size matters in activation/inhibition of ligand-gated ion channels. Trends Pharmacol Sci. 2012;33:482–493. doi: 10.1016/j.tips.2012.06.005. [DOI] [PMC free article] [PubMed] [Google Scholar]
- Durr KL, Chen L, Stein RA, De Zorzi R, Folea IM, Walz T, McHaourab HS, Gouaux E. Structure and dynamics of AMPA receptor GluA2 in resting, pre-Open, and desensitized states. Cell. 2014;158:778–792. doi: 10.1016/j.cell.2014.07.023. [DOI] [PMC free article] [PubMed] [Google Scholar]
- Erreger K, Geballe MT, Dravid SM, Snyder JP, Wyllie DJ, Traynelis SF. Mechanism of partial agonism at NMDA receptors for a conformationally restricted glutamate analog. J Neurosci. 2005;25:7858–7866. doi: 10.1523/JNEUROSCI.1613-05.2005. [DOI] [PMC free article] [PubMed] [Google Scholar]
- Eswar N, Webb B, Marti-Renom MA, Madhusudhan MS, Eramian D, Shen MY, Pieper U, Sali A. Comparative protein structure modeling using Modeller. Curr Protoc Bioinformatics. 2006;Chapter 5(Unit 5.6) doi: 10.1002/0471250953.bi0506s15. [DOI] [PMC free article] [PubMed] [Google Scholar]
- Fowler PW, Sansom MS. The pore of voltage-gated potassium ion channels is strained when closed. Nat Commun. 2013;4:1872. doi: 10.1038/ncomms2858. [DOI] [PMC free article] [PubMed] [Google Scholar]
- Frydenvang K, Lash LL, Naur P, Postila PA, Pickering DS, Smith CM, Gajhede M, Sasaki M, Sakai R, Pentikainen OT, et al. Full domain closure of the ligand-binding core of the ionotropic glutamate receptor iGluR5 induced by the high affinity agonist dysiherbaine and the functional antagonist 8,9-dideoxyneodysiherbaine. J Biol Chem. 2009;284:14219–14229. doi: 10.1074/jbc.M808547200. [DOI] [PMC free article] [PubMed] [Google Scholar]
- Furukawa H, Gouaux E. Mechanisms of activation, inhibition and specificity: crystal structures of the NMDA receptor NR1 ligand-binding core. EMBO J. 2003;22:2873–2885. doi: 10.1093/emboj/cdg303. [DOI] [PMC free article] [PubMed] [Google Scholar]
- Hald H, Naur P, Pickering DS, Sprogoe D, Madsen U, Timmermann DB, Ahring PK, Liljefors T, Schousboe A, Egebjerg J, et al. Partial agonism and antagonism of the ionotropic glutamate receptor iGLuR5: structures of the ligand-binding core in complex with domoic acid and 2-amino-3-[5-tert-butyl-3-(phosphonomethoxy)-4-isoxazolyl]propionic acid. J Biol Chem. 2007;282:25726–25736. doi: 10.1074/jbc.M700137200. [DOI] [PubMed] [Google Scholar]
- Hansen KB, Tajima N, Risgaard R, Perszyk RE, Jorgensen L, Vance KM, Ogden KK, Clausen RP, Furukawa H, Traynelis SF. Structural determinants of agonist efficacy at the glutamate binding site of N-methyl-D-aspartate receptors. Mol Pharmacol. 2013;84:114–127. doi: 10.1124/mol.113.085803. [DOI] [PMC free article] [PubMed] [Google Scholar]
- Hofmann SG, Meuret AE, Smits JA, Simon NM, Pollack MH, Eisenmenger K, Shiekh M, Otto MW. Augmentation of exposure therapy with D-cycloserine for social anxiety disorder. Arch Gen Psychiatry. 2006;63:298–304. doi: 10.1001/archpsyc.63.3.298. [DOI] [PubMed] [Google Scholar]
- Hornak V, Abel R, Okur A, Strockbine B, Roitberg A, Simmerling C. Comparison of multiple Amber force fields and development of improved protein backbone parameters. Proteins. 2006;65:712–725. doi: 10.1002/prot.21123. [DOI] [PMC free article] [PubMed] [Google Scholar]
- Inanobe A, Furukawa H, Gouaux E. Mechanism of partial agonist action at the NR1 subunit of NMDA receptors. Neuron. 2005;47:71–84. doi: 10.1016/j.neuron.2005.05.022. [DOI] [PubMed] [Google Scholar]
- Jin RS, Banke TG, Mayer ML, Traynelis SF, Gouaux E. Structural basis for partial agonist action at ionotropic glutamate receptors. Nat Neurosci. 2003;6:803–810. doi: 10.1038/nn1091. [DOI] [PubMed] [Google Scholar]
- Johnson JW, Ascher P. Glycine potentiates the NMDA response in cultured mouse-brain neurons. Nature. 1987;325:529–531. doi: 10.1038/325529a0. [DOI] [PubMed] [Google Scholar]
- Karakas E, Furukawa H. Crystal structure of a heterotetrameric NMDA receptor ion channel. Science. 2014;344:992–997. doi: 10.1126/science.1251915. [DOI] [PMC free article] [PubMed] [Google Scholar]
- Kazi R, Dai J, Sweeney C, Zhou HX, Wollmuth LP. Mechanical coupling maintains the fidelity of NMDA receptor-mediated currents. Nat Neurosci. 2014;17:914–922. doi: 10.1038/nn.3724. [DOI] [PMC free article] [PubMed] [Google Scholar]
- Kumar S, Bouzida D, Swendsen RH, Kollman PA, Rosenberg JM. The weighted histogram analysis method for free-energy calculations on biomolecules. 1. The method. J Comput Chem. 1992;13:1011–1021. [Google Scholar]
- Kussius CL, Popescu GK. Kinetic basis of partial agonism at NMDA receptors. Nat Neurosci. 2009;12:1114–1120. doi: 10.1038/nn.2361. [DOI] [PMC free article] [PubMed] [Google Scholar]
- Lau AY, Roux B. The free energy landscapes governing conformational changes in a glutamate receptor ligand-binding domain. Structure. 2007;15:1203–1214. doi: 10.1016/j.str.2007.07.015. [DOI] [PMC free article] [PubMed] [Google Scholar]
- Lau AY, Roux B. The hidden energetics of ligand binding and activation in a glutamate receptor. Nat Struct Mol Biol. 2011;18:283–287. doi: 10.1038/nsmb.2010. [DOI] [PMC free article] [PubMed] [Google Scholar]
- Lee CH, Lu W, Michel JC, Goehring A, Du J, Song X, Gouaux E. NMDA receptor structures reveal subunit arrangement and pore architecture. Nature. 2014;511:191–197. doi: 10.1038/nature13548. [DOI] [PMC free article] [PubMed] [Google Scholar]
- Lomash S, Chittori S, Brown P, Mayer ML. Anions mediate ligand binding in Adineta vaga glutamate receptor ion channels. Structure. 2013;21:414–425. doi: 10.1016/j.str.2013.01.006. [DOI] [PMC free article] [PubMed] [Google Scholar]
- Maltsev AS, Ahmed AH, Fenwick MK, Jane DE, Oswald RE. Mechanism of partial agonism at the GluR2 AMPA receptor: measurements of lobe orientation in solution. Biochemistry. 2008;47:10600–10610. doi: 10.1021/bi800843c. [DOI] [PMC free article] [PubMed] [Google Scholar]
- Mayer ML. Crystal structures of the GluR5 and GluR6 ligand binding cores: molecular mechanisms underlying kainate receptor selectivity. Neuron. 2005;45:539–552. doi: 10.1016/j.neuron.2005.01.031. [DOI] [PubMed] [Google Scholar]
- McFeeters RL, Oswald RE. Structural mobility of the extracellular ligand-binding core of an ionotropic glutamate receptor. Analysis of NMR relaxation dynamics. Biochemistry. 2002;41:10472–10481. doi: 10.1021/bi026010p. [DOI] [PubMed] [Google Scholar]
- Nanao MH, Green T, Stern-Bach Y, Heinemann SF, Choe S. Structure of the kainate receptor subunit GluR6 agonist-binding domain complexed with domoic acid. Proc Natl Acad Sci U S A. 2005;102:1708–1713. doi: 10.1073/pnas.0409573102. [DOI] [PMC free article] [PubMed] [Google Scholar]
- Naur P, Vestergaard B, Skov LK, Egebjerg J, Gajhede M, Kastrup JS. Crystal structure of the kainate receptor GluR5 ligand-binding core in complex with (S)-glutamate. FEBS Lett. 2005;579:1154–1160. doi: 10.1016/j.febslet.2005.01.012. [DOI] [PubMed] [Google Scholar]
- Pasternack A, Coleman SK, Jouppila A, Mottershead DG, Lindfors M, Pasternack M, Keinanen K. Alpha-amino-3-hydroxy-5-methyl-4-isoxazolepropionic acid (AMPA) receptor channels lacking the N-terminal domain. J Biol Chem. 2002;277:49662–49667. doi: 10.1074/jbc.M208349200. [DOI] [PubMed] [Google Scholar]
- Pettersen EF, Goddard TD, Huang CC, Couch GS, Greenblatt DM, Meng EC, Ferrin TE. UCSF Chimera--a visualization system for exploratory research and analysis. J Comput Chem. 2004;25:1605–1612. doi: 10.1002/jcc.20084. [DOI] [PubMed] [Google Scholar]
- Phillips JC, Braun R, Wang W, Gumbart J, Tajkhorshid E, Villa E, Chipot C, Skeel RD, Kale L, Schulten K. Scalable molecular dynamics with NAMD. J Comput Chem. 2005;26:1781–1802. doi: 10.1002/jcc.20289. [DOI] [PMC free article] [PubMed] [Google Scholar]
- Plested AJ, Mayer ML. Structure and mechanism of kainate receptor modulation by anions. Neuron. 2007;53:829–841. doi: 10.1016/j.neuron.2007.02.025. [DOI] [PubMed] [Google Scholar]
- Poon K, Nowak LM, Oswald RE. Characterizing single-channel behavior of GluA3 receptors. Biophys J. 2010;99:1437–1446. doi: 10.1016/j.bpj.2010.06.058. [DOI] [PMC free article] [PubMed] [Google Scholar]
- Postila PA, Ylilauri M, Pentikainen OT. Full and partial agonism of ionotropic glutamate receptors indicated by molecular dynamics simulations. J Chem Inf Model. 2011;51:1037–1047. doi: 10.1021/ci2000055. [DOI] [PubMed] [Google Scholar]
- Ramaswamy S, Cooper D, Poddar N, MacLean DM, Rambhadran A, Taylor JN, Uhm H, Landes CF, Jayaraman V. Role of conformational dynamics in alpha-amino-3-hydroxy-5-methylisoxazole-4-propionic acid (AMPA) receptor partial agonism. J Biol Chem. 2012;287:43557–43564. doi: 10.1074/jbc.M112.371815. [DOI] [PMC free article] [PubMed] [Google Scholar]
- Ressler KJ, Rothbaum BO, Tannenbaum L, Anderson P, Graap K, Zimand E, Hodges L, Davis M. Cognitive enhancers as adjuncts to psychotherapy - Use of D-cycloserine in phobic individuals to facilitate extinction of fear. Arch Gen Psychiat. 2004;61:1136–1144. doi: 10.1001/archpsyc.61.11.1136. [DOI] [PubMed] [Google Scholar]
- Robert A, Armstrong N, Gouaux JE, Howe JR. AMPA receptor binding cleft mutations that alter affinity, efficacy, and recovery from desensitization. J Neurosci. 2005;25:3752–3762. doi: 10.1523/JNEUROSCI.0188-05.2005. [DOI] [PMC free article] [PubMed] [Google Scholar]
- Sobolevsky AI, Rosconi MP, Gouaux E. X-ray structure, symmetry and mechanism of an AMPA-subtype glutamate receptor. Nature. 2009;462:745–756. doi: 10.1038/nature08624. [DOI] [PMC free article] [PubMed] [Google Scholar]
- Traynelis SF, Wollmuth LP, McBain CJ, Menniti FS, Vance KM, Ogden KK, Hansen KB, Yuan H, Myers SJ, Dingledine R. Glutamate receptor ion channels: structure, regulation, and function. Pharmacol Rev. 2010;62:405–496. doi: 10.1124/pr.109.002451. [DOI] [PMC free article] [PubMed] [Google Scholar]
- Vance KM, Simorowski N, Traynelis SF, Furukawa H. Ligand-specific deactivation time course of GluN1/GluN2D NMDA receptors. Nat Commun. 2011;2:294. doi: 10.1038/ncomms1295. [DOI] [PMC free article] [PubMed] [Google Scholar]
- Vanquelef E, Simon S, Marquant G, Garcia E, Klimerak G, Delepine JC, Cieplak P, Dupradeau FY. R.ED. Server: a web service for deriving RESP and ESP charges and building force field libraries for new molecules and molecular fragments. Nucleic Acids Res. 2011;39:W511–W517. doi: 10.1093/nar/gkr288. [DOI] [PMC free article] [PubMed] [Google Scholar]
- Wang J, Wolf RM, Caldwell JW, Kollman PA, Case DA. Development and testing of a general amber force field. J Comput Chem. 2004;25:1157–1174. doi: 10.1002/jcc.20035. [DOI] [PubMed] [Google Scholar]
- Warne T, Moukhametzianov R, Baker JG, Nehme R, Edwards PC, Leslie AG, Schertler GF, Tate CG. The structural basis for agonist and partial agonist action on a beta(1)-adrenergic receptor. Nature. 2011;469:241–244. doi: 10.1038/nature09746. [DOI] [PMC free article] [PubMed] [Google Scholar]
- Yao Y, Belcher J, Berger AJ, Mayer ML, Lau AY. Conformational analysis of NMDA receptor GluN1, GluN2, and GluN3 ligand-binding domains reveals subtype-specific characteristics. Structure. 2013;21:1788–1799. doi: 10.1016/j.str.2013.07.011. [DOI] [PMC free article] [PubMed] [Google Scholar]
- Yao Y, Harrison CB, Freddolino PL, Schulten K, Mayer ML. Molecular mechanism of ligand recognition by NR3 subtype glutamate receptors. EMBO J. 2008;27:2158–2170. doi: 10.1038/emboj.2008.140. [DOI] [PMC free article] [PubMed] [Google Scholar]
- Ylilauri M, Pentikainen OT. Structural mechanism of N-methyl-D-aspartate receptor type 1 partial agonism. PLoS One. 2012;7:e47604. doi: 10.1371/journal.pone.0047604. [DOI] [PMC free article] [PubMed] [Google Scholar]
- Yuan H, Hansen KB, Vance KM, Ogden KK, Traynelis SF. Control of NMDA receptor function by the NR2 subunit amino-terminal domain. J Neurosci. 2009;29:12045–12058. doi: 10.1523/JNEUROSCI.1365-09.2009. [DOI] [PMC free article] [PubMed] [Google Scholar]
Associated Data
This section collects any data citations, data availability statements, or supplementary materials included in this article.