

Abstract
The present study characterizes the pharmacokinetic (PK) and pharmacodynamic (PD) relationships of the α2-adrenergic receptor agonists detomidine (DET), medetomidine (MED) and dexmedetomidine (DEX) in parallel groups of horses from in vivo data after single bolus doses. Head height (HH), heart rate (HR), and blood glucose concentrations were measured over 6 h. Compartmental PK and minimal physiologically based PK (mPBPK) models were applied and incorporated into basic and extended indirect response models (IRM). Population PK/PD analysis was conducted using the Monolix software implementing the stochastic approximation expectation maximization algorithm. Marked reductions in HH and HR were found. The drug concentrations required to obtain inhibition at half-maximal effect (IC50) were approximately four times larger for DET than MED and DEX for both HH and HR. These effects were not gender dependent. Medetomidine had a greater influence on the increase in glucose concentration than DEX. The developed models demonstrate the use of mechanistic and mPBPK/PD models for the analysis of clinically obtainable in vivo data.
Introduction
The use of α2-adrenergic receptor (α2-AR) agonists in veterinary medicine was first reported by Clark and Hall in the 1960's assessing the sedative effects of xylazine in horses and cattle (Clarke & Hall, 1969). Other α2-AR agonists, such as detomidine (DET), romifidine, medetomidine (MED), and dexmedetomidine (DEX) have been introduced and become a vital tool for veterinarians in small and large animal practice. Such agents provide dose-dependent sedation, serve as a useful premedication prior to general anesthesia, reduce the amount of required injectable anesthesia (Bührer et al., 1994), decrease minimum alveolar concentration (MAC) of inhaled anesthetic agents (Savola et al., 1991; Ewing et al., 1993), act synergistically with opioids, and have the added benefit of analgesic properties (Short, 1992). Furthermore, α2-AR agonists can be administered by intravenous (i.v.), intramuscular (IM), sublingual, transdermal, and epidural routes, and their effects are reversible by antagonists such as yohimbine and atipamezole (Schwartz & Clark, 1998).
While many studies have investigated the clinical effects of these drugs, very few have characterized the pharmacokinetic (PK) and pharmacodynamic (PD) relationship of α2-AR agonists simultaneously. To develop safe and effective dosing regimens traditional approaches evaluate drug effects as a function of dose. However, recent literature advocates studies of the pharmacology on the basis of plasma concentrations to establish PK/PD relationships (Bol et al., 1997; Toutain & Lees, 2004). In a review discussing the use of PK/PD modeling in dose optimization in veterinary medicine, Toutain and Lees state that one of several advantages of PK/PD modeling is the determination of a projected dosage regimen derived from a single dose as opposed to traditional dose-ranging studies which, by definition, require testing of multiple dosages (Toutain & Lees, 2004), thus reducing the cost of the investigation.
The use of mammillary models is extensive; however, these models are limited as they represent the body as a system of hypothetical compartments that lack physiologic and anatomic reality. Physiologically based pharmacokinetic (PBPK) models allow for one to account for the intrinsic, system components, for example, blood flow, tissue size and composition, and partition co-efficients, as well as the extrinsic drug properties, for example, absorption, distribution, metabolism, and excretion (Zhao et al., 2011). Even though a more mechanistic model is preferred, the complexities of building PBPK models limit their use. To overcome these challenges, various modifications have been made to reduce the complexity of PBPK models. Pilari and Huisinga (2010) proposed lumping of the PBPK model to establish a direct derivation of simple compartment models from PBPK models and enable a mechanistic interpretation of the classical compartment models. Recently, greater simplification was made to the PBPK model with the report of a generalized minimal-PBPK (mPBPK) modeling approach, which represents the system as a substantially lumped PBPK model (Cao & Jusko, 2012).
In contrast to naïve pooled approach used in population investigation that necessitates rich sampling from a large group of animals, a nonlinear mixed effect modeling approach can be utilized advantageously to analyze sparse data and takes into account both the fixed effects (population parameters assumed to be constant at each time point) and the random effects (sample-dependent random variables). When evaluating a subset of the larger population with a population NLMEM approach, the between-subject variability (BSV) reflects the variability only within the subset being investigated, which may or may not be consistent with the variability of the entire population. Small sample sizes and sparse data sets are common challenges encountered in veterinary pharmacological research. Population PK/PD modeling utilizes NLMEM to deal with sparse data sets and high variability to allow estimation of parameters that describe the mean population profile and consider the variability (i.e. interindividual and residual) within a data set (Ogungbenro & Aarons, 2011). One approach to population PK/PD modeling is to use a stochastic approximation expectation maximization (SAEM) algorithm. The application of the SAEM algorithm has been applied in PK/PD modeling (Lavielle & Mentré, 2007), genetic studies (Jaffrézic et al., 2006), and agronomy (Makowski & Lavielle, 2006).
Following i.v. administration of α2-AR agonists, there is an associated time delay between the peak plasma concentration (Cmax) and the time of maximal effect (Emax) (Mama et al., 2009; Grimsrud et al., 2012; Wojtasiak-Wypart et al., 2012). The observed time delay is short for the sedation and cardiovascular effects, but can be more prolonged for changes in blood glucose (Grimsrud et al., 2012; Rezende et al., 2014). A mechanistic approach to account for these time delays is to use indirect response models (IRM), which characterize drugs that stimulate or inhibit the input of production or loss of response (Dayneka et al., 1993; Mager & Jusko, 2001). Such models have been used to characterize the PK/PD for a variety of responses including the metabolic effects of terbutaline, a β-adrenergic receptor agonist, in patients with receptor polymorphisms (Lima et al., 2004) and the anticoagulant effects of warfarin (Nagashima et al., 1969).
The present study characterizes the PK/PD relationships of DET, MED, and DEX in the horse from in vivo data after a single bolus dose and use head height (HH), heart rate (HR), and whole blood glucose concentrations as physiologic PD end-points. The objectives of the present work were to (i) quantify clinically measurable effects using a mechanistic, population PK/PD analysis, (ii) compare the similarities and differences between the estimated PD parameters for the three α2-AR agonists, and (iii) implement a mPBPK modeling approach. This study utilizes clinically assessed information to establish a link between the concentration and effect to gain a better understanding of the mechanism of this class of compound, interindividual variability, and interparameter variability. This provides a more rational basis for drug selection taking into account the pharmacological differences between each drug and thus guides applied pharmacotherapy to a higher level of performance.
Methods
Data analysis
Analysis included data from three separate previously published studies where the α2-AR agonists, DET, MED, and DEX, were evaluated following a single i.v. bolus at a clinically relevant dose (Grimsrud et al., 2009, 2012; Mama et al., 2009; Rezende et al., 2014). The PK/PD of DET was also evaluated following an i.m. dose. The PK and PD data from these studies have been published elsewhere, with a limited descriptive assessment. Eight horses were used in each study as summarized in Table 1. All studies were conducted and approved in accordance with Institutional Animal Care and Use Committee (IACUC) regulations.
Table 1. Demographic summary of study subjects.
| Detomidine | Medetomidine | Dexmedetomidine | |
|---|---|---|---|
| Number of subjects | 8 | 8 | 8 |
| Males | 5 | 4 | 4 |
| Females | 3 | 4 | 4 |
| Age (years) | |||
| Mean, SD | 5.3, 3.2 | 11.7, 4.6 | Adult, exact ages unknown |
| Min, Max | 3, 11 | 4, 18 | |
| Body weight (kg) | |||
| Mean, SD | 531, 31 | 557, 54 | 473, 65 |
| Min, Max | 475, 575 | 479, 623 | 376, 564 |
| Breeds | 7 Thoroughbreds, 1 Thoroughbred cross | 7 Thoroughbreds, 1 Thoroughbred cross | Unknown |
The dosage regimens are as follows: DET (Dormosedan; Pfizer, New York City, NY, USA) was administered at 30 μg/kg, MED (Domitor; Pfizer) at 10 μg/kg, and DEX (Dexdomitor; Pfizer) at 5 μg/kg via an i.v. jugular catheter. Detomidine was also dosed i.m. at 30 μg/kg in the muscle on the opposite side of the neck to the sampling catheter. Whole blood samples were collected from an i.v. jugular catheter contralateral to the administration site prior to dosing and at 0.5, 1, 1.5, 2, 4, 6, 10, 15, 20, 30, and 45 min and 1, 1.5, 2, 2.5, 3, 4, 5, 6, 8, 12, 18, 24, 36, and 48 h for DET and MED and at 1, 2, 4, 6, 10, 15, 20, 30, and 45 min and 1, 1.5, 2, 2.5, 3, 4, 5, 6, 8, and 10 h for DEX. Blood samples were centrifuged for plasma which was analyzed by liquid chromatography mass spectrometry (LC-MS) for determination of drug concentrations. The limit of detection was 0.20 ng/mL for DET and 0.10 ng/mL for MED and DEX. Additional blood samples were collected at 0, 2, 4, 10, 20, and 30 min and at 1, 1.5, 2, 3, 4, 5, and 6 h to determine whole blood glucose concentrations for MED and DEX. The DEX study had no 2-min time point and an added 45-min time point. The HR and HH measurements were obtained at baseline and at 4, 10, 20, 30, 45 min and 1, 1.5, 2 and 3 h postdosing. More detailed methods of these studies including analytical techniques and other physiological and behavioral measurements were published (Grimsrud et al., 2009, 2012; Mama et al., 2009; Rezende et al., 2014).
PK and PD modeling
Sequential PK/PD modeling is a traditional approach that is well established in the literature and has proven suitable in many instances (Bouw et al., 2000; Zhang et al., 2003). It is generally used in complex models, such as ours, to avoid over-parameterization of the model leading to issues in parameter identifiability.
The PK parameters were estimated by population analysis using traditional compartmental modeling or mPBPK modeling; all three drugs were assessed with both approaches. For compartmental modeling, one-, two- and three-compartment models were tested with zero-order input for i.v. data and first-order absorption for i.m. data, with and without a lag-time. The time of maximum concentration (Tmax) was delayed following i.v. dosing; therefore, a lag-time and zero-order infusion-like input (ko) with a duration Tmax were evaluated. The infusion-like input resulted in better capture of the observed data, and thus was selected as our final model. Compartmental models (Fig. 1) were parameterized using clearance (CL), intercompartmental clearance (Q), and volumes of distribution for the central (V1) and peripheral compartments (V2).
Fig. 1.

Diagram (a) displays a basic two-compartment pharmacokinetic model with i.v. and i.m. input and drug in plasma inhibiting production of response characterized by an indirect response model. Diagram (b) depicts a minimal physiological-based pharmacokinetic model with i.v. and i.m. input with the same PD model as in A. Diagram (c) is the basic two-compartment pharmacokinetic model with only dosing and transduction processes linked to the inhibitory indirect response model to account for time delay. Symbols are defined in the text and Tables 2 and 3.
Minimal physiological-based pharmacokinetic modeling
A lumped physiological-based PK model was applied with blood (Vc), muscle (Vp1), and peripheral tissue (Vp2) compartments. Cardiac output (CO) determined drug distribution from blood with a fraction (f1) distributing to muscle and a fraction (f2) distributing to Vp2 according to
| (1) |
with the initial condition C(0) = 0 and Kp1 and Kp2 are the tissue-plasma partition coefficients and C is the plasma concentration.
Fick's law of perfusion governs the extraction of drugs by the two tissues:
| (2) |
| (3) |
with
| (4) |
where the initial conditions Cp1(0) and Cp2(0) equal 0 and Dep (0) = Dose. The first-order absorption rate constant (ka) is assumed for the i.m. dose from a depot (DEP) in Vp1. The model sets BW (body weight) = Vc + Vp1 + Vp2. The fitted parameters are CL, Kp1, Kp2, and ka. The Vc was set to the blood volume for the horse at 110 mL/kg of BW (Naylor et al., 1993), CO was set to 75 mL/kg/min (Fisher & Dalton, 1959), and f1 was set to 12% CO (Staddon et al., 1979) to represent the blood flow to the muscle compartment. The f2 was defined in the model as f2 = 1–f1. Modeling was used to make initial estimates for bioavailability (F %) with the i.m./i.v. data set, which was estimated as 47%; this value was very close to the published 54% (Grimsrud et al., 2009). We then fixed this value within the model to reduce the number of parameters that were being estimated.
The post hoc individual PK parameters were used as input for the driving function for the PD models (Zhang et al., 2003).
Pharmacodynamics
The α2-AR agonists, such as DEX, cause a reduction in plasma concentrations of epinephrine and norepinephrine. In turn, these catecholamines control many physiological functions such as HR and produce sedation (Iirola et al., 2011).
Based on these mechanisms of action, inhibitory IRMs (Fig. 1) with a zero-order production rate (kin) and first-order removal rate (kout) were used to describe the resultant responses according to
| (5) |
where Imax is the maximum fractional inhibition, IC50 is the drug concentration producing 50% inhibition, and γ is a power coefficient. The rise in glucose is modeled with inhibition of the response removal (equation 6), where the drug is assumed to inhibit the uptake of glucose into tissues by acting upstream on the beta-cells of the pancreas to inhibit release of insulin (Fig. 1c) (Greene et al., 1987; Burton et al., 1997). The addition of four (i = 4) transduction steps (equation 7) were applied to account for the delay in responses (Mager & Jusko, 2001) related to insulin kinetics:
| (6) |
| (7) |
with the initial condition R(0) = R0, where R0 is an estimated parameter and Ri–1(0) = Ri(0) = R0. The zero-order production rate (kin) was estimated as a secondary parameter according to kin = R0 · kout. The parameter τ is the mean transit time. The developed models were evaluated for best fit with one to five transduction steps. Medetomidine and DEX PK were assessed separately, but the PD data were combined for the HH, HR, and glucose models with the assumption that the underlying system is identical with DEX as the active entity for both compounds. MED consists of equal parts of two optical enantiomers, dexmedetomidine and levomedetomidine, with the latter believed to be pharmacologically inactive (Hong et al., 1992).
Modeling methodology
Monolix software version 4.2.0 (http://itsm.lixoft.net/, Lixoft, Orsay, France) was used to analyze data using a nonlinear mixed effect modeling approach (NLMEM) (MONOLIX, 2011). Estimates of parameters were generated by computing the maximum likelihood of the estimator without approximation of the model using the simulated annealing version of the SAEM algorithm in combination with the Markov Chain Monte Carlo (MCMC) procedure.
For subject i, the individual parameters were defined by
| (8) |
where θi is the parameter value for the ith subject, θPOP is the parameter value for the population, ηi is the between-subject variability (BSV) on the parameter, which is normally distributed around a mean of zero and a variance of . The Imax parameter was bound between the values of 0 and 1 using a logit function.
Residual error model
The constant (equation 9), proportional (equation 10), and combined (equation 11) error models were evaluated for each model, where y is the observation, f is the parameter function of the structural model, a is the error term for the constant model, b is the error term for the proportional model, and e is a sequence of independent random variables normally distributed with a mean 0 and variance of 1.
| (9) |
| (10) |
| (11) |
Determination of goodness-of-fit
The numerical value of the objective function, Akaike information criterion (AIC), and Schwartz information criterion (BIC) were considered for final model selection as well as the graphical evaluation for assessing goodness-of-fit. The graphs generated for model evaluation included the population and individual predicted concentrations and responses over time, observed data vs. the population and individual predictions, population and individual weighted residuals versus time, and population and individual weighted residuals versus predictions.
Statistical analysis
To assess differences in the parameter estimates between the three drugs, we compared the post hoc individual estimated parameters using PASW Statistics software version 18.0 (IBM, Armonk, New York, USA). The Levene test was used to test homogeneity of variance. For HH and HR, Welch's one-way analysis of variance (ANOVA) was used for a global test of differences, followed by post hoc Tamhane's T2 test to compare each drug group pairwise. Glucose estimates were evaluated for MED and DEX using the two-sample t-test for unequal variance. The significance level was set at 0.05.
Results
Pharmacokinetics
The observed and fitted PK profiles for three representative subjects per drug group are presented in Fig. 2. The PK profiles were multiexponential necessitating compartmental models. The i.v. PK profiles (Fig. 2) display an incline phase during the early sampling times, thus incorporation of a short infusionlike input resulted in better model fittings of the early data than using a bolus input for all i.v. drug groups. A two-compartment PK model was best operative for describing the time course of the drug profiles for MED with a proportional error model and DEX with a constant error model. One animal identified as an outlier for having abnormally prolonged circulating DEX concentrations was excluded from the analysis. The primary PK parameters generated for the two-compartment model are V1, V2, Q, and CL (Table 2). The mPBPK model could not reasonably fit the drug concentration profiles for MED and DEX; conversely, it was the superior model for fitting plasma concentrations for simultaneous modeling of DET i.v. and i.m. data with a combined (i.e. additive and proportional) error model. Computational difficulties resulted when executing the model with a constant or proportional error models; thus, a combined error model was selected despite the computation of a very low estimate for the constant error term of this model. Despite this caveat, we determined that the model does in fact perform well based on visual inspection of the graphical output, precision of the other parameters, and evaluation of the diagnostic parameters. The DET mPBPK model consisted of three compartments: a central blood compartment (Vc), a peripheral muscle compartment (Vp1), and a second peripheral compartment that represented all other tissues (Vp2). The volumes of these compartments were set as fixed values in the model and calculated based on the animals' BW. The fraction of blood to muscle (f1) was calculated based on the animals' BW. The fraction of blood to all other tissues (f2) was therefore assumed to equal 1–f1. The PK parameters generated from the DET mPBPK model are ka, Kp1, Kp2, and CL (Table 2). The CL for DEX is approximately double the rate for MED, and DET CL is considerably lower than the other two drugs. The CL was estimated with greater precision than Q and tended to have lower BSV. Volume of distribution is also approximately twice as large for MED compared to DEX, while DEX has much large BSV.
Fig. 2.
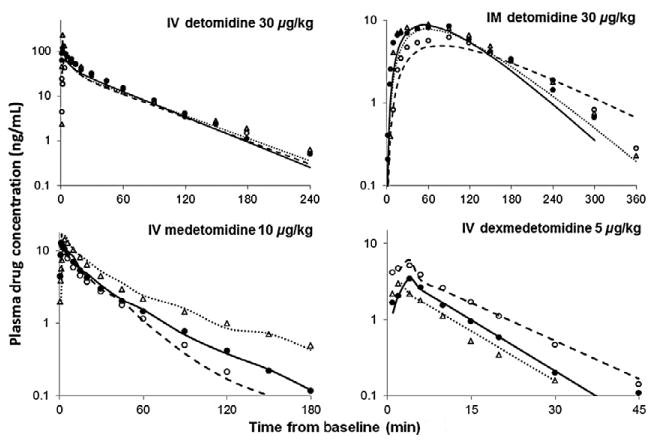
Plasma drug concentrations following a single bolus administration of i.v. detomidine, i.m. detomidine, i.v. medetomidine and i.v. dexmedetomidine. Symbols are observed plasma drug concentrations for three representative subjects from each group and the lines represent the model fitting obtained from the minimal physiologically based pharmacokinetic model for detomodine and basic PK model for medetomidine and dexmedetomidine. Key: Subject 1 (filled circle, solid line), subject 2 (open circle, dashed line) and subject 3 (open triangle, dotted line).
Table 2. Pharmacokinetic model population parameter estimates in horses.
| Parameter | Definition | Detomidine | |
|---|---|---|---|
|
| |||
| Estimate (rSE %) | BSV (%) | ||
| ka (min−1) | First-order absorption rate constant | 0.00961 (24) | 64 |
| Kp1 | Partition coefficient for Vp1 | 0.300 (23) | 57 |
| Kp2 | Partition coefficient for Vp2 | 0.467 (21) | 46 |
| CL (L/min/kg) | Blood clearance | 0.0132 (4) | 5 |
| Residual variability b | Proportional error model | 0.626 (4) | |
| Parameter | Definition | Medetomidine | Dexmedetomidine | ||
|---|---|---|---|---|---|
|
|
|
||||
| Estimate (rSE %) | BSV (%) | Estimate (rSE%) | BSV (%) | ||
| CL (L/min/kg) | Blood clearance per kg | 0.0210 (12) | 34 | 0.0441 (19) | 22 |
| Q (L/min/kg) | Inter-compartment clearance | 0.0173 (40) | 87 | 0.173 (61) | 37 |
| V1 (L/kg) | Volume, central compartment | 0.474 (14) | 36 | 0.236 (38) | 70 |
| V2 (L/kg) | Volume, peripheral compartment | 0.314 (11) | 8 | 0.163 (38) | 42 |
| Residual variability | Error model | 0.251 (8)* | 0.462 | (10)† | |
BSV, Between-subject variability; rSE, Residual standard error; RVa, Residual variability from a constant error model; RVb, Residual variability from a proportional error model.
Proportional error model.
Constant error model.
Pharmacodynamics
The observed and fitted PD profiles for three representative subjects are presented for HH (Fig. 3), HR (Fig. 4), and glucose concentrations (Fig. 5). The estimated population PD parameters are presented in Table 3. Detomidine, MED, and DEX dosing resulted in a decrease in HH and HR, and an increase in blood glucose. Population analysis of the data was successfully conducted using the estimated PK values as the driving force for the PD models and inhibitory IRMs were implemented with good convergence for all data sets. The time of maximal response was shortly after dosing for HH and HR and further delayed for glucose. The incorporation of the transduction steps to account for a time delay (τ) significantly improved the fit of the IRM used for glucose but not for HH and HR data. The best fit model included four transduction steps for the glucose data. The γ was fixed to five for the HR model for MED and DEX as the fitted estimate greatly exceeded 5. For glucose, γ was excluded from the model as the modeling yielded values near 1.0. Combining the MED and DEX data allowed for reasonable model fittings for the HH, HR, and glucose models.
Fig. 3.
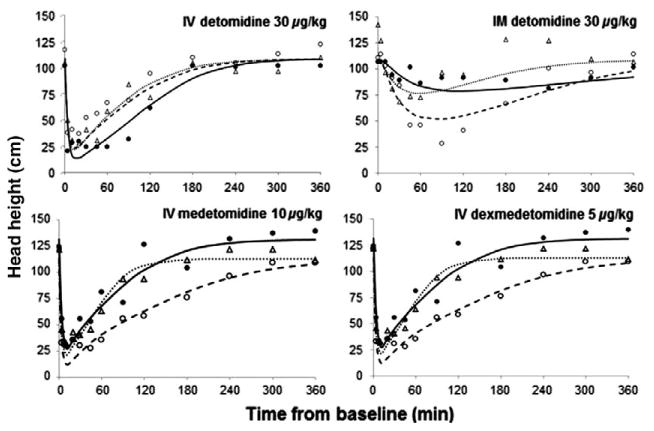
Pharmacodynamics of head height changes following single doses of i.v. detomidine, i.m. detomidine, i.v. medetomidine and i.v. dexmedetomidine. Symbols are the observed data for three representative subjects from each group and the lines represent the model predictions obtained from PD modeling. Symbols and lines are defined as in Fig. 2.
Fig. 4.
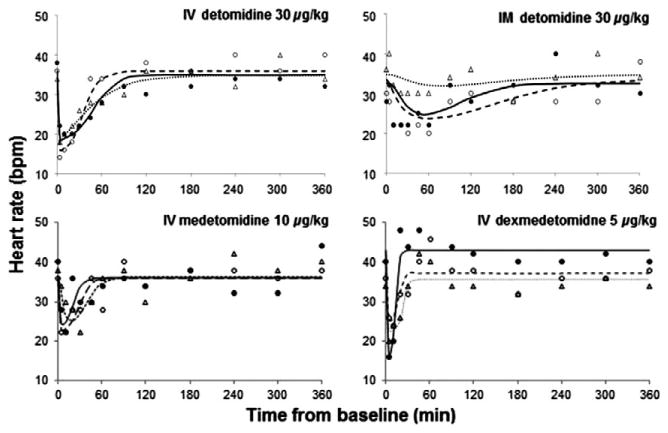
Pharmacodynamics of heart rate changes following single doses of i.v. detomidine, i.m. detomidine, i.v. medetomidine and i.v. dexmedetomidine. Symbols are the observed data for three representative subjects from each group and the lines represent the model predictions obtained from PD modeling. Symbols and lines are defined as in Fig. 2.
Fig. 5.
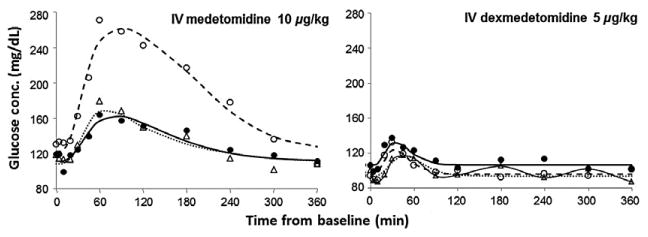
Blood glucose concentrations following single doses of i.v. medetomidine and i.v. dexmedetomidine. Symbols are the observed data for three representative subjects from each group and the lines represent the best fit obtained from PD modeling. Symbols and lines are defined as in Fig. 2.
Table 3. Pharmacodynamic model population parameter estimates for head heights and heart rates in horses.
| Parameter | Detomidine | Medetomidine/Dexmedetomidine | ||
|---|---|---|---|---|
|
|
|
|||
| Estimate (rSE %) | BSV (%) | Estimate (rSE %) | BSV (%) | |
| Head height | ||||
| IC50 (ng/mL) | 10.2 (19) | 49 | 1.26 (10)* | 13 |
| 0.469 (50)† | 126 | |||
| R0 (cm) | 108 (2) | 1 | 111 (3) | 12 |
| kout (min−1) | 0.258 (13) | 8 | 0.456 (16) | 27 |
| RVa | 14.3 (5) | 14 (6) | ||
| Heart rate | ||||
| Imax | 0.509 (5) | 20 | 0.305 (17) | 62 |
| IC50 (ng/mL) | 10.3 (17) | 43 | 1.81 (37)* | 67 |
| 1.37 (24)† | 30 | |||
| R0 (bpm) | 34.3 (2) | 5 | 37.5 (3) | 11 |
| kout (min−1) | 2.51 (51) | 133 | 0.693 (40) | 23 |
| RVb | 0.126 (5) | 0.129 (6) | ||
| Glucose | Definition | Medetomidine/Dexmedetomidine | ||
|---|---|---|---|---|
| Imax | Maximum inhibition of response | 0.532 (12) | 21 | |
| IC50 (ng/mL) | Drug concentration | 0.807 (91)* | 247 | |
| at one-half Imax | 2.73 (30)† | 13 | ||
| R0 (mg/dL) | Baseline response | 110 (3) | 12 | |
| kout (min−1) | First-order rate constant of loss of response | 0.718 (40) | 30 | |
| τ (min) | Mean transit time | 8.39 (10) | 29 | |
| RVa | 7.64 (6) | |||
BSV, Between-subject variability; rSE, Residual standard error; RVa, Residual variability from a constant error model; RVb, Residual variability from a proportional error model.
Medetomidine specific parameter.
Dexmedetomidine specific parameter.
Dosing resulted in full inhibition (Imax = 1) of HH in some animals, thus to minimize issues with over-parameterization Imax was fixed to 1.0. The inhibitory changes in HR were greater for DET (51%) than for the combined MED/DEX (31%). The estimates for IC50 were five to ten times greater for DET than MED or DEX for both HH and HR, indicative of less potency. The MED values were larger than those of DEX. The IC50 estimates for glucose were approximately three times larger for DEX than MED, with MED having considerably larger BSV. Comparison of the IC50 values for males and females for each parameter and drug group did not reveal any observable differences (Fig. 6). The shrinkage values for IC50 estimates are presented in Table 4. Published literature states that Empirical Bayes estimates-based diagnostics generally have a loss of power when shrinkage is >20–30% (Savic & Karlsson, 2009). Although three of the shrinkage values are >30%, the precision on the parameters are reasonable. Higher intra- and inter-subject variability in HR and glucose data resulted in kout being estimated with lower precision and large BSV values. A summary of the results from statistical analysis of the estimated PD parameters for individual subjects are presented in Table 5 and identifies significant differences between drug groups. Based on the results of the Levene test of homogeneity of variance, equal variance was not assumed. The Welch's ANOVA test resulted in P-values of <0.001 for IC50 and kout and 0.054 for R0 for the HH parameters and <0.001 for Imax, IC50, and kout, and 0.040 for R0 for the HR parameters.
Fig. 6.

Comparison of IC50 values between males and females for each parameter and drug group. Key: Circles: males, triangles: females, and dashed line: population mean.
Table 4. Summary of shrinkage values for IC50 parameters.
| Head height % | Heart rate % | Glucose % | |
|---|---|---|---|
| Detomidine | 0 | 14 | |
| Medetomidine | −1334 | −59 | 41 |
| Dexmedetomidine | 57 | −305 | 98 |
Table 5. Summary of statistical results for comparison of individual pharmacodynamic parameter estimates.
| Parameter | Head height† | Heart rate† | Glucose‡ | |||
|---|---|---|---|---|---|---|
|
|
|
|
||||
| Drug groups | P-value | Drug groups | P-value | Drug groups | P-value | |
| Imax | NA | DET, MED | 0.001* | MED, DEX | 0.260 | |
| DET, DEX | 0.065 | |||||
| MED, DEX | 0.730 | |||||
| IC50 | DET, MED | <0.001* | DET, MED | <0.001* | MED, DEX | 0.299 |
| DET, DEX | 0.001* | DET, DEX | <0.001* | |||
| MED, DEX | 0.262 | MED, DEX | 0.508 | |||
| R0 | DET, MED | 0.107 | DET, MED | 0.136 | MED, DEX | 0.493 |
| DET, DEX | 0.440 | DET, DEX | 0.125 | |||
| MED, DEX | 0.036* | MED, DEX | 0.583 | |||
| kout | DET, MED | <0.001* | DET, MED | <0.001* | MED, DEX | 0.030* |
| DET, DEX | <0.001* | DET, DEX | <0.001* | |||
| MED, DEX | 0.544 | MED, DEX | 0.208 | |||
| τ | NA | NA | MED, DEX | 0.038* | ||
NA, Not analyzed.
Significance P-value <0.05.
Post hoc pairwise comparisons using Tamhane's T2 used to compare DET, MED and DEX parameters.
Two-sample t-test compared MED and DEX parameters.
The data sets in the current study had few subjects for each drug and high variability hindering the ability to model each subject's data separately. Population analysis allowed estimation of PK and PD parameters with reasonable precision and determination of inter- and between-subject variability.
Discussion
Pharmacokinetics
The α2-AR agonists DET, MED, and DEX have been utilized in veterinary medicine for many years for their sedative and analgesic properties. To the authors knowledge, this report is the first to quantitatively investigate the PK/PD relationship of DET, MED, and DEX in the horse after single doses. We demonstrate that the changes in response, BSV, and residual error could be adequately characterized using population PK/ PD analysis and basic and extended inhibitory IRM. The use of population PK/PD modeling is frequently applied to further examine the dose-concentration-effect relationship in individuals, as well as to elucidate and differentiate sources of interindividual variability in response (Derendorf & Meibohm, 1999). The use of PK/PD modeling has been primarily used in drug-development and research; however, PK/PD modeling concepts can be introduced, transferred, and applied to clinical practice to predict time courses of clinical outcomes (e.g. bradycardia or hyperglycemia durations following administration of different α2-AR agonists) and provide a more rational basis for patient-specific individualized dosing. This becomes of greater importance in special populations, for example, diabetic patients or cardiovascular risk, where better understanding of the physiological impact and degree of variability within a population will better aide a clinician in drug selection.
The modification of the bolus input to a rapid infusion-like input greatly improved the predicted PK profiles and allowed for full characterization of the plasma drug concentrations. The rise in drug concentrations at early time points is believed to be due to the time for the drug molecule to travel from the injection site to the contralateral vein, which has been described in the literature (Fang et al., 2013). Such circulatory mixing of the drug may be more noticeable in these studies because of the number of samples that were obtained at early time points, the horse having a large blood volume and the fact that the horses were bradycardic. The use of the mPBPK model allowed for more physiological elements to be incorporated into the PK model resulting in better fit of the DET plasma drug concentrations. The inability to fit the MED and DEX data with the mPBPK model may be attributed to the smaller number of data points available for these groups compared to the rich data set of DET that had both i.v. and i.m. data and drug concentrations extending for a longer period of time. Over-parameterization may have also contributed. Cao and Jusko (2012) recently demonstrated the ability of mPBPK models to capture the PK profiles of numerous beta-lactams, high first-pass drugs, monoclonal antibodies, and use in allometric scaling.
We utilized an absorption rate constant for drug entry into the muscle in the mPBPK model. In principle, the absorption kinetics of any drug could be modeled more mechanistically based on use of a diffusion coefficient divided by a volume term with an initial value equal to the injection volume and expanding to the volume times the partition coefficient of the muscle at the site of injection. In turn, venous blood and lymph flow from the muscle will modify drug access to plasma and perhaps be rate limiting. Similar principles apply to gastrointestinal absorption (along with additional complexities). Both situations are typically too complex for model fitting and thus use of a rate constant such as ka provides a simple and empirical compromise for describing the movement of the mass of drug from the dosage form to the plasma. In the present case, use of total muscle volume and blood flow serves a dual role as the primary peripheral site of distribution as well as adding a physiological element to the apparent drug absorption rate. Since rate constants reflect ratios of Flow or Clearance divided by Volume, the same value will apply to a single muscle site as well as total muscle as the numerators and denominators are proportional.
Pharmacodynamics
Following administration of α2-AR agonists, responses such as HH and HR have been characterized as having a ceiling effect, where increasing the dose increases the duration of response but does not increase the magnitude. This ceiling effect is apparent when doses of 5, 20, 80, and 160 μg/kg of DET i.v. were given to horses and demonstrating that the HR decreased to values of low to mid-20 s for all three of the higher doses (Jöchle & Hamm, 1986). The ceiling effect was also demonstrated for sedation, where the magnitude of sedation was similar for the three higher doses; however, the duration was longer with increasing doses, and animals remained standing even at the higher doses. This ceiling effect has also been found for sedation and cardiovascular effects in dogs (Kuusela et al., 2000). The lower asymptote of the profiles for HR presented by Jochle and Hamm and other published literature (Short, 1992; Yamashita et al., 2000) are similar to those seen in our studies, giving us confidence that these data profiles are adequate to reasonably estimate Imax and IC50 values.
The Imax estimates indicate that MED and DEX reduce the HR by 31%, while DET reduces HR by approximately 51%. These responses may be attributed to differences in α2 to α1 AR specificity, with DET having a α2:α1 ratio of 260, whereas the ratio is 1620 for both MED and DEX (Virtanen et al., 1988). The α1-AR contributes to arrhythmia formation, which has been seen with the α2-AR agonist xylazine (Bozdogan & Dogan, 1999); this may contribute to the decrease in HR found here being greater for DET. The greater deleterious effects from DET on the cardiovascular system should be considered in the clinical setting when selecting which α2-AR agonist to use.
The HH IC50 estimates for DET were about tenfold greater than for MED and DEX; this is confirmatory for the dosing requirements between the drugs and the α2 to α1 AR specificity (Virtanen et al., 1988). These IC50 estimates reflect the differences in potencies of these drugs which should be taken into account in their therapeutic use.
Medetomidine has a significantly greater inhibitory influence on glucose compared to DEX. There is a slight difference between their time delays and the IC50 for DEX is 3.4 times larger than the IC50 for MED. This indicates that MED has a much more profound effect on the resulting glucose response, demonstrating that these two drugs do display clinical differences. Several factors contribute to the glucose concentrations and this is reflected in the large variability in the responses and estimated parameters. Following α2-AR agonist dosing, insulin release is inhibited, and the animal is sedated and not consuming food. As the drug is being eliminated, the insulin production may be returning to a functional state and the animal concurrently begins eating as it awakes. Such influences and other factors such as gluconeogenesis were not accounted for in these models. In clinical settings when a large increase in blood glucose is undesirable, DEX may be preferred over MED.
Based on graphical inspection (Fig. 6), glucose MED is the only group that appears to have a difference between IC50 values for males and females. Determination of the clinical significance of gender as a covariate is difficult, and investigation of more animals may be necessary to verify this observation. The BSV is much smaller and more consistent across drug groups for the R0 parameter although variability is reasonable for the other parameters. The loss of response, evaluated by kout, is believed to be influenced by the recovery of catecholamine production. One key advantage of this PK/PD model approach is that the dispositional properties of the drug are separate from the pharmacologic and physiologic determinants of response. The incorporation of covariates into the model is one way to reduce the BSV for these parameters. In the current study, with healthy animals, only a few subjects were used, and the incorporation of BW as a COV did not decrease the BSV neither improved model fitting. Therefore, covariants were not incorporated into the final models.
The present study has some limitations. First, each study investigated only eight animals. Second, each study was conducted separately on different animals; however, the authors sought to maintain consistency in the study design. Third, HR measurements were evaluated with stethoscope auscultation versus a continuous monitoring device. Fourth, CO and stoke volume were not evaluated in these horses. Alpha-2 AR agonists are known to reduce cardiac output (Wagner et al., 1991; Yamashita et al., 2000), and there have been mixed opinions in the literature regarding the influences on stroke volume (Wagner et al., 1991; Yamashita et al., 2000; Bettschart-Wolfensberger et al., 2005). In the present study, CO was fixed, as we had no information regarding the magnitude of change for the CO and stroke volume alterations. In spite of these limitations, we believe that the data are adequate for the assessment of the PK and PD.
The developed models demonstrate the use of mechanistic and physiological-based PK/PD models for the analysis of clinically obtainable in vivo data and are intended as a usable framework which can be applied to future studies that investigate other α2-AR agonists, other drug classes, different responses, and the incorporation of complexities such as covariates or disease states.
Acknowledgments
The authors would like to thank the Frank H. & Eva B. Buck Foundation for financially supporting this research and thank Alan Buckpitt, Don Musson, and Yulan Qi for their intellectual contributions. The authors appreciate the collaborative efforts of the University of California, Davis Clinical and Translational Science Center (CTSC), which was supported by the National Center for Advancing Translational Sciences, National Institutes of Health, through grant number UL1 TR 000002. SA-O and WJJ were supported by NIH Grant GM57980.
References
- Bettschart-Wolfensberger R, Freeman SL, Bowen IM, Aliabadi FS, Weller R, Huhtinen M, Clarke KW. Cardiopulmonary effects and pharmacokinetics of i.v. dexmedetomidine in ponies. Equine Veterinary Journal. 2005;37:60–64. doi: 10.2746/0425164054406801. [DOI] [PubMed] [Google Scholar]
- Bol CJJG, Danhof M, Stanski DR, Mandema JW. Pharmacokinetic-pharmacodynamic characterization of the cardiovascular, hypnotic, EEG and ventilatory responses to dexmedetomidine in the rat. Journal of Pharmacology and Experimental Therapeutics. 1997;283:1051–1058. [PubMed] [Google Scholar]
- Bouw MR, Gårdmark M, Hammarlund-Udenaes M. Pharmacokinetic-pharmacodynamic modelling of morphine transport across the blood-brain barrier as a cause of the antinociceptive effect delay in rats–a microdialysis study. Pharmaceutical Research. 2000;17:1220–1227. doi: 10.1023/a:1026414713509. [DOI] [PubMed] [Google Scholar]
- Bozdogan O, Dogan A. Effect of adrenergic receptor blockade with yohimbin, metoprolol or prazosin on arrhythmogenic dose of epinephrine in xylazine-kethamine anesthetized dogs. Turkish Journal of Veterinary & Animal Sciences. 1999;23:327–332. [Google Scholar]
- Bührer M, Mappes A, Lauber R, Stanski DR, Maitre PO. Dexmedetomidine decreases thiopental dose requirement and alters distribution pharmacokinetics. Anesthesiology. 1994;80:1216–1227. doi: 10.1097/00000542-199406000-00008. [DOI] [PubMed] [Google Scholar]
- Burton SA, Lemke KA, Ihle SL, Mackenzie AL. Effects of medetomidine on serum insulin and plasma glucose concentrations in clinically normal dogs. American Journal of Veterinary Research. 1997;58:1440–1442. [PubMed] [Google Scholar]
- Cao Y, Jusko WJ. Applications of minimal physiologically-based pharmacokinetic models. Journal of Pharmacokinetics and Pharmacodynamics. 2012;39:711–723. doi: 10.1007/s10928-012-9280-2. [DOI] [PMC free article] [PubMed] [Google Scholar]
- Clarke KW, Hall LW. “Xylazine”-a new sedative for horses and cattle. Veterinary Record. 1969;85:512–517. doi: 10.1136/vr.85.19.512. [DOI] [PubMed] [Google Scholar]
- Dayneka NL, Garg V, Jusko WJ. Comparison of four basic models of indirect pharmacodynamic responses. Journal of Pharmacokinetics and Biopharmaceutics. 1993;21:457–478. doi: 10.1007/BF01061691. [DOI] [PMC free article] [PubMed] [Google Scholar]
- Derendorf H, Meibohm B. Modeling of pharmacokinetic/ pharmacodynamic (PK/PD) relationships: concepts and perspectives. Pharmaceutical Research. 1999;16:176–185. doi: 10.1023/a:1011907920641. [DOI] [PubMed] [Google Scholar]
- Ewing KK, Mohammed HO, Scarlett JM, Short CE. Reduction of isoflurane anesthetic requirement by medetomidine and its restoration by atipamezole in dogs. American Journal of Veterinary Research. 1993;54:294–299. [PubMed] [Google Scholar]
- Fang J, Landersdorfer CB, Cirincione B, Jusko WJ. Study reanalysis using a mechanism-based pharmacokinetic/pharmacodynamic model of pramlintide in subjects with type 1 diabetes. The AAPS Journal. 2013;15:15–29. doi: 10.1208/s12248-012-9409-7. [DOI] [PMC free article] [PubMed] [Google Scholar]
- Fisher EW, Dalton RG. Cardiac output in horses. Nature. 1959;184:2020–2021. doi: 10.1038/1842020b0. [DOI] [PubMed] [Google Scholar]
- Greene SA, Thurmon JC, Tranquilli WJ, Benson GJ. Effect of yohimbine on xylazine-induced hypoinsulinemia and hyperglycemia in mares. American Journal of Veterinary Research. 1987;48:676–678. [PubMed] [Google Scholar]
- Grimsrud KN, Mama KR, Thomasy SM, Stanley SD. Pharmacokinetics of detomidine and its metabolites following intravenous and intramuscular administration in horses. Equine Veterinary Journal. 2009;41:361–365. doi: 10.2746/042516409x370900. [DOI] [PubMed] [Google Scholar]
- Grimsrud KN, Mama KR, Steffey EP, Stanley SD. Pharmacokinetics and pharmacodynamics of intravenous medetomidine in the horse. Veterinary Anaesthesia and Analgesia. 2012;39:38–48. doi: 10.1111/j.1467-2995.2011.00669.x. [DOI] [PubMed] [Google Scholar]
- Hong M, Milne B, Loomis C, Jhamandas K. Stereoselective effects of central alpha 2-adrenergic agonist medetomidine on in vivo catechol activity in the rat rostral ventrolateral medulla (RVLM) Brain Research. 1992;592:163–169. doi: 10.1016/0006-8993(92)91671-z. [DOI] [PubMed] [Google Scholar]
- Iirola T, Vilo S, Manner T, Aantaa R, Lahtinen M, Scheinin M, Olkkola KT. Bioavailability of dexmedetomidine after intranasal administration. European Journal of Clinical Pharmacology. 2011;67:825–831. doi: 10.1007/s00228-011-1002-y. [DOI] [PubMed] [Google Scholar]
- Jaffrézic F, Meza C, Lavielle M, Foulley JL. Genetic analysis of growth curves using the SAEM algorithm. Genetics, Selection, Evolution : GSE. 2006;38:583–600. doi: 10.1186/1297-9686-38-6-583. [DOI] [PMC free article] [PubMed] [Google Scholar]
- Jöchle W, Hamm D. Sedation and analgesia with Domosedan (detomidine hydrochloride) in horses: dose response studies on efficacy and its duration. Acta Veterinaria Scandinavica. Supplement. 1986;82:69–84. [PubMed] [Google Scholar]
- Kuusela E, Raekallio M, Anttila M, Falck I, Mölsä S, Vainio O. Clinical effects and pharmacokinetics of medetomidine and its enantiomers in dogs. Journal of Veterinary Pharmacology and Therapeutics. 2000;23:15–20. doi: 10.1046/j.1365-2885.2000.00245.x. [DOI] [PubMed] [Google Scholar]
- Lavielle M, Mentré F. nEstimation of population pharmacokinetic parameters of saquinavir in HIV patients with the MONOLIX software. Journal of Pharmacokinetics and Pharmacodynamics. 2007;34:229–249. doi: 10.1007/s10928-006-9043-z. [DOI] [PMC free article] [PubMed] [Google Scholar]
- Lima JJ, Matsushima N, Kissoon N, Wang J, Sylvester JE, Jusko WJ. Modeling the metabolic effects of terbutaline in beta2-adrenergic receptor diplotypes. Clinical Pharmacology and Therapeutics. 2004;76:27–37. doi: 10.1016/j.clpt.2004.03.006. [DOI] [PubMed] [Google Scholar]
- Mager DE, Jusko WJ. Pharmacodynamic modeling of time-dependent transduction systems. Clinical Pharmacology and Therapeutics. 2001;70:210–216. doi: 10.1067/mcp.2001.118244. [DOI] [PubMed] [Google Scholar]
- Makowski D, Lavielle M. Using SAEM to estimate parameters of models of response to applied fertilizer. Journal of Agricultural, Biological, and Environmental Statistics. 2006;11:45–60. [Google Scholar]
- Mama KR, Grimsrud K, Snell T, Stanley S. Plasma concentrations, behavioural and physiological effects following intravenous and intramuscular detomidine in horses. Equine Veterinary Journal. 2009;41:772–777. doi: 10.2746/042516409x421624. [DOI] [PubMed] [Google Scholar]
- MONOLIX. 4.0.1 User Guide. [Accessed Dec 2011];2011 http://itsm.lixoft.net/
- Nagashima R, O'Reilly RA, Levy G. Kinetics of pharmacologic effects in man: the anticoagulant action of warfarin. Clinical Pharmacology and Therapeutics. 1969;10:22–35. doi: 10.1002/cpt196910122. [DOI] [PubMed] [Google Scholar]
- Naylor JR, Bayly WM, Schott HC, 2nd, Gollnick PD, Hodgson DR. Equine plasma and blood volumes decrease with dehydration but subsequently increase with exercise. Journal of Applied Physiology. 1993;75:1002–1008. doi: 10.1152/jappl.1993.75.2.1002. [DOI] [PubMed] [Google Scholar]
- Ogungbenro K, Aarons L. Population Fisher information matrix and optimal design of discrete data responses in population pharmacodynamic experiments. Journal of Pharmacokinetics and Pharmacodynamics. 2011;38:449–469. doi: 10.1007/s10928-011-9203-7. [DOI] [PubMed] [Google Scholar]
- Pilari S, Huisinga W. Lumping of physiologically-based pharmacokinetic models and a mechanistic derivation of classical compartmental models. Journal of Pharmacokinetics and Pharmacodynamics. 2010;37:365–405. doi: 10.1007/s10928-010-9165-1. [DOI] [PubMed] [Google Scholar]
- Rezende M, Grimsrud K, Stanley S, Steffey G, Mama K. Pharmacokinetics and pharmacodynamics of intravenous dexmedetomidine in the horse. Journal of Veterinary Pharmacology and Therapeutics. 2014 doi: 10.1111/jvp.12138. accepted. [DOI] [PubMed] [Google Scholar]
- Savic RM, Karlsson MO. Importance of shrinkage in empirical bayes estimates for diagnostics: problems and solutions. The AAPS Journal. 2009;11:558–569. doi: 10.1208/s12248-009-9133-0. [DOI] [PMC free article] [PubMed] [Google Scholar]
- Savola MK, MacIver MB, Doze VA, Kendig JJ, Maze M. The alpha 2-adrenoceptor agonist dexmedetomidine increases the apparent potency of the volatile anesthetic isoflurane in rats in vivo and in hippocampal slice in vitro. Brain Research. 1991;548:23–28. doi: 10.1016/0006-8993(91)91101-6. [DOI] [PubMed] [Google Scholar]
- Schwartz DD, Clark TP. Selectivity of atipamezole, yohimbine and tolazoline for alpha-2 adrenergic receptor subtypes: implications for clinical reversal of alpha-2 adrenergic receptor mediated sedation in sheep. Journal of Veterinary Pharmacology and Therapeutics. 1998;21:342–347. doi: 10.1046/j.1365-2885.1998.00151.x. [DOI] [PubMed] [Google Scholar]
- Short CE. Sedation, Analgesia and Anaesthesia. Veterinary Practice Publishing Company; Santa Barbara, CA: 1992. Alpha2-agents in Animals; pp. 3–39. [Google Scholar]
- Staddon GE, Weaver BM, Webb AI. Distribution of cardiac output in anaesthetised horses. Research in Veterinary Science. 1979;27:38–45. [PubMed] [Google Scholar]
- Toutain PL, Lees P. Integration and modelling of pharmacokinetic and pharmacodynamic data to optimize dosage regimens in veterinary medicine. Journal of Veterinary Pharmacology and Therapeutics. 2004;27:467–477. doi: 10.1111/j.1365-2885.2004.00613.x. [DOI] [PubMed] [Google Scholar]
- Virtanen R, Savola JM, Saano V, Nyman L. Characterization of the selectivity, specificity and potency of medetomidine as an alpha 2-adrenoceptor agonist. European Journal of Pharmacology. 1988;150:9–14. doi: 10.1016/0014-2999(88)90744-3. [DOI] [PubMed] [Google Scholar]
- Wagner AE, Muir WW, 3rd, Hinchcliff KW. Cardiovascular effects of xylazine and detomidine in horses. American Journal of Veterinary Research. 1991;52:651–657. [PubMed] [Google Scholar]
- Wojtasiak-Wypart M, Soma LR, Rudy JA, Uboh CE, Boston RC, Driessen B. Pharmacokinetic profile and pharmacodynamic effects of romifidine hydrochloride in the horse. Journal of Veterinary Pharmacology and Therapeutics. 2012;35:478–488. doi: 10.1111/j.1365-2885.2011.01347.x. [DOI] [PubMed] [Google Scholar]
- Yamashita K, Tsubakishita S, Futaok S, Ueda I, Hamaguchi H, Seno T, Katoh S, Izumisawa Y, Kotani T, Muir WW. Cardiovascular effects of medetomidine, detomidine and xylazine in horses. Journal of Veterinary Medical Science. 2000;62:1025–1032. doi: 10.1292/jvms.62.1025. [DOI] [PubMed] [Google Scholar]
- Zhang L, Beal SL, Sheiner LB. Simultaneous vs. sequential analysis for population PK/PD data I: best-case performance. Journal of Pharmacokinetics and Pharmacodynamics. 2003;30:387–404. doi: 10.1023/b:jopa.0000012998.04442.1f. [DOI] [PubMed] [Google Scholar]
- Zhao P, Zhang L, Grillo JA, Liu Q, Bullock JM, Moon YJ, Song P, Brar SS, Madabushi R, Wu TC, Booth BP, Rahman NA, Reynolds KS, Gil Berglund E, Lesko LJ, Huang SM. Applications of physiologically based pharmacokinetic (PBPK) modeling and simulation during regulatory review. Clinical Pharmacology and Therapeutics. 2011;89:259–267. doi: 10.1038/clpt.2010.298. [DOI] [PubMed] [Google Scholar]