

Abstract
Purpose
Estimating perfusion metrics in healthy and cirrhotic liver with pharmacokinetic modeling of high temporal resolution reconstruction of continuously acquired free-breathing Gd-EOB-DTPA enhanced acquisition in patients undergoing clinically indicated liver MRI.
Subjects and Methods
In this HIPAA compliant prospective study, nine cirrhotic and ten non-cirrhotic patients underwent clinical MRI which included continuously acquired radial stack-of-stars 3-D GRE sequence with golden-angle ordering scheme in free-breathing during contrast injection. 1904 radial spokes were acquired continuously in 318-340 seconds. High temporal resolution data sets were formed by grouping 13 spokes per frame for temporal resolution of 2.2-2.4 second, which were reconstructed using the GRASP (Golden-angle RAdial Sparse Parallel) technique that combines compressed sensing and parallel imaging. High temporal resolution reconstructions were evaluated by a board-certified radiologist to generate gadolinium concentration-time curves in the aorta (AIF), portal vein (VIF), and liver which were fitted to dual-input dual-compartment model to estimate liver perfusion metrics; which were compared between cirrhotic and non-cirrhotic livers.
Results
Cirrhotic livers had significantly lower total plasma flow (70.1±10.1 versus 103.1±24.3 ml/min/100ml; p< 0.05), lower portal venous flow (33.4±17.7 versus 89.9±20.8ml/min/100ml; p< 0.05), and higher arterial perfusion fraction (52.0± 23.4versus 12.4±7.1%; p<0.05). The mean transit time (MTT) was higher in cirrhotics (24.4±4.7 versus 15.7±3.4 sec; p<0.05), and hepatocellular uptake rate (Ki) was lower (3.03 ±2.1 versus 6.53± 2.4 /100/min; p<0.05).
Conclusion
Liver perfusion can be estimated from free-breathing dynamic acquisition performed for every clinical exam without additional contrast injection or time. This is a novel paradigm for dynamic liver imaging.
Introduction
Dynamic contrast-enhanced (DCE) T1-weighted MR imaging of the abdomen with high temporal resolution can assess hemodynamics in tumors and organs to generate important physiologic metrics of tissue perfusion1-4. DCE-MRI metrics are being developed for specific organs, such as glomerular filtration rate in the kidney5, 6. Similarly, several studies have shown utility of liver perfusion metrics obtained with DCE MRI in diagnosis of advanced liver fibrosis7, 8, assessment of portal flow9, 10, and in evaluation of liver tumors11, 12. Use of a hepatobiliary contrast agent such as gadolinium-ethoxybenzyl-diethylenetriamine pentaacetic acid (Gd-EOB-DTPA) can potentially provide additional information about liver function in health and disease thus vastly increasing the capabilities of DCE MRI in evaluation of liver diseases13-18. Despite potential for providing valuable diagnostic information, these techniques are not implemented in clinical practice due to numerous barriers to clinical utilization. Chief amongst these is the complexity of acquisition scheme due to necessary trade-offs between temporal resolution, volumetric coverage, and spatial resolution, and the need to acquire data within a breath-hold. High temporal resolution necessary for perfusion weighted imaging (PWI) limits the volumetric coverage or spatial resolution, whereas sufficiently large volumetric coverage and high spatial resolution are necessary for clinical morphologic assessment of the liver to diagnose and characterize focal liver lesions.
One solution is to perform two separate post-contrast acquisitions, one with high spatial resolution and one with high temporal resolution, either in the same setting or in a different setting19. However, such a scheme is difficult to implement clinically due to additional imaging time and need for additional contrast injection. Furthermore, a 2-injection technique in a same imaging session is not possible when using a hepatobiliary contrast agent such as Gd-EOB-DTPA, which has hepatocyte uptake and is retained in the liver for a considerable period of time after the initial injection. Additional challenges of imaging with Gd-EOB-DTPA include low volume of injected contrast, low gadolinium dose and concentration, and respiratory motion possibly secondary to contrast agent associated dyspnea20, 21.
A recently introduced free-breathing radial acquisition scheme paired with a reconstruction method that combines compressed sensing and parallel imaging, called GRASP (Golden-angle RAdial Sparse Parallel), offers a potential solution to many of the problems of the current technology22, 23. With this approach dynamic k-space data is acquired continuously in free-breathing and reconstructed retrospectively with flexible temporal resolution by grouping different numbers of consecutive spokes in each single-dynamic frame. Larger numbers of spokes can be combined to achieve temporal resolution necessary for morphologic evaluation22, while smaller number of spokes from the same data can be combined to achieve higher temporal resolution necessary for performing pharmacokinetic modeling (Figure 1). Thus, perfusion weighted imaging can be performed in every case without additional acquisition time or contrast injection. The aim of this study was to test the feasibility of estimating perfusion metrics in healthy and cirrhotic liver with pharmacokinetic modeling of high temporal resolution reconstruction of continuously acquired free-breathing Gd-EOB-DTPA enhanced acquisition in patients undergoing clinically indicated liver MRI.
Figure 1.

Schematic of two sets of GRASP reconstruction from the same continuous contrast-enhanced radial acquisition. Reconstruction from grouping 55 spokes per dynamic frame achieved temporal resolution of approximately 10 seconds which was used for morphologic assessment. GRASP reconstruction from grouping 13 spokes per frame achieved temporal resolution of 2.2-2.4 seconds which was employed for pharmacokinetic modeling.
Materials and Methods
In this HIPAA compliant IRB approved prospective study, patients scheduled for clinically indicated Gd-EOB-DTPA enhanced liver MRI from 1/1/2014 to 4/30/2014 were recruited to undergo free-breathing dynamic imaging of the liver with GRASP instead of conventional breath-hold Cartesian acquisition. Inclusion criteria: Patients scheduled to undergo clinical liver MR exam with hepatobiliary contrast agent on a scanner equipped to perform GRASP acquisition for either evaluation of patients with liver cirrhosis, or for evaluation of known or suspected focal liver lesions in patients without history of chronic liver disease and no liver function abnormality.
Patients
19 consecutive patients; 10 female (mean age 54.8 years, range 33.2 - 86.6 years) and 9 male (mean age 50.7 years, range 36.9 – 61.6 years) agreed to participate in the study. Nine patients underwent imaging for liver cirrhosis that was documented on prior imaging, and ten patients without history of chronic liver disease had known or possible focal liver lesion.
MR Imaging
MR imaging was performed on a 1.5 T clinical system (Siemens MAGNETOM Avanto, Erlangen, Germany) using body and spine phased-array coils. All subjects underwent axial breath-hold T1 GRE in and out of phase, axial breath-hold fat suppressed T2 TSE, axial DWI in free-breathing, and coronal breath-hold T2 HASTE (Half Fourier Acquisition Single shot Turbo spin Echo) acquisitions prior to contrast administration. Radial stack-of-stars 3-D GRE sequence with golden-angle ordering scheme was then performed in free-breathing during which intravenous contrast was injected. 1904 radial spokes were acquired continuously in 318-340 seconds with the following parameters: slice thickness = 3 mm, flip angle = 12°, FOV = 385 × 385 mm2, image matrix = 256 × 256, partial-Fourier along the slice-encoding dimension, spatial resolution = 1.5×1.5×3 mm3, TR/TE = 3.97-4.29 ms/1.71 ms, 72 partitions (interpolated), BW = 450 Hz/voxel. Intravenous injection of 10 mL Gd-EOB-DTPA (Eovist, Bayer HealthCare) was begun 20 seconds after commencement of scanning via a power injector at a rate of 1 mL/s, followed by a 20 mL saline flush also at a rate of 1 mL/s.
GRASP Reconstruction
Dynamic GRASP reconstructions were performed off-line on an external multi-core server. Raw-data were automatically transferred to this dedicated server using storage and transfer software developed in-house. GRASP reconstruction, as previously described, use a parallel computing approach to achieve sufficient reconstruction speed, where multiple slices are reconstructed in parallel after an inverse Fourier transform along the partition dimension23-25. Temporal finite differences (or temporal total variation) is used as a sparsifying transform and the reconstruction algorithm enforces joint multicoil sparsity to effectively combine compressed sensing and parallel imaging. To achieve sufficiently high reconstruction speed, the GRASP algorithm was implemented as standalone application on the Linux operating system using the C++ programming language. The reconstructed images were saved as DICOM files using the libraries provided by the DCMTK package (OFFIS, Oldenburg, Germany). Image orientation and relevant patient information were extracted from the header of the raw-data file and written into the corresponding DICOM tags.
Two sets of reconstructions were performed from each set of raw data:
Consecutive 55 spokes were grouped together into one dynamic image frame for temporal resolution of approximately 10 seconds (similar to temporal resolution of dynamic contrast-enhanced conventional breath-hold acquisitions for our morphologic liver MR protocol). These images were sent to PACS for clinical evaluation.
13 consecutive spokes were group together for temporal resolution of 2.2-2.4 sec. This high temporal resolution data was used for pharmacokinetic modeling.
Image Analysis
High temporal resolution data (reconstructed from grouping 13 consecutive spokes) in DICOM format were transferred to a MS Windows workstation running in-house developed image analysis software (FireVoxel, http://files.nyu.edu/hr18/public). Targeted image coregistration of the whole liver across different time points was performed using normalized mutual information as the voxel similarity measure24. A board-certified radiologist with over 6 years of experience in MRI interpretation performed the image analysis. Venous input function (VIF) and arterial input function (AIF) signal-intensity time curves were generated by placing free-hand regions of interests (ROIs) in the main portal vein (at the level of the porta hepatis), and the proximal abdominal aorta (at the level of the celiac axis) on a single slice at one time point and were propagated through the dynamic series. The right lobe of the liver was similarly sampled by placing a large ROI on multiple (approximately 8 to 10) consecutive transverse slices (average volume of 50 cc), excluding large vessels, to generate liver signal intensity-time curves over the ROI. Concentrations were calculated as C(t) = (S(t)/S0-1)/HCT, where S(t) is the post-contrast signal intensity, S0 the pre-contrast signal intensity, and fixed hematocrit level (HCT) of 45% was assumed25.
Dual-input dual-compartment (DIDC) model
Gadolinium-concentration curves were fitted to a dual-input dual-compartment (DIDC) model as proposed by Sourbron et al.25 The primary model parameters consist of arterial and venous plasma flows (Fa and Fv), extracellular volume Ve, and hepatocellular (intracellular) uptake rate Ki. The delay between abdominal aorta and hepatocytes (Ta) was fixed to maximum of 5 seconds25. For each possible value of parameter Ta = [0, 5sec], with increment of 1 sec, a separate optimization was performed and the optimal result was chosen from the set of generated solutions for individual Ta values based on the best fit (or the least residual). Optimization was constrained to the hypercube in parameter space. Hypercube was partition into lattice of cells and local optimization Nelder-Mead (amoeba) algorithm was performed starting from the center of each cell. Derived parameters are the total inflow F (Fa + Fv), the extracellular mean transit time MTT (Ve/[Fa + Fv + Ki]), the hepatic uptake fraction fi (Ki/[Fa + Fv + Ki]), and the arterial flow fraction fa = (Fa/[Fa + Fv]) (Figure 2).
Figure 2.
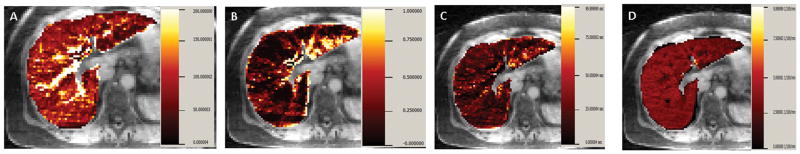
Gadolinium concentration-time curve in aorta, main portal vein, and liver in a non-cirrhotic subject were fitted with dual input dual compartment model. Illustrative example of parametric maps of (A) Total plasma flow (F), (B) Arterial fraction (%ART), (C) Mean transit time (MTT), (D) and hepatocyte uptake rate (Ki) are shown for a single transaxial slice in one non-cirrhotic subject.
Morphologic Evaluation
GRASP multi-phase reconstructions from 55 consecutive spokes with temporal resolution of approximately 10 seconds were evaluated on picture archiving and communication system (PACS; Phillips iSite, Foster City, California, USA) for each patient by a board-certified radiologist who was blinded to other acquisitions and prior examinations. GRASP pre-contrast, multiple arterial and venous phase reconstructions were reviewed. Presence of focal liver lesion greater than 0.5 cm in size were assessed and marked. Furthermore, the enhancement pattern of these lesions on GRASP acquisitions was also characterized as non-enhancing, arterial enhancing with washout, or lesion with persistent enhancement. This was compared to the interpretation of clinical MRI performed with Cartesian breath-hold acquisition in patient who had prior studies available.
Statistical Analysis
DIDC model parameters were compared between patients with liver cirrhosis and those without liver cirrhosis using a non-parametric Mann-Whitney test. Spearman correlation was performed between MELD score and various estimates of liver perfusion such as arterial flow, arterial fraction (%ART), and hepatocellular uptake rate Ki. All reported p values are two-sided and statistical significance is defined as p<0.05. SPSS (SPSS Inc, USA) was used for all computations.
Results
All patients were included in data analysis without exclusion of any subjects. Nine patients had liver cirrhosis with MELD score ranging from 7 to 14. Ten patients had no history of chronic liver disease and had no morphologic imaging features of liver cirrhosis.
Perfusion Parameters
Cirrhotic patients had significantly lower total plasma flow (F) to the liver (70.1 ± 10.1 versus 103.1 ± 24.3 ml/min/100ml; p< 0.05), lower portal venous flow (33.4 ± 17.7 versus 89.9 ± 20.8ml/min/100ml; p< 0.05), and higher arterial perfusion fraction (52.0 ± 23.4 versus 12.4 ± 7.1%; p<0.05) (Table 1; Figure 3).
Table 1.
Liver perfusion parameters in cirrhotic and non-cirrhotic patients.
| Cirrhotic (n=9) |
Non-cirrhotic (n=10) |
pValue | |
|---|---|---|---|
|
Total Plasma Flow (F) (ml/min/100ml) |
70.1 ± 10.1 | 103.1 ± 24.3 | 0.0005 |
|
Arterial Flow (Fa) (ml/min/100ml) |
36.6 ± 17.6 | 13.1 ± 8.1 | 0.0017 |
|
Portal Venous Flow (Fv) (ml/min/100ml) |
33.4 ± 17.7 | 89.9 ± 20.8 | 0.0003 |
| Arterial Fraction (%ART) | 52.0 ± 23.4 | 12.4 ± 7.1 | 0.0003 |
| Portal Venous Fraction (%VEN) | 48.0 ± 23.4 | 87.6 ± 7.1 | 0.0003 |
|
Mean Transit Time (MTT) (sec) |
24.4 ± 4.7 | 15.7 ± 3.4 | 0.0017 |
|
Extracellular Volume (Ve) (ml/100 ml) |
29.6 ± 6.2 | 28.5 ± 6.8 | 0.465 |
|
Hepatocellular Uptake Rate (Ki) (/100/min) |
3.03 ± 2.1 | 6.53 ± 2.4 | 0.0102 |
| Hepatic Uptake Fraction (fi) | 0.042 ± 0.029 | 0.061 ± 0.026 | 0.0549 |
Figure 3.

Box-plot of (A) Total plasma flow, (B) Arterial fraction (ART%), (C) Mean Transit Time (MTT) and (D) Hepatocellular uptake rate (Ki) in cirrhotic and non-cirrhotic subjects. Footnote: Center lines show the medians; box limits indicate the 25th and 75th percentiles; whiskers extend 1.5 times the interquartile range from the 25th and 75th percentiles, outliers are represented by dots.
The mean transit time (MTT) was higher in cirrhotics compared to non-cirrhotics (24.4 ± 4.7 versus 15.7 ± 3.4 sec; p<0.05). There was no statistically significant difference in distribution volume of Gd-EOB-DTPA (Ve) between the two groups (29.6 ± 6.2 versus 28.5 ± 6.8 ml/100 ml; p=0.465).
The hepatocellular uptake rate (Ki) was significantly lower in cirrhotic groups compared to non-cirrhotic group (3.03 ± 2.1 versus 6.53 ± 2.4 /100/min; p<0.05). However, hepatic uptake fraction (fi) although lower in cirrhotic (0.042 ± 0.029 vs. 0.061 ± 0.026; p =0.055) did not reach statistical significance.
There was a significant strong positive correlation between MELD score and arterial flow (r= 0.86; p =0.003) and arterial fraction (r= 0.911; p= 0.001), as well as moderate negative correlation between Ki and MELD score (r= -0.63; p= 0.067).
Morphologic Interpretation
On GRASP interpretation 4 lesions were noted in the cirrhotic patients: 1 cholangiocarcinoma, 1 cyst, and 2 dysplastic/regenerative nodules. In non-cirrhotic livers there were 19 lesions: 5 hemangiomas, 4 adenomas, and 10 FNH. The size of the lesions ranged from 0.6 cm to 3.3 cm.
All lesions seen on GRASP acquisition were also seen on prior breath-hold Cartesian studies (Figure 4 & Figure 5), which were available in 15 patients. No additional lesions were seen only on the prior breath-hold conventional Cartesian exam. Furthermore, the enhancement pattern of these lesions on GRASP acquisitions (characterized as non-enhancing, arterial enhancing with washout, or with persistent enhancement) were identical to that observed on the conventional prior BH exam.
Figure 4.

Morphologic images in a non-cirrhotic patient demonstrating an FNH (arrow) on GRASP (A) arterial and (B) venous phase of enhancement. This lesion was similarly seen on prior breath-hold Cartesian (C) arterial and (D) venous phase acquisitions
Figure 5.

Morphologic images in a patient with cholangiocarcinoma (arrow) on GRASP (A) arterial and (B) venous phase reconstruction. This lesion was seen on prior breath-hold Cartesian (C) arterial and (D) venous phase acquisitions. GRASP reconstruction with temporal resolution of 10 seconds demonstrates brisk arterial enhancement in this lesion with persistent enhancement on the delayed phase.
Discussion
Compressed sensing (CS) has recently emerged as a powerful approach for fast dynamic imaging. CS exploits image compressibility to generate faithful images from undersampled data to increase imaging speed26-29. The recently developed GRASP technique synergistically combines CS, parallel imaging, and golden-angle radial sampling, with continuous acquisition in free-breathing23. Although other methods to accelerate dynamic MR acquisitions have been proposed30-33, GRASP has the advantage of acquiring high spatial resolution images during free-breathing with access to high temporal resolution information from the same raw data. This method is therefore an ideal candidate for performing simultaneous morphologic and perfusion weighted imaging of the liver without the need to suspend respiration. It also represents a promising new paradigm for clinical workflow based on continuous comprehensive data acquisition with flexible spatiotemporal resolution tailored retroactively to clinical needs.
In this prospective study patients undergoing clinically indicated MRI of the liver with Gd-EOB-DTPA were imaged with GRASP in free-breathing. The continuously acquired data was retrospectively reconstructed with temporal resolution of approximately 10 seconds for morphologic clinical interpretation34. Using the same raw data high temporal resolution reconstructions (of 2.2 to 2.4 sec) were performed by grouping smaller number of consecutive spokes. In a recent pilot study high resolution GRASP reconstruction with approximately 3 second temporal resolution were fitted to a pharmacokinetic model to estimate kidney function (MR-GFR) in 5 subjects. The GRASP estimate of MR-GFR was shown to be within 7% of previously validated conventional Cartesian acquisition scheme34. Therefore, our aim was to test the suitability of the higher temporal resolution GRASP data to generate various liver perfusion metrics using a dual input dual compartment model in healthy and cirrhotic liver.
Our results demonstrated significantly lower total plasma flow, lower portal venous flow, and significantly higher arterial fraction due to arterial buffer response in cirrhotics when compared to non-cirrhotic patients. These values are in concordance with prior studies that used CT and MR with extracellular agent for perfusion weighted imaging of the liver4, 7, 9, 35-37. These results are encouraging as the liver perfusion metrics in our study are in the same range as prior studies despite differences in acquisition scheme, contrast agent, and model used. One of the unique advantages of our study was that the contrast dose and injection rate were identical to that used for the clinical exam, and thus liver perfusion metrics could be generated in every clinical case without the need for modifying clinical work-flow.
Mean transit time (MTT) was significantly higher in cirrhotics compared to non-cirrhotics using hepatobiliary contrast agent and DIDC model. Hagiwara et al. also demonstrated higher MTT with worsening fibrosis in patients undergoing MRI with extracellular contrast agent and a dual input single compartment model7. Similarly Van Beers et al. also demonstrated higher MTT in patients with cirrhosis37 using dual input single compartment model to analyze CT perfusion data.
Gd-EOB-DTPA is a liver-specific MR contrast agent which is eliminated roughly in equal proportions via the biliary and renal systems38, 39. It exhibits high T1 relaxivity in the liver, and shows peak enhancement effects in the normal liver approximately 20 minutes after injection on T1-weighted MR images40-42. Studies have shown that the uptake into the hepatocyte occurs at a much faster rate compared to the excretion into the biliary system which can potentially be neglected during the first five to ten minutes after contrast injection43. Thus a simplified dual-input dual compartment (DIDC) model, as used in this study, may be appropriate to analyze the dynamic data after Gd-EOB-DTPA injection25 during the first five minutes. Recent study by Sourbron et al. used a DIDC model to evaluate liver parenchyma and metastatic lesions with dynamic data acquired using Cartesian acquisition scheme with view sharing technique25. However, such a DIDC model has not been utilized to study perfusion changes in cirrhotic liver. Furthermore, view sharing technique can improve temporal resolution but at the expense of image noise and temporal blurring. In our study no view sharing was performed between dynamic frames. Motion across dynamic time frames also is a less of a concern with radial acquisition scheme as proposed in our study. With the DIDC model, an additional parameter hepatocellular uptake rate or Ki is estimated, which in our study was significantly lower in the cirrhotic patients compared to non-cirrhotic patients. Furthermore, there was negative moderate correlation between MELD and Ki, such that patients with higher MELD score had lower Ki. This interesting observation needs further evaluation.
Ki likely reflects the uptake of the contrast agent in the functioning hepatocyte through organic anion-transporting polypeptide 8 (OATP8) (also referred to as OATP1B3) receptors. However, in our study as the data is acquired only for 5 to 6 minutes after contrast injection, it does not evaluate the biliary excretion of this contrast agent from the hepatocyte to the bile ducts through the glutathione-S-transferase receptors38. Other models with imaging performed for a longer period of time have been proposed as these help to assess the excretory function of hepatocyte14-16. However, these models are difficult to implement in clinical practice as acquisition needs to be performed for much longer period of time.
In this small study all lesions seen on prior conventional breath-hold acquisition were also seen on GRASP morphologic reconstruction with concordant enhancement pattern. However, larger study performing head-to-head comparison of conventional Cartesian acquisition and multi-phase GRASP acquisition for lesion detection and characterization is warranted.
One of the limitations of this feasibility study include small numbers of patients evaluated. The relationship between the relative signal-intensity enhancement and gadolinium concentration c(t) was assumed to be linear as the gadolinium dose and concentration are relatively low. It should be noted that additional sequences (such as T1 mapping) can help to more accurately compute gadolinium concentration c(t). Lack of reference standard for liver perfusion metrics is a limitation. However the perfusion metrics in the cirrhotic and non-cirrhotic liver are in the range of expected values based on prior CT as well as MR studies with extracellular contrast agents. Impact of CS reconstructions (compared to the Cartesian reconstruction), and influence of different temporal resolution on liver perfusion metrics44 needs further investigation. Flexibility of GRASP reconstruction will permit such an investigation in future studies.
In conclusion, we have proposed a method for simultaneous morphologic and perfusion-weighted MR imaging of the liver without additional contrast injection or acquisition time. Using a dual input dual compartment model, liver perfusion metrics can be generated which are sensitive to expected changes of cirrhosis. This represents a promising novel paradigm for MR imaging of the liver with free-breathing data acquisition and flexible spatiotemporal resolution tailored to the clinical needs.
References
- 1.Padhani AR. Dynamic contrast-enhanced MRI in clinical oncology: current status and future directions. J Magn Reson Imaging. 2002;16:407–22. doi: 10.1002/jmri.10176. [DOI] [PubMed] [Google Scholar]
- 2.Pandharipande PV, Krinsky GA, Rusinek H, et al. Perfusion imaging of the liver: current challenges and future goals. Radiology. 2005;234:661–73. doi: 10.1148/radiol.2343031362. [DOI] [PubMed] [Google Scholar]
- 3.Thng CH, Koh TS, Collins DJ, et al. Perfusion magnetic resonance imaging of the liver. World J Gastroenterol. 2010;16:1598–609. doi: 10.3748/wjg.v16.i13.1598. [DOI] [PMC free article] [PubMed] [Google Scholar]
- 4.Materne R, Smith AM, Peeters F, et al. Assessment of hepatic perfusion parameters with dynamic MRI. Magn Reson Med. 2002;47:135–42. doi: 10.1002/mrm.10045. [DOI] [PubMed] [Google Scholar]
- 5.Lee VS, Rusinek H, Bokacheva L, et al. Renal function measurements from MR renography and a simplified multicompartmental model. Am J Physiol Renal Physiol. 2007;292:F1548–59. doi: 10.1152/ajprenal.00347.2006. [DOI] [PubMed] [Google Scholar]
- 6.Zhang JL, Rusinek H, Bokacheva L, et al. Functional assessment of the kidney from magnetic resonance and computed tomography renography: impulse retention approach to a multicompartment model. Magn Reson Med. 2008;59:278–88. doi: 10.1002/mrm.21489. [DOI] [PMC free article] [PubMed] [Google Scholar]
- 7.Hagiwara M, Rusinek H, Lee VS, et al. Advanced liver fibrosis: diagnosis with 3D whole-liver perfusion MR imaging--initial experience. Radiology. 2008;246:926–34. doi: 10.1148/radiol.2463070077. [DOI] [PubMed] [Google Scholar]
- 8.Yang ZH, Ye XH, Tan Y, et al. Evaluation of cirrhotic liver with perfusion-weighted magnetic resonance imaging: a preliminary experimental study in animal models with half-liver cirrhosis. Chin Med Sci J. 2006;21:252–7. [PubMed] [Google Scholar]
- 9.Annet L, Materne R, Danse E, et al. Hepatic flow parameters measured with MR imaging and Doppler US: correlations with degree of cirrhosis and portal hypertension. Radiology. 2003;229:409–14. doi: 10.1148/radiol.2292021128. [DOI] [PubMed] [Google Scholar]
- 10.Cao Y, Wang H, Johnson TD, et al. Prediction of liver function by using magnetic resonance-based portal venous perfusion imaging. Int J Radiat Oncol Biol Phys. 2013;85:258–63. doi: 10.1016/j.ijrobp.2012.02.037. [DOI] [PMC free article] [PubMed] [Google Scholar]
- 11.Taouli B, Johnson RS, Hajdu CH, et al. Hepatocellular carcinoma: perfusion quantification with dynamic contrast-enhanced MRI. AJR Am J Roentgenol. 2013;201:795–800. doi: 10.2214/AJR.12.9798. [DOI] [PMC free article] [PubMed] [Google Scholar]
- 12.Wang J, Chen LT, Tsang YM, et al. Dynamic contrast-enhanced MRI analysis of perfusion changes in advanced hepatocellular carcinoma treated with an antiangiogenic agent: a preliminary study. AJR Am J Roentgenol. 2004;183:713–9. doi: 10.2214/ajr.183.3.1830713. [DOI] [PubMed] [Google Scholar]
- 13.Chen BB, Hsu CY, Yu CW, et al. Dynamic contrast-enhanced magnetic resonance imaging with Gd-EOB-DTPA for the evaluation of liver fibrosis in chronic hepatitis patients. Eur Radiol. 2012;22:171–80. doi: 10.1007/s00330-011-2249-5. [DOI] [PubMed] [Google Scholar]
- 14.Nilsson H, Blomqvist L, Douglas L, et al. Dynamic gadoxetate-enhanced MRI for the assessment of total and segmental liver function and volume in primary sclerosing cholangitis. J Magn Reson Imaging. 2014;39:879–86. doi: 10.1002/jmri.24250. [DOI] [PubMed] [Google Scholar]
- 15.Nilsson H, Blomqvist L, Douglas L, et al. Gd-EOB-DTPA-enhanced MRI for the assessment of liver function and volume in liver cirrhosis. Br J Radiol. 2013;86:20120653. doi: 10.1259/bjr.20120653. [DOI] [PMC free article] [PubMed] [Google Scholar]
- 16.Nilsson H, Nordell A, Vargas R, et al. Assessment of hepatic extraction fraction and input relative blood flow using dynamic hepatocyte-specific contrast-enhanced MRI. J Magn Reson Imaging. 2009;29:1323–31. doi: 10.1002/jmri.21801. [DOI] [PubMed] [Google Scholar]
- 17.Haimerl M, Verloh N, Zeman F, et al. Assessment of clinical signs of liver cirrhosis using T1 mapping on Gd-EOB-DTPA-enhanced 3T MRI. PLoS One. 2013;8:e85658. doi: 10.1371/journal.pone.0085658. [DOI] [PMC free article] [PubMed] [Google Scholar]
- 18.Ryeom HK, Kim SH, Kim JY, et al. Quantitative evaluation of liver function with MRI Using Gd-EOB-DTPA. Korean J Radiol. 2004;5:231–9. doi: 10.3348/kjr.2004.5.4.231. [DOI] [PMC free article] [PubMed] [Google Scholar]
- 19.Kang SK, Huang WC, Wong S, et al. Dynamic contrast-enhanced magnetic resonance imaging measurement of renal function in patients undergoing partial nephrectomy: preliminary experience. Invest Radiol. 2013;48:687–92. doi: 10.1097/RLI.0b013e3182909e7b. [DOI] [PMC free article] [PubMed] [Google Scholar]
- 20.Davenport MS, Caoili EM, Kaza RK, et al. Matched within-Patient Cohort Study of Transient Arterial Phase Respiratory Motion-related Artifact in MR Imaging of the Liver: Gadoxetate Disodium versus Gadobenate Dimeglumine. Radiology. 2014;132269 doi: 10.1148/radiol.14132269. [DOI] [PubMed] [Google Scholar]
- 21.Davenport MS, Viglianti BL, Al-Hawary MM, et al. Comparison of acute transient dyspnea after intravenous administration of gadoxetate disodium and gadobenate dimeglumine: effect on arterial phase image quality. Radiology. 2013;266:452–61. doi: 10.1148/radiol.12120826. [DOI] [PubMed] [Google Scholar]
- 22.Chandarana H, Feng L, Block TK, et al. Free-breathing contrast-enhanced multiphase MRI of the liver using a combination of compressed sensing, parallel imaging, and golden-angle radial sampling. Invest Radiol. 2013;48:10–6. doi: 10.1097/RLI.0b013e318271869c. [DOI] [PMC free article] [PubMed] [Google Scholar]
- 23.Feng L, Grimm R, Block KT, et al. Golden-angle radial sparse parallel MRI: Combination of compressed sensing, parallel imaging, and golden-angle radial sampling for fast and flexible dynamic volumetric MRI. Magn Reson Med. 2013 doi: 10.1002/mrm.24980. [DOI] [PMC free article] [PubMed] [Google Scholar]
- 24.Mikheev A, Lee VS, Rusinek H. Targeted coregistration of abdominal DCE MRI. Proceedings of the 19th Annual Meeting of the ISMRM; Montreal, Canada. 2011. [Google Scholar]
- 25.Sourbron S, Sommer WH, Reiser MF, et al. Combined quantification of liver perfusion and function with dynamic gadoxetic acid-enhanced MR imaging. Radiology. 2012;263:874–83. doi: 10.1148/radiol.12110337. [DOI] [PubMed] [Google Scholar]
- 26.Donoho D. Compressed sensing. IEEE Trans Inf Theory. 2006;52:1289–1306. [Google Scholar]
- 27.Lustig M, Donoho D, Pauly JM. Sparse MRI: The application of compressed sensing for rapid MR imaging. Magnetic Resonance in Medicine. 2007;58:1182–1195. doi: 10.1002/mrm.21391. [DOI] [PubMed] [Google Scholar]
- 28.Block KT, Uecker M, Frahm J. Undersampled radial MRI with multiple coils. Iterative image reconstruction using a total variation constraint. Magn Reson Med. 2007;57:1086–98. doi: 10.1002/mrm.21236. [DOI] [PubMed] [Google Scholar]
- 29.Otazo R, Kim D, Axel L, et al. Combination of compressed sensing and parallel imaging for highly accelerated first-pass cardiac perfusion MRI. Magn Reson Med. 2010;64:767–76. doi: 10.1002/mrm.22463. [DOI] [PMC free article] [PubMed] [Google Scholar]
- 30.Agrawal MD, Spincemaille P, Mennitt KW, et al. Improved hepatic arterial phase MRI with 3-second temporal resolution. J Magn Reson Imaging. 2013;37:1129–36. doi: 10.1002/jmri.23920. [DOI] [PubMed] [Google Scholar]
- 31.Brodsky EK, Bultman EM, Johnson KM, et al. High-spatial and high-temporal resolution dynamic contrast-enhanced perfusion imaging of the liver with time-resolved three-dimensional radial MRI. Magn Reson Med. 2013 doi: 10.1002/mrm.24727. [DOI] [PMC free article] [PubMed] [Google Scholar]
- 32.Xu B, Spincemaille P, Chen G, et al. Fast 3D contrast enhanced MRI of the liver using temporal resolution acceleration with constrained evolution reconstruction. Magn Reson Med. 2013;69:370–81. doi: 10.1002/mrm.24253. [DOI] [PubMed] [Google Scholar]
- 33.Zhang T, Chowdhury S, Lustig M, et al. Clinical performance of contrast enhanced abdominal pediatric MRI with fast combined parallel imaging compressed sensing reconstruction. J Magn Reson Imaging. 2013 doi: 10.1002/jmri.24333. [DOI] [PMC free article] [PubMed] [Google Scholar]
- 34.BLINDED. International Society of Magnetic Resonance in Medicine (ISMRM) Milan, Italy: 2014. [Google Scholar]
- 35.Materne R, Van Beers BE, Smith AM, et al. Non-invasive quantification of liver perfusion with dynamic computed tomography and a dual-input one-compartmental model. Clin Sci (Lond) 2000;99:517–25. [PubMed] [Google Scholar]
- 36.Miles KA, Hayball MP, Dixon AK. Functional images of hepatic perfusion obtained with dynamic CT. Radiology. 1993;188:405–11. doi: 10.1148/radiology.188.2.8327686. [DOI] [PubMed] [Google Scholar]
- 37.Van Beers BE, Leconte I, Materne R, et al. Hepatic perfusion parameters in chronic liver disease: dynamic CT measurements correlated with disease severity. AJR Am J Roentgenol. 2001;176:667–73. doi: 10.2214/ajr.176.3.1760667. [DOI] [PubMed] [Google Scholar]
- 38.Hamm B, Staks T, Muhler A, et al. Phase I clinical evaluation of Gd-EOB-DTPA as a hepatobiliary MR contrast agent: safety, pharmacokinetics, and MR imaging. Radiology. 1995;195:785–92. doi: 10.1148/radiology.195.3.7754011. [DOI] [PubMed] [Google Scholar]
- 39.van Montfoort JE, Stieger B, Meijer DK, et al. Hepatic uptake of the magnetic resonance imaging contrast agent gadoxetate by the organic anion transporting polypeptide Oatp1. J Pharmacol Exp Ther. 1999;290:153–7. [PubMed] [Google Scholar]
- 40.Akimoto S, Mori H, Fujii T, et al. Optimal scan timing for Gd-EOB-DTPA enhanced liver dynamic MR imaging. Nippon Hoshasen Gijutsu Gakkai Zasshi. 2009;65:626–30. doi: 10.6009/jjrt.65.626. [DOI] [PubMed] [Google Scholar]
- 41.Motosugi U, Ichikawa T, Sou H, et al. Liver parenchymal enhancement of hepatocyte-phase images in Gd-EOB-DTPA-enhanced MR imaging: which biological markers of the liver function affect the enhancement? J Magn Reson Imaging. 2009;30:1042–6. doi: 10.1002/jmri.21956. [DOI] [PubMed] [Google Scholar]
- 42.Tamada T, Ito K, Sone T, et al. Dynamic contrast-enhanced magnetic resonance imaging of abdominal solid organ and major vessel: comparison of enhancement effect between Gd-EOB-DTPA and Gd-DTPA. J Magn Reson Imaging. 2009;29:636–40. doi: 10.1002/jmri.21689. [DOI] [PubMed] [Google Scholar]
- 43.Benness G, Khangure M, Morris I, et al. Hepatic kinetics and magnetic resonance imaging of gadolinium-EOB-DTPA in dogs. Invest Radiol. 1996;31:211–7. doi: 10.1097/00004424-199604000-00005. [DOI] [PubMed] [Google Scholar]
- 44.Gill AB, Black RT, Bowden DJ, Priest AN, Graves MJ, Lomas DJ. An investigation into the effects of temporal resolution on hepatic dynamic contrast-enhanced MRI in volunteers and in patients with hepatocellular carcinoma. Phys Med Biol. 2014;59:3187–200. doi: 10.1088/0031-9155/59/12/3187. [DOI] [PubMed] [Google Scholar]