Abstract
The objective of this technical paper is to demonstrate how graphing kinematic data to represent body segment coordination and control can assist clinicians and researchers in understanding typical and aberrant human movement patterns. Aberrant movements are believed to be associated with musculoskeletal pain and dysfunction. A dynamical systems approach to analyzing movement provides a useful way to study movement control and coordination. Continuous motion angle-angle and coupling angle-movement cycle graphs provide information about coordinated movement between body segments, whereas phase-plane graphs provide information about neuromuscular control of a body segment. Examples demonstrate how a dynamical systems approach can be used to represent (1) typical movement patterns of the lumbopelvic and shoulder regions; (2) aberrant coordination in an individual with low back pain who presented with altered lumbopelvic rhythm; and (3) aberrant control of shoulder movement in an individual with observed scapular dysrhythmia. Angle-angle and coupling angle-movement cycle graphs were consistent with clinical operational definitions of typical and altered lumbopelvic rhythm. Phase-plane graphs illustrated differences in scapular control between individuals having typical scapular motion and an individual with scapular dysrhythmia. Angle-angle, coupling angle-movement cycle, and phase-plane graphs provide information about the amount and timing of segmental motion, which clinicians assess when they observe movements. These approaches have the potential to (1) enhance understanding of typical and aberrant movement patterns; (2) assist with identifying underlying movement impairments that contribute to aberrant movements: and (3) improve clinicians’ ability to visually assess and categorize functional movements.
Physical therapists specialize in management of movement related disorders (APTA, 2001). An essential component of a physical therapy examination is visual assessment of movements as it is believed that aberrant movement is associated with musculoskeletal pain and dysfunction (Sahrmann, 2001). Therefore, a thorough understanding of the complex nature of functional movements is important for clinicians.
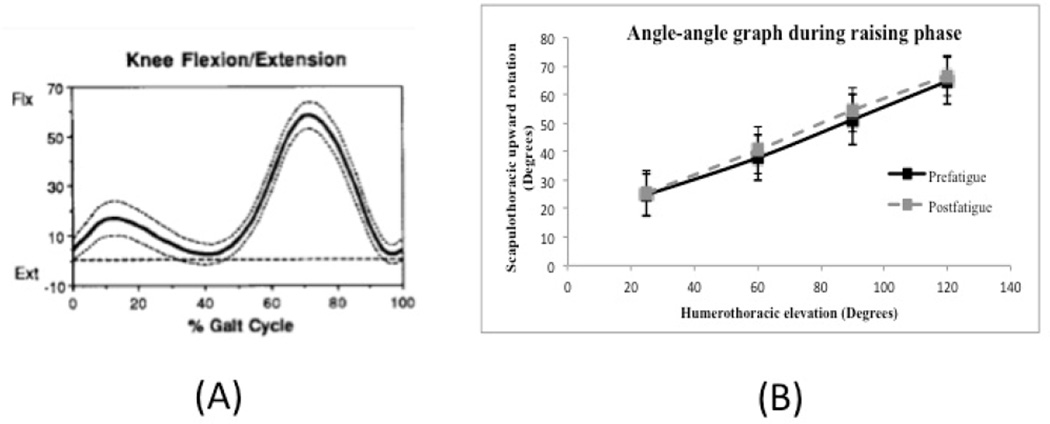
A commonly used approach for understanding typical and aberrant movement patterns focuses on the amount of motion at points in time by plotting group mean angular rotation of a body segment over a defined period along with between-subject variability (FIGURE 1A)(Kadaba et al., 1990). This approach is limited because it does not provide information about how movement is coordinated between two or more body segments
Figure 1.
Examples of graphs used to study movement patterns. (A) Knee motion curve that provides only angular motion of one segment during gait cycle. Mean knee angle (solid line) and one standard deviation (dotted lines) in sagittal plane during gait cycle in adults (Kadaba et al., 1990). (B) Angle-angle graph comparing prefatigue and postfatigue scapular upward rotation and standard error of the mean at 30°, 60°, 90°, and 120° of hum eral elevation. It should be noted that the solid and dashed lines on the graph simply connect one data point to another and are not representative of actual data or movement patterns between plotted points.
An angle-angle graph plots angular movement of one body segment against another and provides information about coordinated movement between segments (Esola et al., 1996; Ebaugh et al., 2005). Traditional use of angle-angle graphs for studying shoulder motion has focused on the amount of scapular motion at select points of humeral elevation (FIGURE 1B). Although this approach provides important information, it does not provide an accurate understanding of coordinated motion between two body segments throughout an entire movement cycle. Furthermore, an angle-angle graph does not capture temporal information about moving segments.
A dynamical systems approach has been used to study movement control and coordination (Winstein and Garfinkel, 1989; Silfies et al., 2009). This approach includes use of continuous motion angle-angle and coupling angle-movement cycle graphs to provide information about coordinated movement between body segments, whereas phase-plane graphs provide information about neuromuscular control of a segment. Additionally, it is important to understand variability associated with typical movement patterns through use of variability bands (Garofalo et al., 2009). Collectively, these approaches have the potential to expand current understanding of typical and aberrant movement patterns, and help clinicians accurately categorize functional movements.
The purpose of this technical report is to discuss the use of a dynamical systems approach to improve understanding of typical and aberrant movements. Examples of application are provided for the shoulder and spine.
Angle-angle, coupling angle-movement cycle, and phase-plane graphs
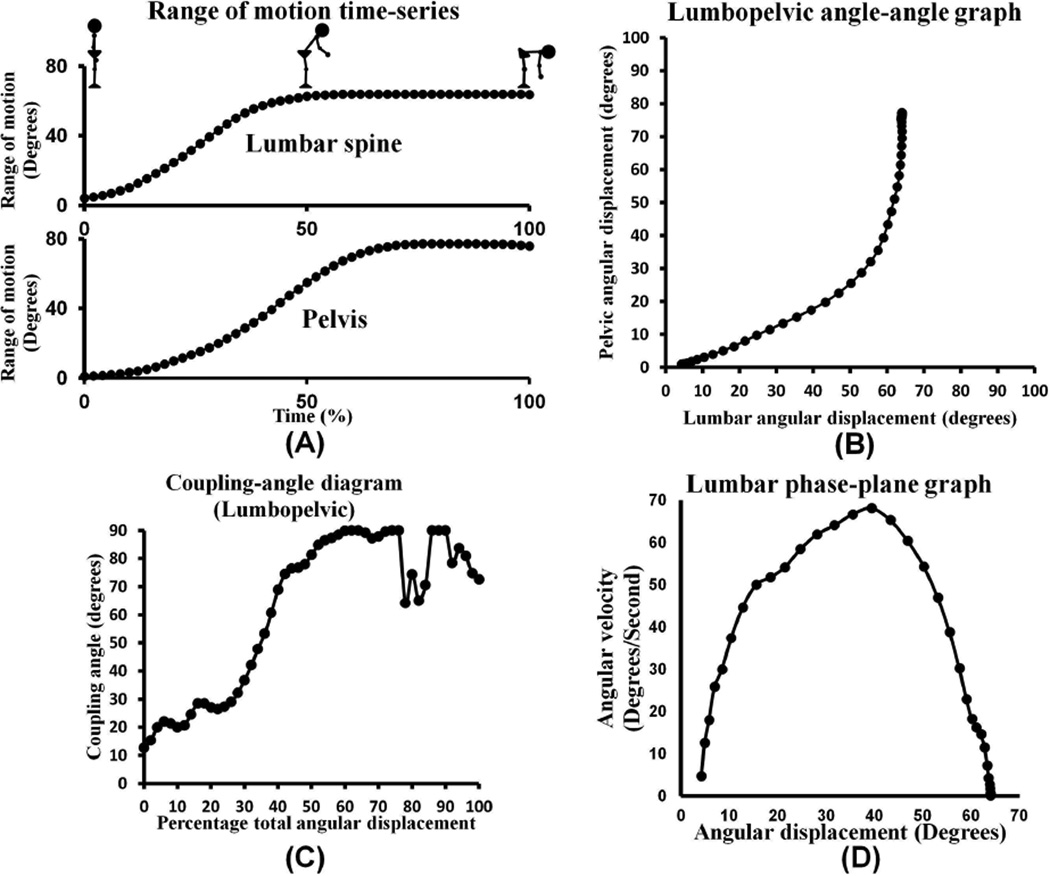
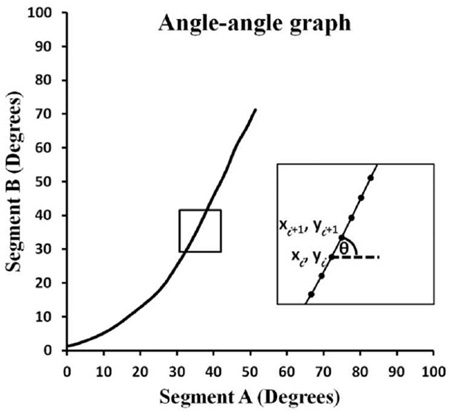
Use of continuous angular displacement data to generate angle-angle graphs focuses on the shape of the movement pattern, thereby providing information about movement coordination between body segments (FIGURES 2A and 2B)(Winstein and Garfinkel, 1989). Although these graphs provide information about movement coordination, it is difficult to determine whether graphs from different trials, individuals, or groups truly differ from each other, and by what magnitude. Coupling angle-movement cycle graphs address this problem by quantifying the relative change in motion between data points in a standardized manner over the movement task (FIGURE 2C) (Ferber et al., 2005). Coupling angles range from −90° to 90°. The sign of the coupling angle indicates whether segments are moving in the same (+) or different (-) direction, and the magnitude provides information about relative motion between segments (Ferber et al., 2005). A coupling angle of 45° indi cates 1:1 relative motion between segments. An angle greater than 45° indicat es more proximal segment motion (i.e., 63° = 2:1 proximal to distal motion), whereas an angle less than 45° indicates more distal segment motion (i.e., 26° = 1 :2 proximal to distal motion). Plotting coupling angles versus percent of movement provides information about movement coordination between body segments throughout a given task, thereby standardizing each person’s movement across time or task completion.
Figure 2.
Data collected from a trial of trunk forward bend in a subject without a history of low back pain. (A) Continuous angular displacement motion curves used to generate the angle-angle graph. (B). Angle-angle graph during standing forward bending. The slope of the line in this graph indicates the relationship or coordination of movement between the two segments. (C) Coupling angle-movement cycle graph during a forward bend movement. (D) Phase-plane graph of the lumbar spine during standing forward bend demonstrating typical smooth control of movement.
A phase-plane graph uses angular displacement (x-axis) and instantaneous angular velocity (y-axis) to provide information about neuromuscular control of a body segment (FIGURE 2D). Smooth periods of increasing, decreasing, or constant angular velocity are believed to represent typical neuromuscular control, while rapid increases or decreases in angular velocity with resultant formation of “cusps” are believe to be indicative of aberrant movement and poor control (Winstein and Garfinkel, 1989).
Movement pattern variability
A number of different methods including standard deviation, bootstrapping, root mean square error, and minimal detectable change bands (MDCB) have been used to capture variability in typical movement patterns (Lenhoff et al., 1999; Dierks and Davis, 2007; Crowther et al., 2008; Garofalo et al., 2009). Use of continuous three-dimensional kinematic data to derive averaged typical motion profiles, along with MDCB that represent variability associated with typical motion, has been advocated (Weir, 2005; Garofalo et al., 2009). Weir et al. 2005 proposed the use of 95% MDCB (although other percent confidence bands such as 90% could be used) to adequately represent the range of typical movement patterns. Use of these bands could help identify aberrant movement patterns as any pattern that clearly falls outside the boundaries created by the bands, whilst patterns that lie just inside or outside of the bands might not be markedly different.
METHODS
Subjects and data discussed below were selected from IRB approved studies conducted in our rehabilitation sciences biomechanics laboratory. All subjects consented to participation in the study and signed an informed consent form. Continuous kinematic data were collected using an electromagnetic tracking device (Liberty, Polhemus, Colchester, VT) at a sampling frequency of up to 240 Hz per sensor. Sensors were attached to the shoulder or spine and appropriate bony landmarks were digitized to create the local reference frame for the body segments using the recommendations of The International Society of Biomechanics. ((Wu et al., 2002; Wu et al., 2005). Rotations were derived from Euler angles, with the distal segment being described with respect to the proximal segment (Ebaugh et al., 2006; Silfies et al., 2009). Data were filtered with a zero lag 4th order Butterworth filter (5–8Hz) and resampled to 101 data points to standardize movement over the task. These data were then used to create indivudal and group movement pattern and coordination plots as outlined earlier in the manuscript and in the appendix.
In the following sections we provide examples of how the previously discussed methods can be used to describe (1) typical movement patterns of the lumbopelvic and shoulder regions associated with forward bending and overhead reaching motions; (2) aberrant coordination in an individual with low back pain who presented with altered lumbopelvic rhythm (LPR); and (3) aberrant control of shoulder movement in an individual with scapular dysrhythmia.
RESULTS
Lumbopelvic rhythm
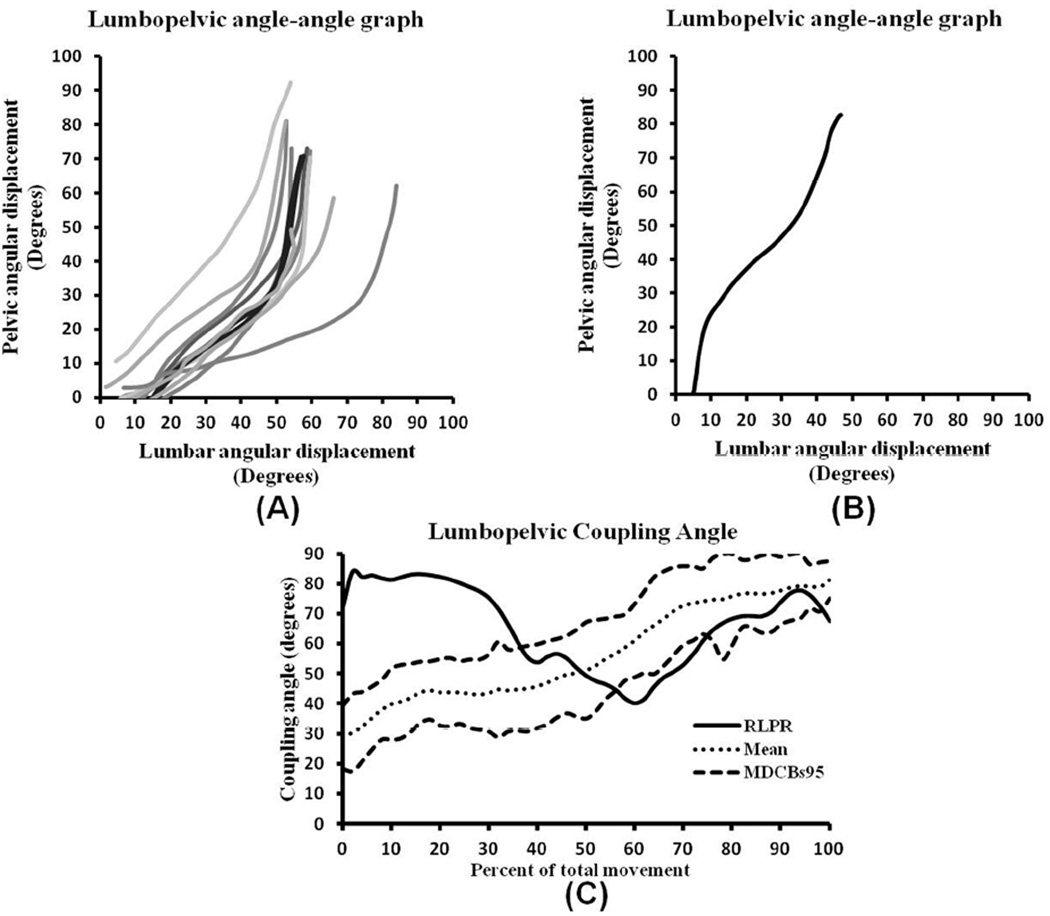
Typical LPR during trunk forward bending has been described as lumbar spine and pelvic motions occurring simultaneously, with lumbar spine motion dominating in the first 1/3 followed by shared or pelvic motion dominating as the trunk moves toward the floor (Cailliet, 1988). Angle-angle graphs (FIGURE 3A) support this clinical description and reveal a consistent pattern that starts with predominantly lumbar motion, or relatively shared motion (diagonal segment), that continues into the middle 1/3 of the movement. The pattern transitions to pelvic motion dominance (vertical segment) in the last 1/3 of the movement.
Figure 3.
Angle-angle and coupling angle graphs of forward bend derived from individuals with typical and a single subject with reversed lumbopelvic rhythm. (A) Typical lumbopelvic rhythm angle-angle graphs from 10 individuals without low back pain and clinically observed typical lumbopelvic rhythm. (B) Reversal of lumbopelvic rhythm angle-angle graph during forward bending phase in an individual with low back pain and clinically observed reversed lumbopelvic rhythm. (C) Coupling angle-movement graph where the kinematic data of an individual with observed reversal of lumbopelvic rhythm (solid line) were plotted on a graph representing a typical profile (dotted line) with 95% minimal detectable change bands (dashed lines) created from 15 healthy subjects visually rated as having a typical pattern of forward bending motion. The first 35% of the movement demonstrates a radically altered pattern from typical coordination of the lumbar spine and pelvis during this task.
Altered LPR is a deviation from the typical pattern. One example of this is reversed lumbopelvic rhythm (FIGURE 3B) in which pelvic motion dominates during the first 1/3 of the movement, transitioning to a shared pattern, and then reverting to a pelvic-dominated motion at the end of the forward bend (Biely et al., 2010). Given that subjects have differing amounts of lumbar and pelvic motion during forward bending (FIGURE 3A), movement coordination patterns across subjects should be converted to coupling angle-movement cycle graphs (Ferber et al., 2005).
Using methods described by Weir et al. 2005 and Garafoalo et al. 2009, a coupling angle-movement cycle profile was created from 15 healthy individuals with typical LPR (FIGURE 3C; APPENDIX). In the beginning part of the movement (0%–10% of total motion), the typical pattern (dotted line) smoothly and continuously increases from 30° to 45° (lumbar domination) followed by a constant angle of 45° (1:1 motion between lumbar sp ine and pelvis) between 20% and 40% of total movement. Then, the line smoothly and continuously increases from 45° to 80° (pelvic domination) as th e subjects approached the end of the forward bend motion (40% and 100% of total movement). This movement pattern closely follows the operational definition of typical LPR during the forward bending phase.
To further demonstrate the usefulness of coupling angle-movement cycle graphs, data from the individual with altered LPR was plotted on the typical coupling angle-movement cycle profile (FIGURE 3C). Between 0% and 35% of total movement, the pattern of the person with back pain moves outside of the 95% MDCB, indicating a pattern that is distinctly different from the typical pattern and indicative of altered coordination between the lumbar spine and pelvis.
Scapular Motion
Typical scapular motion has been described as minimal scapular motion during the initial 30° – 60° of humeral elevation, after which the scapula smoothly and continuously rotates up and down as the humerus is elevated and lowered respectively (McClure et al., 2009). Phase-plane graphs provide an ideal way to capture the smooth continuous upward and downward rotation that clinicians look for when assessing scapular motion.
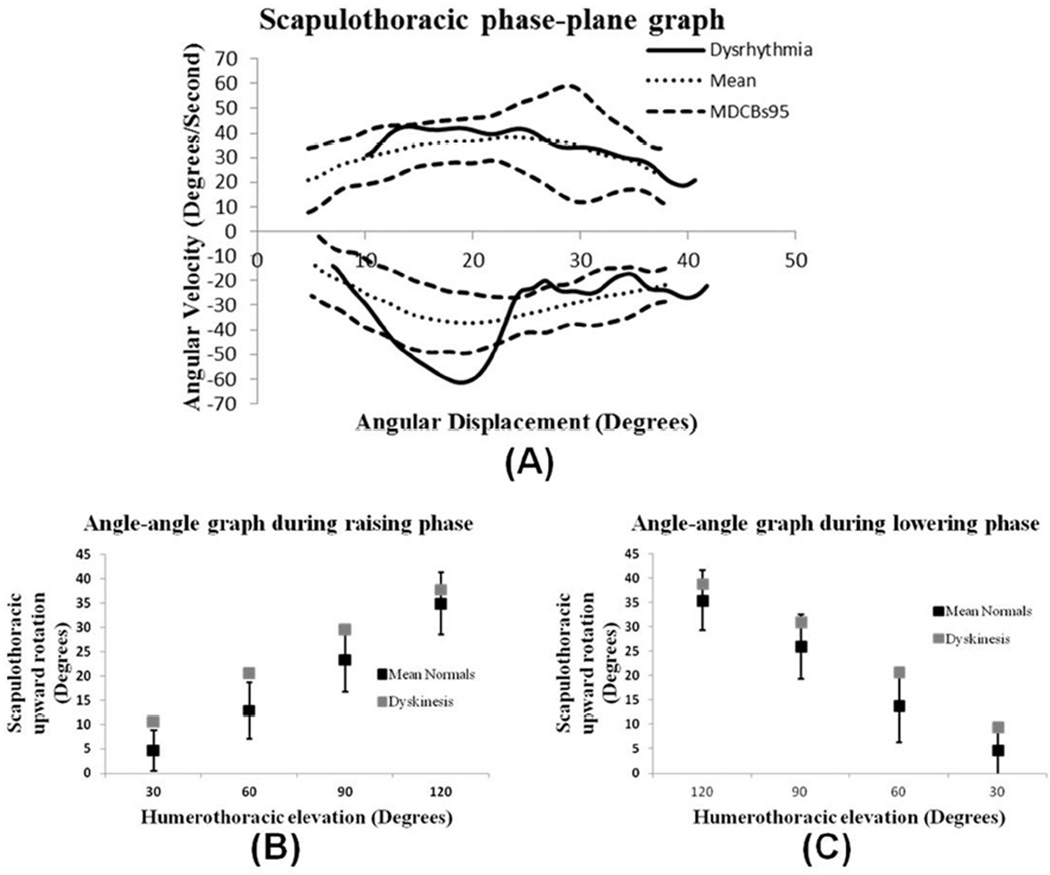
FIGURE 4A is a phase-plane graph with 95% MDCB created from data collected from 8 individuals visually rated as having typical scapular motion (Spinelli et al., 2011). As seen in the upper left side of the graph, scapular upward rotation velocity increases smoothly as the arm is elevated and gradually decreases as the arm reaches an overhead position (upper right side of the graph). As the arm is lowered to the side, scapular downward rotation velocity increases (lower right side of graph) and gradually decreases as the arm reaches the side of the body. This scapular motion pattern is consistent with the operational definition of typical scapulohumeral rhythm (McClure et al., 2009).
Figure 4.
Angle-angle and phase-plane graphs derived from individuals with typical scapulohumeral rhythm and scapular dysrhythmia. (A) Scapular upward rotation phase-plane graph. Dotted lines represent mean (n = 8) typical movement pattern; dashed lines represent 95% MDCB. Solid line represents movement pattern of individual with observed scapular dysrhythmia during the lowering phase of arm elevation. (B, C) Scapular upward rotation vs. humeral elevation of the same data plotted at 30°, 60°, 90°, and 120° of humeral elevation during both the raising (B) and lowering (C) phases of arm elevation. Black squares represent mean (n = 8) typical movement pattern +/− standard deviation; gray squares represent movement pattern of individual with scapular dysrhythmia during the lowering phase of arm elevation.
To further illustrate the usefulness of phase-plane graphs, a phase-plane graph from a subject visually rated as having scapular dysrhythmia (rapid downward rotation during the lowering phase of arm elevation (Spinelli et al., 2011)) was compared to the previously described typical phase-plane profile (FIGURE 4A). During the elevation phase, the scapula velocity pattern of the individual with scapular dysrhythmia was similar to that of subjects with typical scapular motion. However, during the lowering phase, the scapula downward rotation velocity curve for the subject with scapular dysrhythmia leaves and comes back into the MDCB, resulting in a pattern that is distinct from the typical pattern and indicative of aberrant scapular control. The aberrant pattern contains a distinct “cusp” created by a sudden increase in angular velocity from 27°/sec to 60°/sec as the scapula rapidly rotates downward from 24° to 18°. This finding is consistent with what has been referred to clinically as scapular dysrhythmia (McClure et al., 2009).
FIGURES 4B and 4C are angle-angle graphs derived from data of the same group of individuals with typical scapular motion and the one subject with scapular dysrhythmia that were used to derive the phase-plane graphs. Although differing amounts of scapular upward rotation at select points of arm elevation are revealed in these graphs, the angle-angle graph is unable to clearly show scapular dysrhythmia that was observed by the clinician and made readily apparent in the phase-plane graph. This example supports the use of phaseplane graphs in addition to angle-angle graphs as a way to improve the understanding of typical and aberrant patterns of scapular movement.
SUMMARY
Angle-angle, coupling angle-movement cycle and phase-plane graphs provide information about the coordination and control of segmental motion which clinicians assess when they observe individuals perform specific movements. Phase-plane and coupling angle graphs with 95% MDCB derived from individuals without movement dysfunction can be considered representative of typical movement patterns. Any pattern falling outside of these bands could be considered aberrant. Although our examples are specific to the shoulder and spine, these methods are potentially applicable to a wide range of body regions. We believe these approaches have the potential to (1) enhance understanding of typical and aberrant movement patterns; (2) assist with identifying underlying segment movement impairments that contribute to aberrant patterns; and (3) improve clinicians’ ability to visually assess and categorize functional movements. Use of these methods to investigate effectiveness of treatments designed to address underlying movement impairments and correct aberrant movements will help determine the efficacy of clinical interventions.
ACKNOWLEDGEMENTS
Statement of Support: Research reported in this manuscript was supported by grants from the American Physical Therapy Association-Orthopaedic Section and National Institute of Child Health and Human Development of the National Institutes of Health under award number K01HD053632. The content of this manuscript is solely the responsibility of the authors and does not necessarily represent the official views of the American Physical Therapy Association or National Institutes of Health.
APPENDIX
A coupling angle is the angle of the vector formed between two adjacent data points relative to the right and is calculated using the following formula (Ferber et al., 2005):
Coupling angles range from −90° to 90°; the sign in dicating whether segments are moving in the same (+) or different (−) directions, and the magnitude informing about relative motion between segments.
Angular velocity (ω) can be calculated from positional data using a central difference method.
where θ is the angular displacement (degree) of a segment and t is time (second).
MDCBs are created by plotting the mean of a comparison group, along with the mean +/− minimal detectable change (MDC%). MDC% is calculated using the following formula (Weir, 2005; Garofalo et al., 2009):
where the z scores for 90% and 95% are 1.67 and 1.96, respectively.
The standard error of measurement (SEM) is calculated using the following formula (Weir, 2005):
where SD is the standard deviation of scores across subjects. ICC is the intraclass correlation coefficient (2-way random effect) and can be calculated using the following formula (Weir, 2005):
where MSBS is the between-subjects mean square; MSE is the error mean square; MSBR is the between-raters mean square; k is number of raters; and n is number of subjects.
Footnotes
Publisher's Disclaimer: This is a PDF file of an unedited manuscript that has been accepted for publication. As a service to our customers we are providing this early version of the manuscript. The manuscript will undergo copyediting, typesetting, and review of the resulting proof before it is published in its final citable form. Please note that during the production process errors may be discovered which could affect the content, and all legal disclaimers that apply to the journal pertain.
REFERENCES
- American Physical Therapy Association (APTA) Guide to Physical Therapist Practice. Second Edition. American Physical Therapy Association. Physical Therapy. 2001;81:9–746. [PubMed] [Google Scholar]
- Biely SA, Wattananon P, Smith SS, Silfies SP. Clinical utility of observation of aberrant movement during standing forward bend testing: Preliminary analysis. 7th Interdisciplinary World Congress on Low Back & Pelvic Pain; Los Angelis, CA, USA. 2010. [Google Scholar]
- Cailliet R. Low back pain syndrome. Philadelphia: F.A. Davis Co; 1988. [Google Scholar]
- Crowther RG, Spinks WL, Leicht AS, Quigley F, Golledge J. Intralimb coordination variability in peripheral arterial disease. Clin Biomech (Bristol, Avon) 2008;23:357–364. doi: 10.1016/j.clinbiomech.2007.10.009. [DOI] [PubMed] [Google Scholar]
- Dierks TA, Davis I. Discrete and continuous joint coupling relationships in uninjured recreational runners. Clin Biomech (Bristol, Avon) 2007;22:581–591. doi: 10.1016/j.clinbiomech.2007.01.012. [DOI] [PubMed] [Google Scholar]
- Ebaugh DD, McClure PW, Karduna AR. Three-dimensional scapulothoracic motion during active and passive arm elevation. Clin Biomech (Bristol, Avon) 2005;20:700–709. doi: 10.1016/j.clinbiomech.2005.03.008. [DOI] [PubMed] [Google Scholar]
- Ebaugh DD, McClure PW, Karduna AR. Scapulothoracic and glenohumeral kinematics following an external rotation fatigue protocol. J Orthop Sports Phys Ther. 2006;36:557–571. doi: 10.2519/jospt.2006.2189. [DOI] [PubMed] [Google Scholar]
- Esola MA, McClure PW, Fitzgerald GK,Siegler S. Analysis of lumbar spine and hip motion during forward bending in subjects with and without a history of low back pain. Spine. 1996;21:71–78. doi: 10.1097/00007632-199601010-00017. [DOI] [PubMed] [Google Scholar]
- Ferber R, Davis IM, Williams DS., 3rd Effect of foot orthotics on rearfoot and tibia joint coupling patterns and variability. J Biomech. 2005;38:477–483. doi: 10.1016/j.jbiomech.2004.04.019. [DOI] [PubMed] [Google Scholar]
- Garofalo P, Cutti AG, Filippi MV, Cavazza S, Ferrari A, Cappello A, Davalli A. Inter-operator reliability and prediction bands of a novel protocol to measure the coordinated movements of shoulder-girdle and humerus in clinical settings. Medical & biological engineering & computing. 2009;47:475–486. doi: 10.1007/s11517-009-0454-z. [DOI] [PubMed] [Google Scholar]
- Kadaba MP, Ramakrishnan HK, Wootten ME. Measurement of lower extremity kinematics during level walking. Journal of Orthopaedic Research. 1990;8:383–392. doi: 10.1002/jor.1100080310. [DOI] [PubMed] [Google Scholar]
- Lenhoff MW, Santner TJ, Otis JC, Peterson MG, Williams BJ, Backus SI. Bootstrap prediction and confidence bands: a superior statistical method for analysis of gait data. Gait Posture. 1999;9:10–17. doi: 10.1016/s0966-6362(98)00043-5. [DOI] [PubMed] [Google Scholar]
- McClure P, Tate AR, Kareha S, Irwin D,Zlupko E. A clinical method for identifying scapular dyskinesis, part 1: reliability. J Athl Train. 2009;44:160–164. doi: 10.4085/1062-6050-44.2.160. [DOI] [PMC free article] [PubMed] [Google Scholar]
- Sahrmann SA. Diagnosis and treatment of movement impairment syndromes. Saint Louis, MO: Mosby Publishers; 2001. [Google Scholar]
- Silfies SP, Bhattacharya A, Biely S, Smith SS,Giszter S. Trunk control during standing reach: A dynamical system analysis of movement strategies in patients with mechanical low back pain. Gait & Posture. 2009;29:370–376. doi: 10.1016/j.gaitpost.2008.10.053. [DOI] [PMC free article] [PubMed] [Google Scholar]
- Spinelli B, Pontillo M, Cannella M,Ebaugh D. Repeatability of Scapular and Humeral Rotations and Phase Angles during Sagittal and Frontal Plane Arm Movements. Journal of Orthopaedic & Sports Physical Therapy. 2011;41:A66. [Google Scholar]
- Weir JP. Quantifying test-retest reliability using the intraclass correlation coefficient and the SEM. Journal of Strength & Conditioning Research. 2005;19:231–240. doi: 10.1519/15184.1. [DOI] [PubMed] [Google Scholar]
- Winstein CJ, Garfinkel A. Qualitative dynamics of disordered human locomotion: a preliminary investigation. J Mot Behav. 1989;21:373–391. doi: 10.1080/00222895.1989.10735490. [DOI] [PubMed] [Google Scholar]
- Wu G, Siegler S, Allard P, Kirtley C, Leardini A, Rosenbaum D, Whittle M, D’Lima DD, Cristofolini L, Witte H, Schmid O, Stokes I. ISB recommendation on definitions of joint coordinate system of various joints for the reporting of human joint motion—part I: ankle, hip, spine. Journal of Biomechanics. 2002;35:543–548. doi: 10.1016/s0021-9290(01)00222-6. [DOI] [PubMed] [Google Scholar]
- Wu G, van der Helm FCT, Veeger HEJ, Makhsous M, Van Roy P, Anglin C, Nagels J, Karduna AR, McQuade K, Wang X, Werner FW, Buchholz B. ISB recommendation on definitions of joint coordinate systems of various joints for the reporting of human joint motion—Part II: shoulder, elbow, wrist and hand. Journal of Biomechanics. 2005;38:981–992. doi: 10.1016/j.jbiomech.2004.05.042. [DOI] [PubMed] [Google Scholar]


