

Abstract
The slow delayed rectifier (IKs) channel is composed of the KCNQ1 channel and KCNE1 auxiliary subunit, and functions to repolarize action potentials in the human heart. IKs activators may provide therapeutic efficacy for treating long QT syndromes. Here, we show that a new KCNQ1 activator, ML277, can enhance IKs amplitude in adult guinea pig and canine ventricular myocytes. We probe its binding site and mechanism of action by computational analysis based on our recently reported KCNQ1 and KCNQ1/KCNE1 3D models, followed by experimental validation. Results from a pocket analysis and docking exercise suggest that ML277 binds to a side pocket in KCNQ1 and the KCNE1-free side pocket of KCNQ1/KCNE1. Molecular-dynamics (MD) simulations based on the most favorable channel/ML277 docking configurations reveal a well-defined ML277 binding space surrounded by the S2-S3 loop and S4-S5 helix on the intracellular side, and by S4–S6 transmembrane helices on the lateral sides. A detailed analysis of MD trajectories suggests two mechanisms of ML277 action. First, ML277 restricts the conformational dynamics of the KCNQ1 pore, optimizing K+ ion coordination in the selectivity filter and increasing current amplitudes. Second, ML277 binding induces global motions in the channel, including regions critical for KCNQ1 gating transitions. We conclude that ML277 activates IKs by binding to an intersubunit space and allosterically influencing pore conductance and gating transitions. KCNE1 association protects KCNQ1 from an arrhythmogenic (constitutive current-inducing) effect of ML277, but does not preclude its current-enhancing effect.
Introduction
The slow delayed rectifier (IKs) channel is composed of two main components: the KCNQ1 channel and the KCNE1 auxiliary subunit (1) (abbreviated as Q1 and E1, respectively). IKs functions as a repolarization reserve in the human heart, i.e., it helps to limit action potential durations (APDs) under stressful conditions, when the β-adrenergic tone is high or when other repolarizing currents are suppressed (2,3).
In recent years, there has been an increasing interest in developing Kv channel activators as therapeutic agents (4,5). In the cardiac field, the most important application is to treat acquired and congenital long QT (LQT) syndromes. Several Q1 activators are available, but they are limited by a lack of specificity (zinc pyrithione (ZnPy) activates not only Q1 but also other members of the KCNQ family, which are important in regulating neuronal excitability (4)) or low potency (phenylboronic acid increases recombinant IKs with an EC50 of 1.6 mM (6)). In 2012, a new Q1 activator, ML277 (ML), was identified (7). ML is selective for Q1 (≥100-fold more potent in activating Q1 than KCNQ2 or KCNQ4) and highly potent (EC50 < 1 μM) (7).
A previous report showed that ML is active on unsaturated IKs channels, i.e., (Q1)4/(E1)n, with n < 4 (8). Increasing the expression level of E1 eventually abolished ML’s activity. ML was active on native IKs expressed in immature cardiac myocytes derived from human induced pluripotent stem cells (8). Is ML active on IKs in adult ventricular myocytes? In this study, we address that question and several others: Where is the binding site of ML in the Q1 channel? What is the mechanism of ML action on the Q1 channel? How does E1 association with Q1 impact the binding and mechanism of action of ML? To avoid the pitfalls of a candidate binding site search, our approach begins with an in silico search for potential ligand-binding pockets in Q1 and Q1/E1 models. Detailed 3D structures of Q1 and Q1/E1 are a prerequisite for this approach. We recently developed such 3D models of Q1 and Q1/E1 (9) based on the Kv channel crystal structure (Protein Data Bank [PDB] ID: 2R9R) (10) and E1 NMR structure (PDB ID: 2K21) (11), after computational refinement to correct nonnative conformations in loop regions). Unique among currently available Q1/E1 models (11–13), our model includes the complete N-terminal domain of E1 (aa 1–43). Importantly, we have experimentally validated extensive interactions between this E1 domain and the extracellular linkers of Q1 (9).
Our results suggest that ML binds to a side pocket in Q1 and in the E1-free cleft space of Q1/E1. We provide model predictions and experimental validation for how ML increases the Q1 current amplitude and how E1 association impacts ML’s activator effect.
Materials and Methods
Computational modeling and analysis
We used the Computed Atlas of Surface Topography of Proteins (CASTp) server (14) to perform a global search for ligand-binding pockets in the Q1 and Q1/E1 models. The ML structure was optimized by Gaussian 03 (http://www.gaussian.com). We then used AutoDock 4.2 (15) to dock ML to the Q1 and Q1/E1 models. Molecular dynamics (MD) simulations were done using GROMACS v4.5.3 with the GROMOS96 53a6 force field (16).
Molecular biology
Site-directed mutagenesis of Q1 was done using the QuikChange mutagenesis kit (Invitrogen). For oocyte expression, cRNA was prepared with the use of an in vitro transcription kit (Mmessage Mmachine, Ambion, TX).
COS-7 expression and perforated patch clamp experiments
Culture and cDNA transfection of COS-7 cells were performed as described previously (3). Whole-cell currents were recorded using the perforated patch clamp configuration with an AxoPatch 200B amplifier at room temperature. Patch clamp experiments were controlled by Clampex of the pClamp10 program suite via DigiData 1440A.
Oocyte preparation and two-electrode voltage clamp experiments
Oocyte preparation, cRNA injection, and voltage clamping were done as described previously (17). Whole-oocyte currents were recorded using the two-electrode voltage clamp configuration with an OC725D amplifier at room temperature. Voltage-clamp experiments were controlled in the same manner as described above.
Cardiac myocyte isolation and perforated patch clamp experiments
Ventricular myocytes were isolated from guinea pig and canine hearts as described previously (18,19). The perforated patch clamp conditions were similar to those described for the COS-7 experiments. All recordings were done at 34 ± 1°C. APs were recorded in normal Tyrode’s solution without any blockers. During IKs recording, myocytes were exposed to 4AP (3 mM), CdCl2 (0.3 mM), and dofetilide (0.5 μM) to suppress Ito, INa, and ICaL and IKr.
Details regarding the computational modeling, MD simulations, and experimental procedures are provided in the Supporting Material.
Results and Discussion
ML277 increases native IKs amplitude in adult ventricular myocytes and works from inside the cell membrane
We tested the effect of ML277 (ML, 1 μM) on native IKs of adult guinea pig and canine ventricular myocytes (Fig. 1, A–C, left panels, and Fig. S1 A). Dofetilide (0.5 μM) was used to block IKr, and we confirmed that the current enhanced by ML was suppressed by an IKs blocker, HMR1556. ML increased the IKs amplitudes (by 22% ± 5% and 228% ± 105% in guinea pig and canine myocytes, respectively), and shortened the action potential duration (APD). ML had little effect on the L-type Ca current (ICaL) or the inward-rectifying current (IK1) (Fig. S1 B), which are important in determining the APD in ventricular myocytes. Together, these observations indicate that native IKs channels in adult ventricular myocytes are not saturated with E1, i.e., the IKs channels have fewer than four E1 subunits per Q1 tetramer channel (8), which allows ML to exert its activator effect. There were species variations in how ML affected the voltage dependence of IKs activation: it shifted the half-maximum IKs activation voltage in the depolarizing direction by 30 ± 11 mV in canine ventricular myocytes, but did not shift the IKs activation curve in guinea pig ventricular myocytes.
Figure 1.

ML277 (ML) increases native IKs amplitude in adult ventricular myocytes and works from inside the cell membrane. (A) Tail I-V relationships of IKs in guinea pig ventricular myocyte, KCNQ1/KCNE1 (Q1/E1), or KCNQ1 (Q1 alone) expressed in COS-7 cells before and after application of ML (1 μM). Inset: voltage-clamp protocol. The open arrow in the right panel of A points to the apparent constitutive current component. (B) Normalized tail I-V relationships from the same cells shown in A. For each cell, the relationship between tail current (Itail) and test pulse voltage (Vt) was fit with a simple Boltzmann function, Itail = Imax/(1 + exp((V0.5 − Vt)/k)), to estimate the maximal tail current (Imax), half-maximum activation voltage (V0.5), and slope factor (k). The fraction activated (= Itail/Imax) is plotted against Vt, superimposed on a curve calculated from the Boltzmann function. Insets: current traces before and after application of ML with Vh, Vt, and Vr marked. (C) Left: 1 μM ML shortened the APD of a guinea pig ventricular myocyte. Inset: ML structure. Middle: time course of changes in IKs amplitude in a guinea pig ventricular myocyte before, during, and after application of ML, followed by HMR1556 (HMR). Right: time course of changes in Q1 current amplitude expressed in an oocyte before and after intra-oocyte injection of ML, followed by TEA injection (estimated cytoplasmic concentrations based on assumed oocyte volume of 0.5 μl). Insets: current traces from time points marked by asterisks in the time courses. The following color scheme is used for all panels: gray, control; black, ML; dark gray, HMR or TEA. Light-gray shading in this and subsequent figures marks the time point of current measurement.
Similar to the observations for native IKs in guinea pig ventricular myocytes, ML (1 μM) increased the current amplitude of recombinant IKs (human Q1 and E1 coexpressed in COS-7 cells, with a cDNA molar ratio of 1:1) by 28% ± 10%, without shifting the voltage dependence of activation (Fig. 1, A and B, middle panels). On the other hand, when the human Q1 was expressed alone, ML not only increased the current amplitude (by 183% ± 89%) but also altered the gating kinetics: it shifted the half-maximum activation voltage in the hyperpolarizing direction by 23.9 ± 6.3 mV, greatly slowed the deactivation rate, and induced an apparent constitutive current component (Fig. 1, A and B, right panels). This ML-induced apparent constitutive component is similar to the gain-of-function phenotype of Q1 mutants associated with short QT syndrome and familial atrial fibrillation (20,21). Therefore, E1 association with Q1 prevented this arrhythmogenic (constitutive current-inducing) effect of ML, without abolishing its current-enhancing effect.
Before we began an in silico search for the ML binding sites in Q1 and Q1/E1, we needed to know from which side of the cell membrane ML accesses its binding sites. ML added to the bath solution increased native IKs over a time course of 15–20 min (Fig. 1 C, middle panel, and Fig. S1 Aa). Washing out ML for 20 min led to only an incomplete reversal of its activator effect. These observations suggest that ML might need to permeate through the cell membrane to act on the IKs channels from inside. We tested the sidedness of ML action on Q1 expressed in oocytes by intra-oocyte injection (n = 3; for an example, see Fig. 1 C, right panel). We injected 30 nl of ML solution to reach an estimated cytoplasmic concentration of 60 μM. This caused a rapid increase in the Q1 current amplitude. Subsequent injection of the same volume of tetraethylammonium (TEA) solution, reaching an estimated cytoplasmic concentration of 2 mM, caused a rapid decrease in the Q1 current amplitude. The TEA effect indicated that the ML-injection-induced increase in Q1 current amplitude was not due to a cell-swelling artifact. We conclude that ML accesses its binding site in the Q1 and Q1/E1 channels from the intracellular side of the cell membrane.
Search for ML binding sites in KCNQ1 and KCNQ1/KCNE1
We used the CASTp server (14) to search for ligand-binding pockets in the channel models. The program identified more than 200 ligand-binding pockets each in Q1 and Q1/E1. We ruled out those pockets at the external pore entrance and in the central cavity because these locations are involved in channel blockade. The remaining pockets were clustered into five major locations (Fig. S2 A). Because ML accesses its binding site from the intracellular side of the membrane, we further ruled out the two pockets that were accessible only to the extracellular solution, and focused on the remaining three pockets that were accessible to the intracellular solution.
We used AutoDock to dock ML to the Q1 and Q1/E1 models (Fig. S2 B). The docking box (size: 36 × 36 × 28 Å) was placed in the Q1 model at the geometric center of the three putative ligand-binding pockets described above. Our Q1/E1 model has two E1 subunits located at diagonal cleft spaces between Q1 subunits (9). We docked ML to Q1/E1 in two configurations: in the E1-free cleft space and in the E1-occupied cleft space. Fig. 2 A depicts the 100 top-ranking ML docking poses in each of the three systems. When ML was docked to Q1 or the E1-free cleft space of Q1/E1, the binding poses could be divided into regions 1 and 2 (R1 and R2). R1 was a peripheral site at the intracellular boundary of the S2-S3 loop and S4-S5 linker, and R2 was a pocket between the S5 and S6 helices. This distribution pattern suggests that ML accesses R1 from the intracellular solution and then moves onto R2. When ML was docked to the E1-occupied cleft space of Q1/E1, the binding poses were limited to the pocket in R2. There was no ML in the peripheral R1 site.
Figure 2.
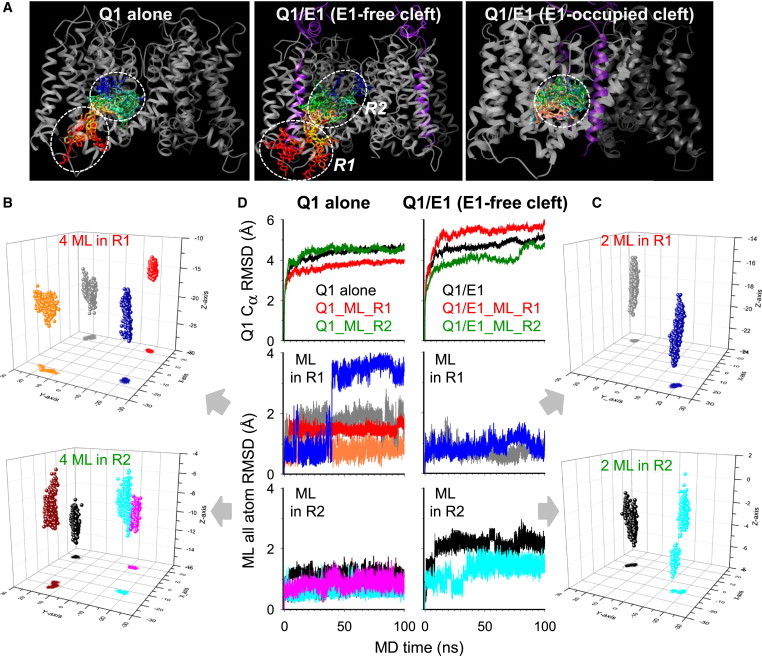
Docking ML to the Q1 and Q1/E1 models, and MD simulations. (A) Top 100 ML binding poses in Q1 (left), the E1-free cleft space of Q1/E1 (middle), and the E1-occupied cleft space of Q1/E1 (right). Q1 and E1 are shown as gray and purple ribbons, respectively. ML molecules are shown in rainbow colors. R1 and R2 demarcate binding regions 1 and 2. (B and C) 3D plots of the center of mass of ML molecules, with x-y plane projections, during 100 ns MD simulations. Four ML molecules were docked to Q1 in R1 or R2 (Q1_ML_R1 and Q1_ML_R2), and two ML molecules were docked to the equivalent positions in the E1-free cleft space of Q1/E1 (Q1/E1_ML_R1 and Q1/E1_ML_R2). The x and y axes are parallel and the z axis is normal to the plane of lipid bilayer. (D) RMSD of Q1 Cα atoms (top) and all-atoms of ML during MD trajectories. The same color scheme for ML molecules is used in B–D.
Test model prediction 1: the number of ML binding sites in KCNQ1 and KCNQ1/KCNE1
Since ML accesses R2 via R1, the lack of ML in the R1 location when docked to the E1-occupied cleft space suggested that E1 prevented ML access to its binding sites. This led to the first model prediction: each Q1 channel has four equivalent ML binding sites in the space between Q1 subunits, and the Q1/E1 channel has fewer than four ML binding sites, the number of which depends on the number of E1 subunits present. To test this prediction, we constructed concentration-response relationships between ML concentrations and the resulting increase in the current amplitudes of Q1 and Q1/E1 (Fig. 3 A). We fit the concentration-response relationships with a modified Hill equation (Fig. 3 B). If there are multiple ML binding sites and there is strong cooperativity among the binding sites (i.e., binding of the first ML molecule facilitates binding of subsequent ML molecules, so that the binding sites are either free or occupied), the Hill coefficient (nH) will approach the number of binding sites (22). For Q1 expressed in oocytes, the average nH value was 3.8 ± 0.2, supporting the model prediction of four ML binding sites per Q1 channel and suggesting a strong cooperativity among the four binding sites. For Q1 expressed in COS-7 cells, the average nH value was 2.1 ± 0.3. Importantly, the nH value was only 1.2 ± 0.2 for Q1/E1 expressed in COS-7 cells, about half of the nH value of Q1 in the same expression system. These data support the notion that there are up to four ML binding sites in the Q1 channel, but fewer in Q1/E1 because E1 prevents ML from accessing its binding site. There was also an increase in the EC50 value in Q1/E1 relative to Q1 (1.49 ± 0.05 vs. 0.25 ± 0.03 μM). The high EC50 for ML effects on Q1 expressed in oocytes (11.6 ± 0.5 μM) is likely due to the fact that the yolk is a sink of cytoplasmic ML molecules.
Figure 3.

Up to 4 ML binding sites per Q1 channel, but fewer ML binding sites in Q1/E1. (A) Top: superimposed current traces from Q1 and Q1/E1 expressed in COS-7 cells, and Q1 expressed in oocytes, elicited by the voltage-clamp protocols diagrammed in the insets, under control conditions, and the steady-state effects of increasing concentrations of ML. Current amplitudes were measured at the end of the tail currents (open arrows). Bottom: ratio of current amplitude in the presence of ML to control (IML/IC) plotted against ML concentrations ([ML], logarithmic scale) from the same cells as shown on top. Current traces and data points are coded according to the color scheme shown on the right. (B) Left: data summary. For each cell, response to ML was normalized to between 0 (control) and 1 (maximal ML effect, 10 μM in COS-7 expression and 50 μM in oocyte expression), and averaged over cells (n = 5, 3, 4, respectively). The values of fraction of maximum effect are plotted against [ML] superimposed on curves calculated from the modified Hill equation (top right). Bottom right: parameter values for the Hill equation.
Probing the ML binding sites in KCNQ1 and KCNQ1/KCNE1 by MD simulations
AutoDock treated ML as a flexible molecule, but treated proteins as rigid bodies. To probe how ML and Q1 interact with each other when both are free to move, we subjected the most favorable docking poses (based on the AutoDock ranking) to MD simulations. ML molecules were placed in the four equivalent R1 or R2 positions of Q1 (the configurations are termed Q1_ML_R1 and Q1_ML_R2 in the following text), or in the two equivalent R1 or R2 positions in the E1-free cleft space of Q1/E1 (configurations termed Q1/E1_ML_R1 and Q1/E1_ML_R2). These initial configurations are shown in Fig. S2 C. Each MD simulation lasted 100 ns, during which time the ML molecules actively sampled the cleft space between Q1 subunits (shown by the movements of the center of mass of ML molecules in Fig. 2, B and C). The ML molecules moved more along the z-axis (normal to the plane of lipid bilayer) than in the x-y plane (parallel to the plane of the lipid bilayer), reflecting the shape of the cleft space. Fig. 2 D shows the trajectories of the root mean-square deviation (RMSD) of Q1 Cα atoms and all-atoms of ML molecules. Except for Q1/E1_ML_R2, the RMSD values reached equilibrium by 50 ns. In the following analysis of MD trajectories, we focused on the 50–100 ns period.
We quantified the degree of contact between ML and Q1 during MD trajectories (for details of the data analysis, see the Supporting Material). With Q1_ML_R1 as the initial configuration, ML mainly interacted with the S2-S3 loop and the S4-S5 linker (Fig. S3 A, first panel). With Q1_ML_R2 as the initial configuration, ML interacted not only with the S2-S3 loop and S4-S5 linker, but also with the S5 and S6 helices (Fig. S3 A, second panel). We summed the two sets of data, generating the degree of ML contacts with Q1 shown in Fig. 4 A, top panel. A closer inspection of Fig. S3 B reveals a helical periodicity in the pattern of contacts between ML and the S3, S4, S4-S5, S5, and S6 helices, indicating that ML made frequent contacts with one face of each of these helices.
Figure 4.

Model prediction of ML binding space in the Q1 and Q1/E1 models. (A) Degree of ML contacts with Q1 during MD trajectories, with ML docked to Q1 (top) or E1-free space of Q1/E1 (bottom). Calculation of the degree of contacts (expressed in arbitrary units (A.U.)) is described in the Supporting Material. Transmembrane segments (S1–S6) and the pore (P) loop are highlighted by gray shading. Q1 residues tested in subsequent mutagenesis experiments are marked along the abscissa. (B) Three views of an ML binding space in the Q1 model. For clarity, only helices and loops that are directly involved in ML binding are shown (S2–S5 of one subunit (light gray ribbons) and S5-S6 of the adjacent subunit (dark gray ribbons)). The semitransparent surface represents Q1 residues predicted to interact with bound ML molecules. Eleven ML binding poses are included for illustration. Movie S1 provides a 3D view of the ML binding space in the context of the complete Q1 homology model.
A distinct ML binding space in the Q1 model emerged. Fig. 4 B depicts three views of this ML binding space. Q1 residues making contact with ML are shown as a semitransparent surface. Eleven ML docking poses are included to illustrate the passage of ML molecules from the intracellular space to R1 and then R2. Movie S1 provides a 3D view of the ML binding space in the context of the complete Q1 homology model. At the R1 site, ML engaged in π-cation interactions with R195, R243, and R249, and π-π interactions with F256. The R2 site is hydrophobic, where ML engaged in π-π interactions with F275, F332, F335, and F339. There were also hydrophobic interactions between ML and Leu and Ile side chains at both the R1 and R2 sites (details in Fig. S3 B).
The bottom two panels of Fig. S3 A show the patterns of ML contacts with Q1 in the E1-free cleft space with the initial configurations of Q1/E1_ML_R1 and Q1/E1_ML_R2. These two patterns overlap little, indicating more restricted ML movements in the cleft space of Q1/E1 than in Q1. We summed the two sets of data and plot the results in the lower panel of Fig. 4 A (degree of ML contacts with Q1 in the E1-free clef space). The summed patterns of the ML/Q1 contacts are similar between Q1 and Q1/E1, including the helical periodicity of ML contacts with a similar set of Q1 residues on the S3, S4, S4-S5, S5, and S6 helices (Fig. S3 B).
Test model prediction 2: interactions between ML and specific KCNQ1 side chains
The above results led to the second model prediction: ML makes contacts with the Q1 residues highlighted in Fig. S3 B. To test this prediction, we selected the following side chains for mutation: R195 (S2-S3 loop), R243, and R249 (S4-S5 linker). These side chains are important for ML binding to R1 by π-cation interactions. We mutated these Arg to Gln, preserving the side-chain volume and hydrophilicity, but not the charge. F275 (S5), F332, F335, and F339 (S6) engage in π-π interactions with ML in R2. We mutated these Phe to Ala, preserving the hydrophobicity but not the aromatic ring. Mutants were expressed in COS-7 cells. Fig. S4 and Table S1 show that the mutations per se had only modest effects on the Q1 gating kinetics and Q1 modulation by E1, supporting the notion that these mutations did not induce gross conformational changes in the Q1 channel. Therefore, perturbations of ML’s effect, when observed, likely resulted from local changes in the interaction between ML and the mutated Q1 side chains. We then tested the effects of 1 μM ML (the concentration that caused the maximum effect on Q1-WT; Fig. 3) on these Q1 variants. The top panel of Fig. 5 A depicts the original current traces recorded before and after the application of ML. These currents were elicited by test pulses to the plateau voltages of the respective activation curves before and after ML application (Fig. S5). The top panel of Fig. 5 B summarizes the ML-induced increases in the current amplitude (in %). Six of the seven mutants significantly reduced the current-enhancing effect of ML. The only exception was F339A, which manifested an inactivation during depolarization (Fig. 5 A, top right). ML removed the inactivation phase, leading to an increase in the current amplitude that was similar in degree to what was seen in Q1-WT. We conclude that these data support the second model prediction.
Figure 5.

Impact of mutating Q1 side chains predicted to interact with bound ML molecule on ML’s current-enhancing effect. (A) Representative current traces of Q1-WT and mutants expressed alone (top) or coexpressed with E1 (bottom) in COS-7 cells, under control conditions and the steady-state effects of 1 μM ML (gray and black traces, respectively). Left inset: voltage-clamp protocol. Vt is marked in each panel. (B) Data summary. Mutant data that differ from Q1-WT are marked by gray-black histogram bars.
ML docked to either R1 or R2 made frequent contacts with the S2-S3 loop and S4-S5 linker (Fig. S3 A, top two panels). Therefore, with an ML molecule docked to R2, it would engage key residues here (e.g., R195, R243, R249, and F256) in π-cation and π–π interactions. Under these conditions, even if another ML molecule could reach R1, the newly arrived drug molecule could not be stabilized by π-cation and π–π interactions with S2-S3 loop or S4-S5 linker. Therefore, we propose that ML can bind to R1 or R2, but not both.
Although R195Q, R249Q, F275A, and F335A suppressed the current-enhancing effect of ML, they did not prevent ML’s gating-modifying effect (slowing of deactivation; Fig. 5 A, top panel). Thus, ML’s current-enhancing effect can be dissociated from its gating-modifying effect, suggesting two separate mechanisms. Furthermore, these mutations disrupted the ability of ML binding to increase the Q1 current amplitude, without disrupting ML binding to the Q1 channel, i.e., ML increased the Q1 current amplitude by an allosteric mechanism.
When we tested the mutants on the Q1 variants coexpressed with E1, we found that R195, F275A, F332A, and F335A reduced ML’s current-enhancing effect, but F339A did not (Fig. 5, A and B, lower panels). These effects are similar to those observed in the absence of E1. However, the two mutations in the S4-S5 linker, R243Q and R249Q, did not suppress ML’s current-enhancing effect on Q1/E1. In fact, R243Q enhanced ML’s activator effect in the presence of E1. These observations suggest that E1 residing in the neighboring cleft space could impact the transmission of signal from ML binding to the pore conductance in these two mutants.
Test model prediction 3: phosphatidylinositol-4,5-bisphosphate and ML binding sites overlap
It has been suggested that R195, R243, and R249 are involved in phosphatidylinositol-4,5-bisphosphate (PIP2) binding to the Q1 channel, either by directly forming salt-bridges with the PIP2 headgroup or by playing an auxiliary role (23). We used AutoDock to dock PIP2 to the Q1 model, based on proposed PIP2 binding sites in Q1 (23) and Kv1.2 (24). Fig. 6 A (top panel) depicts the 100 top-ranking PIP2 binding poses in the Q1 model. PIP2 clashes with ML bound at R1 (Fig. 6 A, bottom panel). This led to the third prediction of our model: ML and PIP2 binding sites overlap in the Q1 channel, and PIP2 impedes ML binding. To test this model prediction, we coexpressed a voltage-activatable phosphatase, Ciona intestinalis voltage sensor-containing phosphatase (ci-VSP) (25), with Q1 in oocytes. Depolarization to >0 mV can activate the phosphatase of ci-VSP, causing a time- and voltage-dependent decrease in the PIP2 level in cell membrane (25). In oocytes coexpressing Q1 and ci-VSP, the decrease in the membrane PIP2 level was reflected by the time-dependent decline in the Q1 current amplitude at +60 mV and the decrease in test pulse currents at >0 mV (Fig. 6 B, top and bottom panels). Fig. 6 C shows that ci-VSP coexpression significantly increased the ML’s activator effect on Q1. These observations thus support the third model prediction.
Figure 6.

ML and PIP2 binding sites overlap and the cell membrane PIP2 level affects ML potency. (A) Top: side view of Q1 homology model with 100 PIP2 binding poses (eight in stick format with rainbow colors, and 92 as semitransparent structures). Bottom: the same view of Q1 with eight representative ML binding poses in R1, and the 100 PIP2 poses as semitransparent structures (enlarged view in the yellow box). (B and C) Top: superimposed current traces recorded from Q1 alone or coexpressed with ci-VSP in oocytes, elicited by the diagrammed voltage-clamp protocol under the control conditions and in the presence of 50 μM ML (black and red traces, respectively). Bottom: test pulse I-Vs from the same oocytes under control conditions and in 50 μM ML. (D) Comparison of IML/IC without versus with ci-VSP coexpression. Q1 current amplitudes were measured as peak tail currents at −40 mV after 2 s pulses to +60 mV.
A recent study reported novel PIP2 binding sites in the Q1 channel (26): R190, R192 (S2-S3 loop), R249, R259 (S4-S5 linker), and K354 (post-S6). These Q1 residues interacted with ML molecules during MD trajectories (Fig. S3 B), supporting the notion that ML and PIP2 compete for Q1 binding sites.
Probing the structural basis for ML’s action: current enhancement
The above observations suggest that ML approaches the Q1 channel from the intracellular side of the membrane, interacting with the S2-S3 loop and S4-S5 linker first, and then moving onto a side pocket and interacting with the S5 and S6 helices. How do ML interactions with these Q1 domains lead to its activator effect?
As shown in Fig. 1 A (right panel), ML increased the Q1 current amplitude at the plateau voltage of Q1’s activation curve, indicating that ML’s current-enhancing effect was independent of its gating-modifying effects. To probe the mechanism, we quantified the effect of ML on the Rb+ to K+ conductance ratio (GRb/GK) of the Q1 pore. The GRb/GK value is a simple yet sensitive test of whether the conformation of a K channel’s selectivity filter is perturbed by an intervention or not (17,27,28). Fig. 7 A shows that the GRb/GK value of the Q1 pore is 3.25 ± 0.18. ML reduced the GRb/GK value to 0.67 ± 0.07, similar to the effect of E1 (the GRb/GK value of Q1/E1 pore was 0.91 ± 0.03).
Figure 7.

ML and E1 restrict Q1 pore dimension and optimize K+ conductance. (A) Top: representative tail current traces of Q1, Q1 treated with 25 μM ML, and Q1/E1 expressed in oocytes. Currents were recorded at −80 mV after a 2 s pulse to +60 mV. The bath solution contained 98 mM K+ (black traces) or 98 mM Rb+ (magenta) as the main cations. Bottom: summary of the Rb+ to K+ conductance ratio (GRb/GK), calculated as [IRb/(−80 − ERb)]/[IK/(−80 − EK)], where IRb and ERb are the peak tail current amplitude and reversal potential in 98 mM Rb+, and IK and EK are the corresponding values in 98 mM K+. ∗∗∗p < 0.001. (B) Top: pore radii of KcsA crystal structure (PDB ID: 1K4C) and KcsA snapshot during MD simulations (modified from Shrivastava and Sansom (30)). Middle: average pore radii of Q1 alone or Q1 with four ML molecules in region 1 or region 2 (Q1_ML_R1 and Q1_ML_R2). Bottom: average pore radii of Q1 alone or Q1/E1 (reproduced from Xu et al. (9)). Zero on the pore axis represents the Cα position of Thr in the signature sequence (TVGYG of KcsA, TIGYG of Q1). S1–S4: four K+ binding sites in the selectivity filter of KcsA crystal structure. Arrows in the middle and bottom panels indicate narrow regions in the averaged Q1 pore dimensions. (C) Pore domain snapshots of Q1, Q1_ML_R1, Q1_ML_R2, and Q1/E1. For clarity, only two diagonal Q1 subunits are shown (gold ribbons). Purple spheres, K+ ions. (D) Cartoon of working hypothesis (details in text).
To deduce the structural basis for the effects of ML and E1 on the GRb/GK value of Q1 pore, we used the program HOLE (29) to quantify the Q1 pore radii in four different states: Q1 alone, Q1 with ML docked to R1 or R2, and Q1 associated with E1. The Q1 pore radii averaged from snapshots during the 50–100 ns period of the respective MD trajectories are plotted against the pore axis in Fig. 7 B (middle and lower panels). Snapshots of the Q1 pores in the four states are shown in Fig. 7 C for illustration. For reference, we also applied the same analysis to the pores of KcsA crystal structure and a KcsA snapshot during the MD trajectory (modified from Shrivastava and Sansom (30); Fig. 7 B, top panel). The pore axis was aligned by zeroing the Cα positions of Thr in the signature sequences (TVGYG for KcsA, and TIGYG for Q1).
The pore in the KcsA crystal structure has four narrow regions corresponding to four K+ binding sites (S1–S4) with approximately equal occupancies by two K+ ions in the S1-S3 or S2-S4 configuration (31). The pore in the KcsA snapshot has two narrow regions reflecting two K+ ions in the S2–S4 configuration at the moment when the snapshot was recorded. The Q1 pore had only one narrow region, corresponding to the S1/S2 site in KcsA. ML docking to the R1 or R2 site of Q1, and E1 association with Q1 restricted the inner portion of the Q1 selectivity filter so that it could coordinate a second K+ ion at the S3/S4 position. We quantified the average K+ ion occupancy in the selectivity filter during MD trajectories. Fig. S6 shows that, on average, the inner portion of the Q1 selectivity filter (0–4 Å along the pore axis) had a lower K+ occupancy in the ML-free state than in ML-bound states.
Fig. 7 D depicts our working hypothesis for how ML and E1 increase the Q1 pore conductance to K+ ions while reducing the GRb/GK value. When K+ is the charge carrier, the inner portion of the Q1 selectivity filter is too wide to effectively coordinate the K+ ion. As a result, the Q1 pore frequently enters a nonconducting state (single-channel flickering) (28) and has a small single-channel conductance, estimated to be 0.7 pS in physiological [K+] (32). When Rb+ is the charge carrier, its larger ionic radius relative to the K+ ion (1.63 vs. 1.49 Å) allows it to be better coordinated by the inner portion of the Q1 selectivity filter. This reduces the degree of single-channel flickering and produces the ≥3 GRb/GK value observed experimentally (28). When Q1 is associated with E1, E1’s extracellular domain interacts with the extracellular linkers flanking Q1’s pore loop, and E1’s TM helix interacts with Q1’s S6 helix (9). These intimate interactions between E1 and the pore domain (PD) of Q1 likely restrict the backbone flexibility of Q1’s selectivity filter, reducing single-channel flickering (28) and increasing the pore conductance to K+ ions (32,33). In the presence of E1, Rb’s larger size does not confer an advantage in ion conduction through the Q1 pore. The GRb/GK value of the Q1/E1 pore drops to ∼1. We propose that ML binding to the cleft space between Q1 subunits likely exerts a similar allosteric effect on the Q1 pore, leading to an increase in K+ conductance and a reduction in the GRb/GK value.
Probing the structural basis for ML’s action: gating modification
In both oocyte and COS-7 expression systems, ML markedly slowed Q1 deactivation and exaggerated the sigmoidal delay in Q1 activation (Fig. 8). These effects are similar to the gating-modifying effects of E1 (1,17). To seek the structural basis for the gating-modifying effects of ML, using E1 as a reference, we used principal component analysis (PCA) to probe conformational changes in the Q1 backbone induced by ML or E1 binding (34). In this approach, a covariance matrix of Q1 Cα atoms is first constructed based on snapshots during MD trajectories. The matrix is diagonalized to separate the Cα movements into components based on eigenvectors (directions of the movements). The components are ranked by the associated eigenvalues (magnitudes of the movements). Studies have shown that the first few principal components with the largest magnitudes of movements are functionally important, whereas the remaining components of small magnitudes may reflect thermal motions with little functional consequences (35). When PCA is applied to combined MD trajectories of ligand-free and ligand-bound states, the first and largest principal component reveals the most significant backbone movements induced by ligand binding. Therefore, we combined the 50–100 ns MD trajectories of Q1 alone with ML-bound or E1-bound Q1. These combined MD trajectories are denoted as Q1+Q1_ML_R1, Q1+Q1_ML_R2, and Q1+Q1/E1. A potential issue with such an analysis is the contribution of intrinsic dynamics of protein conformation to the calculated Cα displacements. Therefore, as a control, we applied PCA to two single MD trajectories: Q1 and Q1/E1. Fig. S7 shows that the values of the total variance of Cα motions calculated from single MD trajectories were much lower than those calculated from combined MD trajectories, supporting the notion that ligand-binding induced conformational changes were much larger than intrinsic thermal motions.
Figure 8.

(A and B) Effects of ML on gating kinetics of Q1 expressed in oocytes (A) or COS-7 cells (B). In all panels, control data are shown in gray and data in ML are shown in black. Top: time constant (τ) of deactivation plotted on a logarithmic scale against repolarizing voltage. Tail currents after the initial hooked phase were fit with a single-exponential function. Inset: tail currents at −80 mV as open circles superimposed on single-exponential fit. Bottom: τ of activation plotted on a logarithmic scale against depolarizing voltage. The activation phase of Q1 was fit with a single-exponential (oocyte) or double-exponential (COS-7) function with sigmoidal delay. Inset: current at +20 mV as open circles superimposed on single- or double-exponential fit. Enlarged views of the gray-shaded areas highlight ML-enhanced sigmoidal delay in Q1 activation (arrows).
The first principal components of Cα displacements calculated for these five systems are plotted against the Q1 position numbers in Fig. 9 A. Q1 and Q1/E1 by themselves manifested only small degrees of Cα displacements mainly in the loop regions flanking transmembrane helices. These small Cα movements likely reflect random fluctuations of the Q1 conformation around the equilibrium state. On the other hand, the Cα displacements calculated for the three combined MD trajectories were much larger, and occurred in not only the loop regions but also the transmembrane helices. The quantitative and qualitative differences between these two sets of data support the notion that the Cα displacements in the latter case reflect changes in the Q1 backbone conformation induced by ML or E1 binding.
Figure 9.

PCA of Q1 backbone movements associated with ML or E1 binding. (A) Top to bottom: first principal component of Q1 Cα displacements calculated from single MD trajectories of Q1 and Q1/E1, and from combined MD trajectories of Q1+Q1_ML_R1, Q1+Q1_ML_R2, and Q1+Q1/E1. The values of Cα displacements in the four Q1 subunits are averaged and plotted as mean with SE bar against the Q1 position number. The transmembrane helices (S1–S6) and P loop are highlighted by gray shading. Horizontal bars along the abscissa denote the three regions highlighted in B. (B) Intracellular side view of Q1 with the first principal component of Cα displacements in the S2-S3 loop, S4-S5 helix, and S6CT marked by green-white-red lines. A green-to-red transition signifies the direction of Cα movement. The length of the line signifies the magnitude of movement. Yellow and orange arrows indicate the general directions of movements in the VSD and PD, respectively. Channel domains are marked in the Q1 panel. The approximate E1 positions are indicated by dotted circles in the Q1+Q1/E1 panel.
Fig. 9 B compares the directions and magnitudes of Cα displacements in Q1 backbone induced by ML and E1 binding. We use green-white-red lines to connect Cα positions in Q1 alone (green) and in ML- or E1-bound Q1 (red). Therefore, the green-to-red color transition and the length of the line indicate the direction and magnitude, respectively, of Cα displacements induced by ML or E1 binding. The views in Fig. 9 B are from the intracellular side, showing that ML and E1 binding induced similar rotations of the Q1 gating apparatus: the S2-S3 loops and S4-S5 linkers in the voltage-sensing domain (VSD), and the carboxyl termini of S6 (S6CT) in the PD. Previous studies have shown that E1 directly interacts with the S4-S5 linker and S6CT of the Q1 channel (9,36), and these interactions may reduce the coupling efficiency between the voltage sensor movement and the S6 bundle-crossing gate (37). We propose that ML binding to the cleft space between Q1 subunits can induce similar effects and slows both activation and deactivation transitions in the Q1 channel.
Comparison with previous studies
Q1 is the first of a five-member KCNQ channel family. Whereas Q1 is mainly expressed in peripheral nonneuronal cell types, KCNQ2–KCNQ5 (Q2–Q5) are expressed exclusively in neurons. A large number of small-molecule activators of the KCNQ channels have been reported (4). Q1 activators can be used to treat LQT syndromes, and activators of the neuronal KCNQ channels are designed to treat epilepsy and pain.
Q1 and Q2 are homologous in the S1–S6 region (60.2% identity). Why is ML active on Q1 but >100-fold less active on Q2 (7)? The amino acid sequence alignment shown in Fig. 10 (top) indicates that all but two of the Q1 residues predicted to be important for ML binding are conserved in Q2. The Q2 residues equivalent to F275 and F335 in Q1 are L245 and L330, respectively. Ala substitution at either position in Q1 greatly reduced ML’s current-enhancing effect (Fig. 5) due to a disruption of π-π interactions between the two aromatic rings and the ML molecule. Loss of these two aromatic rings in Q2 may explain the much lower potency of ML in increasing the Q2 current amplitude.
Figure 10.

Comparison of the ML binding site with those of other KCNQ activators. Top: sequence alignment between (KCN)Q1 and (KCN)Q2 in S2–S6 helices and the P loop. Color shading highlights equivalent Q1 and Q2 residues that are important for the effects of NH29 (blue), TMS (cyan), ztz240 (green), R-L3 (pink), ZnPy (purple), and retigabine (red). Center: side view of a partial Q1 homology model, showing helices involved in drug binding (S2–S5 of one subunit and S5-S6 of an adjacent subunit). Golden mesh, ML binding space; colored spheres, residues highlighted in the sequence alignment. Left and right: structures of KCNQ activators. Atom colors: carbon, gray; nitrogen, blue; oxygen, red; hydrogen, white; sulfur, yellow; Hg, cyan; Zn, olive green; Cl, green; F, light blue.
How does the ML binding space described here compare with the binding sites described for the other KCNQ activators? Fig. 10 shows that the ML binding space is independent of the binding pockets for NH29 (38), ztz240 (39), and thimerosal (TMS) (40). All three molecules bind to the VSD of their target KCNQ channels from the extracellular side of the membrane. Although the ML binding space includes the retigabine binding site on the S6 helix of Q2 (4) (as shown in Fig. 10), it does not include the retigabine binding site on the S5 helix of Q2, W236, which is absolutely required for retigabine’s activator effect (not shown in the perspective of Fig. 10).
The ML binding space overlaps extensively with residues that are important for the activator effects of R-L3 (41) and ZnPy (42,43). These three KCNQ activators also have similar activator effects: 1), they all increase the Q1 current amplitudes independently of their gating-modifying effects; 2), they all slow Q1 deactivation and activation; and 3), their current-enhancing effects on Q1 are reduced by E1 association (41,42). Furthermore, ZnPy’s activator effect on Q3 is enhanced by PIP2 depletion (44), similar to ML’s activator effect on Q1 (Fig. 6). We suggest that ML, R-L3, and ZnPy bind to side pockets between Q1 subunits, increasing the pore conductance and hindering gating transitions by the same or similar mechanisms.
Conclusions
The combination of computational modeling and experimental validation offers important advantages over the candidate drug-binding site approach. In the latter case, scanning mutagenesis is applied to the presumed drug-binding region, and the impact of mutations on drug effects is interpreted as a disruption or enhancement of drug binding to the presumed binding site. Our results suggest that ML can dynamically interact with Q1 residues over a relatively large range, from a hydrophilic/charged environment exposed to the intracellular solution to a hydrophobic pocket between transmembrane helices. Importantly, our models suggest that ML increases the Q1 current amplitude and affects Q1 gating kinetics by allosteric mechanisms.
Acknowledgments
We thank Dr. Yasushi Okamura (Osaka University) for the generous gift of ci-VSP.
This study was supported by the National Institutes of Health (RO1 HL107294 to G.N.T.) and by a Postdoctoral Fellowship from the American Heart Association/Mid-Atlantic Affiliate to Y.X.
Supporting Material
This animation provides a 3D view of the ML binding space described in Fig. 4 B of the main text, in the context of the complete Q1 homology model.
Supporting Citations
References (45,46) appear in the Supporting Material.
References
- 1.Sanguinetti M.C., Curran M.E., Keating M.T. Coassembly of K(V)LQT1 and minK (IsK) proteins to form cardiac I(Ks) potassium channel. Nature. 1996;384:80–83. doi: 10.1038/384080a0. [DOI] [PubMed] [Google Scholar]
- 2.Jost N., Virág L., Varró A. Restricting excessive cardiac action potential and QT prolongation: a vital role for IKs in human ventricular muscle. Circulation. 2005;112:1392–1399. doi: 10.1161/CIRCULATIONAHA.105.550111. [DOI] [PubMed] [Google Scholar]
- 3.Wang Y.-H., Zankov D.P., Tseng G.-N. [Ca2+]i elevation and oxidative stress induce KCNQ1 protein translocation from the cytosol to the cell surface and increase slow delayed rectifier (IKs) in cardiac myocytes. J. Biol. Chem. 2013;288:35358–35371. doi: 10.1074/jbc.M113.504746. [DOI] [PMC free article] [PubMed] [Google Scholar]
- 4.Xiong Q., Gao Z., Li M. Activation of Kv7 (KCNQ) voltage-gated potassium channels by synthetic compounds. Trends Pharmacol. Sci. 2008;29:99–107. doi: 10.1016/j.tips.2007.11.010. [DOI] [PubMed] [Google Scholar]
- 5.Perry M., Sanguinetti M., Mitcheson J. Revealing the structural basis of action of hERG potassium channel activators and blockers. J. Physiol. 2010;588:3157–3167. doi: 10.1113/jphysiol.2010.194670. [DOI] [PMC free article] [PubMed] [Google Scholar]
- 6.Mruk K., Kobertz W.R. Discovery of a novel activator of KCNQ1-KCNE1 K channel complexes. PLoS ONE. 2009;4:e4236. doi: 10.1371/journal.pone.0004236. [DOI] [PMC free article] [PubMed] [Google Scholar]
- 7.Mattmann M.E., Yu H., Hopkins C.R. Identification of (R)-N-(4-(4-methoxyphenyl)thiazol-2-yl)-1-tosylpiperidine-2-carboxamide, ML277, as a novel, potent and selective K(v)7.1 (KCNQ1) potassium channel activator. Bioorg. Med. Chem. Lett. 2012;22:5936–5941. doi: 10.1016/j.bmcl.2012.07.060. [DOI] [PMC free article] [PubMed] [Google Scholar]
- 8.Yu H., Lin Z., Li M. Dynamic subunit stoichiometry confers a progressive continuum of pharmacological sensitivity by KCNQ potassium channels. Proc. Natl. Acad. Sci. USA. 2013;110:8732–8737. doi: 10.1073/pnas.1300684110. [DOI] [PMC free article] [PubMed] [Google Scholar]
- 9.Xu Y., Wang Y., Tseng G.-N. Building KCNQ1/KCNE1 channel models and probing their interactions by molecular-dynamics simulations. Biophys. J. 2013;105:2461–2473. doi: 10.1016/j.bpj.2013.09.058. [DOI] [PMC free article] [PubMed] [Google Scholar]
- 10.Long S.B., Campbell E.B., Mackinnon R. Crystal structure of a mammalian voltage-dependent Shaker family K+ channel. Science. 2005;309:897–903. doi: 10.1126/science.1116269. [DOI] [PubMed] [Google Scholar]
- 11.Kang C., Tian C., Sanders C.R. Structure of KCNE1 and implications for how it modulates the KCNQ1 potassium channel. Biochemistry. 2008;47:7999–8006. doi: 10.1021/bi800875q. [DOI] [PMC free article] [PubMed] [Google Scholar]
- 12.Strutz-Seebohm N., Pusch M., Seebohm G. Structural basis of slow activation gating in the cardiac I Ks channel complex. Cell. Physiol. Biochem. 2011;27:443–452. doi: 10.1159/000329965. [DOI] [PubMed] [Google Scholar]
- 13.Gofman Y., Shats S., Ben-Tal N. How does KCNE1 regulate the Kv7.1 potassium channel? Model-structure, mutations, and dynamics of the Kv7.1-KCNE1 complex. Structure. 2012;20:1343–1352. doi: 10.1016/j.str.2012.05.016. [DOI] [PubMed] [Google Scholar]
- 14.Dundas J., Ouyang Z., Liang J. CASTp: computed atlas of surface topography of proteins with structural and topographical mapping of functionally annotated residues. Nucleic Acids Res. 2006;34:W116–W118. doi: 10.1093/nar/gkl282. [DOI] [PMC free article] [PubMed] [Google Scholar]
- 15.Morris G.M., Huey R., Olson A.J. AutoDock4 and AutoDockTools4: automated docking with selective receptor flexibility. J. Comput. Chem. 2009;30:2785–2791. doi: 10.1002/jcc.21256. [DOI] [PMC free article] [PubMed] [Google Scholar]
- 16.Pronk S., Páll S., Lindahl E. GROMACS 4.5: a high-throughput and highly parallel open source molecular simulation toolkit. Bioinformatics. 2013;29:845–854. doi: 10.1093/bioinformatics/btt055. [DOI] [PMC free article] [PubMed] [Google Scholar]
- 17.Wang Y., Zhang M., Tseng G.-N. Probing the structural basis for differential KCNQ1 modulation by KCNE1 and KCNE2. J. Gen. Physiol. 2012;140:653–669. doi: 10.1085/jgp.201210847. [DOI] [PMC free article] [PubMed] [Google Scholar]
- 18.Jiang M., Xu X., Tseng G.-N. Dynamic partnership between KCNQ1 and KCNE1 and influence on cardiac IKs current amplitude by KCNE2. J. Biol. Chem. 2009;284:16452–16462. doi: 10.1074/jbc.M808262200. [DOI] [PMC free article] [PubMed] [Google Scholar]
- 19.Wang Y., Eltit J.M., Huizar J.F. Cellular mechanism of premature ventricular contraction-induced cardiomyopathy. Heart Rhythm. 2014 doi: 10.1016/j.hrthm.2014.07.022. in press. [DOI] [PMC free article] [PubMed] [Google Scholar]
- 20.Chen Y.-H., Xu S.-J., Huang W. KCNQ1 gain-of-function mutation in familial atrial fibrillation. Science. 2003;299:251–254. doi: 10.1126/science.1077771. [DOI] [PubMed] [Google Scholar]
- 21.Hong K., Piper D.R., Brugada R. De novo KCNQ1 mutation responsible for atrial fibrillation and short QT syndrome in utero. Cardiovasc. Res. 2005;68:433–440. doi: 10.1016/j.cardiores.2005.06.023. [DOI] [PubMed] [Google Scholar]
- 22.Weiss J.N. The Hill equation revisited: uses and misuses. FASEB J. 1997;11:835–841. [PubMed] [Google Scholar]
- 23.Zaydman M.A., Silva J.R., Cui J. Kv7.1 ion channels require a lipid to couple voltage sensing to pore opening. Proc. Natl. Acad. Sci. USA. 2013;110:13180–13185. doi: 10.1073/pnas.1305167110. [DOI] [PMC free article] [PubMed] [Google Scholar]
- 24.Rodriguez-Menchaca A.A., Adney S.K., Logothetis D.E. PIP2 controls voltage-sensor movement and pore opening of Kv channels through the S4-S5 linker. Proc. Natl. Acad. Sci. USA. 2012;109:E2399–E2408. doi: 10.1073/pnas.1207901109. [DOI] [PMC free article] [PubMed] [Google Scholar]
- 25.Murata Y., Okamura Y. Depolarization activates the phosphoinositide phosphatase Ci-VSP, as detected in Xenopus oocytes coexpressing sensors of PIP2. J. Physiol. 2007;583:875–889. doi: 10.1113/jphysiol.2007.134775. [DOI] [PMC free article] [PubMed] [Google Scholar]
- 26.Eckey K., Wrobel E., Seebohm G. Novel Kv7.1-phosphatidylinositol 4,5-bisphosphate interaction sites uncovered by charge neutralization scanning. J. Biol. Chem. 2014;289:22749–22758. doi: 10.1074/jbc.M114.589796. [DOI] [PMC free article] [PubMed] [Google Scholar]
- 27.Thompson J., Begenisich T. Selectivity filter gating in large-conductance Ca(2+)-activated K+ channels. J. Gen. Physiol. 2012;139:235–244. doi: 10.1085/jgp.201110748. [DOI] [PMC free article] [PubMed] [Google Scholar]
- 28.Pusch M., Bertorello L., Conti F. Gating and flickery block differentially affected by rubidium in homomeric KCNQ1 and heteromeric KCNQ1/KCNE1 potassium channels. Biophys. J. 2000;78:211–226. doi: 10.1016/S0006-3495(00)76586-6. [DOI] [PMC free article] [PubMed] [Google Scholar]
- 29.Smart O.S., Neduvelil J.G., Sansom M.S.P. HOLE: a program for the analysis of the pore dimensions of ion channel structural models. J. Mol. Graph. 1996;14:354–360. doi: 10.1016/s0263-7855(97)00009-x. 376. [DOI] [PubMed] [Google Scholar]
- 30.Shrivastava I.H., Sansom M.S.P. Simulations of ion permeation through a potassium channel: molecular dynamics of KcsA in a phospholipid bilayer. Biophys. J. 2000;78:557–570. doi: 10.1016/S0006-3495(00)76616-1. [DOI] [PMC free article] [PubMed] [Google Scholar]
- 31.Zhou Y., MacKinnon R. The occupancy of ions in the K+ selectivity filter: charge balance and coupling of ion binding to a protein conformational change underlie high conduction rates. J. Mol. Biol. 2003;333:965–975. doi: 10.1016/j.jmb.2003.09.022. [DOI] [PubMed] [Google Scholar]
- 32.Yang Y., Sigworth F.J. Single-channel properties of IKs potassium channels. J. Gen. Physiol. 1998;112:665–678. doi: 10.1085/jgp.112.6.665. [DOI] [PMC free article] [PubMed] [Google Scholar]
- 33.Sesti F., Goldstein S.A.N. Single-channel characteristics of wild-type IKs channels and channels formed with two minK mutants that cause long QT syndrome. J. Gen. Physiol. 1998;112:651–663. doi: 10.1085/jgp.112.6.651. [DOI] [PMC free article] [PubMed] [Google Scholar]
- 34.Amadei A., Linssen A.B.M., Berendsen H.J.C. Essential dynamics of proteins. Proteins. 1993;17:412–425. doi: 10.1002/prot.340170408. [DOI] [PubMed] [Google Scholar]
- 35.Hess B. Similarities between principal components of protein dynamics and random diffusion. Phys. Rev. E Stat. Phys. Plasmas Fluids Relat. Interdiscip. Topics. 2000;62(6 Pt B):8438–8448. doi: 10.1103/physreve.62.8438. [DOI] [PubMed] [Google Scholar]
- 36.Lvov A., Gage S.D., Kobertz W.R. Identification of a protein-protein interaction between KCNE1 and the activation gate machinery of KCNQ1. J. Gen. Physiol. 2010;135:607–618. doi: 10.1085/jgp.200910386. [DOI] [PMC free article] [PubMed] [Google Scholar]
- 37.Osteen J.D., Gonzalez C., Kass R.S. KCNE1 alters the voltage sensor movements necessary to open the KCNQ1 channel gate. Proc. Natl. Acad. Sci. USA. 2010;107:22710–22715. doi: 10.1073/pnas.1016300108. [DOI] [PMC free article] [PubMed] [Google Scholar]
- 38.Peretz A., Pell L., Attali B. Targeting the voltage sensor of Kv7.2 voltage-gated K+ channels with a new gating-modifier. Proc. Natl. Acad. Sci. USA. 2010;107:15637–15642. doi: 10.1073/pnas.0911294107. [DOI] [PMC free article] [PubMed] [Google Scholar]
- 39.Li P., Chen Z., Li M. The gating charge pathway of an epilepsy-associated potassium channel accommodates chemical ligands. Cell Res. 2013;23:1106–1118. doi: 10.1038/cr.2013.82. [DOI] [PMC free article] [PubMed] [Google Scholar]
- 40.Kerst G., Brousos H., Bleich M. The oxidant thimerosal modulates gating behavior of KCNQ1 by interaction with the channel outer shell. J. Membr. Biol. 2002;186:89–100. doi: 10.1007/s00232-001-0138-6. [DOI] [PubMed] [Google Scholar]
- 41.Seebohm G., Pusch M., Sanguinetti M.C. Pharmacological activation of normal and arrhythmia-associated mutant KCNQ1 potassium channels. Circ. Res. 2003;93:941–947. doi: 10.1161/01.RES.0000102866.67863.2B. [DOI] [PubMed] [Google Scholar]
- 42.Gao Z., Xiong Q., Li M. Desensitization of chemical activation by auxiliary subunits: convergence of molecular determinants critical for augmenting KCNQ1 potassium channels. J. Biol. Chem. 2008;283:22649–22658. doi: 10.1074/jbc.M802426200. [DOI] [PMC free article] [PubMed] [Google Scholar]
- 43.Xiong Q., Sun H., Li M. Zinc pyrithione-mediated activation of voltage-gated KCNQ potassium channels rescues epileptogenic mutants. Nat. Chem. Biol. 2007;3:287–296. doi: 10.1038/nchembio874. [DOI] [PubMed] [Google Scholar]
- 44.Zhou P., Yu H., Li M. Phosphatidylinositol 4,5-bisphosphate alters pharmacological selectivity for epilepsy-causing KCNQ potassium channels. Proc. Natl. Acad. Sci. USA. 2013;110:8726–8731. doi: 10.1073/pnas.1302167110. [DOI] [PMC free article] [PubMed] [Google Scholar]
- 45.Schüttelkopf A.W., van Aalten D.M.F. PRODRG: a tool for high-throughput crystallography of protein-ligand complexes. Acta Crystallogr. D Biol. Crystallogr. 2004;60:1355–1363. doi: 10.1107/S0907444904011679. [DOI] [PubMed] [Google Scholar]
- 46.Mezei M. Simulaid: a simulation facilitator and analysis program. J. Comput. Chem. 2010;31:2658–2668. doi: 10.1002/jcc.21551. [DOI] [PubMed] [Google Scholar]
Associated Data
This section collects any data citations, data availability statements, or supplementary materials included in this article.
Supplementary Materials
This animation provides a 3D view of the ML binding space described in Fig. 4 B of the main text, in the context of the complete Q1 homology model.