Abstract
Skull-induced distortion and attenuation present a challenge to both transcranial imaging and therapy. Whereas therapeutic procedures have been successful in offsetting aberration using from prior CTs, this approach impractical for imaging. In effort to provide a simplified means for aberration correction, we have been investigating the use of diffuse infrared light as an indicator of acoustic properties. Infrared wavelengths were specifically selected for tissue penetration; however this preliminary study was performed through bone alone via a transmission mode to facilitate comparison with acoustic measurements. The inner surface of a half human skull, cut along the sagittal midline, was illuminated using an infrared heat lamp and images of the outer surface were acquired with an IR-sensitive camera. A range of source angles were acquired and averaged to eliminate source bias. Acoustic measurement were likewise obtained over the surface with a source (1MHz, 12.7mm-diam) oriented parallel to the skull surface and hydrophone receiver (1mm PVDF). Preliminary results reveal a positive correlation between sound speed and optical intensity, whereas poor correlation is observed between acoustic amplitude and optical intensity.
1. Introduction
Though it has long been established that ultrasound can be directed through thicker parts of the human skull1,2, reliable focusing in the brain generally necessitates aberration correction3, such as noninvasive techniques that utilize prior magnetic resonant imaging (MR)4 or x-ray computed tomography (CT) 5 data. In an attempt to identify a simpler and more direct means for transcranial windowing, we conducted a study comparing acoustic transmission parameters to those of diffuse light directed though the skull. At onset, the study was motivated by the observation that most skulls possess certain locations which are relatively transparent to ultrasound waves. This includes not only the well-known temporal bone window6, but also locations that can appear on the thicker frontal, occipital, and parietal bones. Unfortunately, the precise locations of such windows tends to be highly variable between different skulls 7. Casual examination of ex vivo skull specimens, however, led us to hypothesize that transmitted light intensity at a given location correlates positively with ultrasound transmission8, motivating us to explore trends between transmitted optical data and ultrasound data.
This preliminary study was performed using light transmitted through the skull under the auspice that, should correlation be found between acoustic and optic data, it might motivate further work aimed at detecting similar correlations in a reflection mode and through the scalp. Current measurements were acquired along the surfaces of ex vivo human skulls situated between a transducer and a hydrophone, with the skull surfaces positioned normal to the transducer. Optical measurements were subsequently obtained in a dark room by transmitting infrared (IR) light through the skull sections using an IR-sensitive camera to measure intensity variance on the skull surface.
When acoustic amplitudes and time of arrival were compared to the mean optical intensity, poor correlation was found. However, good correlation was observed between the ultrasound time of arrival and optical intensity. This unexpected positive correlation motivated additional investigation into the potential for optical data to serve as a tool for acoustic phase-aberration correction. A virtual array9 was constructed by combining separately-acquired measurements on a skull, with a fixed internal hydrophone location defining a desired focal position. Using a linear fit between optical intensity and time-of-flight data, waveforms were compared before and after time-of-flight correction based on this fit. Significant improvement in waveform amplitude was observed, as well as overall improvement in waveform shape, as determined by correlation. The procedure and results of this preliminary work are described below, along with discussion on plausible physical explanation of our findings and a description of our ongoing and planned future work.
2. Metholology
A. Ultrasound measurement
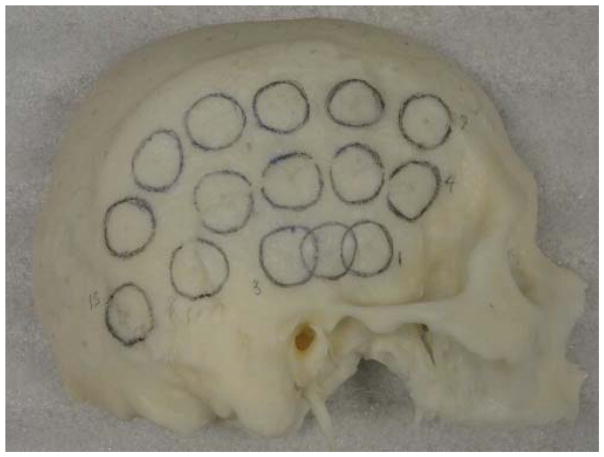
Eight formalin-fixed skull samples representing two sagittally-sectioned half skulls and six calvaria were used for measurements. Acoustic signals were transmitted underwater between a transducer (Olympus NDT, 1MHz, 1.27-cm OD) and a hydrophone (Onda, 1-mm-diameter PVDF) with- and without a skull placed in front of the source transducer. Measurement positions on each skull were physically marked with circles corresponding to the approximate transducer diameter (Fig 1). Calipers were then used to determine skull thickness at the center of each circle. The ultrasound setup illustrated in Fig. 2 shows the relative transducer and hydrophone alignment with a separation of approximately 10 cm.
Figure 1.
Marked sagittally-sectioned half skull.
Figure 2.

Schematic for ultrasound measurement
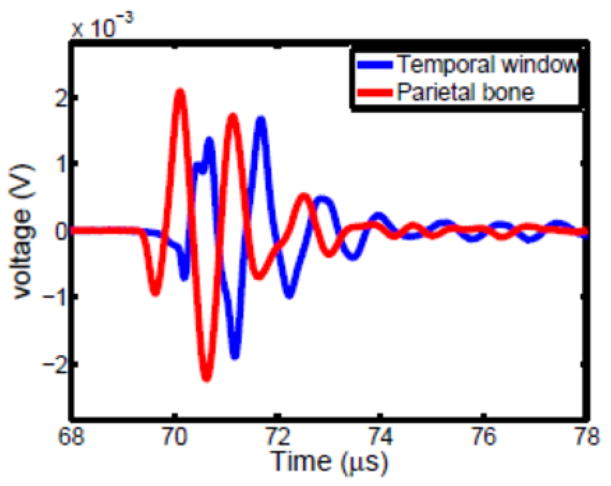
For each measurement location, the skull was positioned so that the transducer was centered about a reference circle and angled approximately normal to the transducer face. An impulsive voltage was supplied to the transducer (Panametrics 500PR), and the resulting hydrophone response read by an oscilloscope (Tektronix, DPO3034) triggered from the voltage source. The measurement procedure was repeated three times for each position. Two sample waveforms are shown in Fig. 3; one from the temporal bone window, the other from parietal bone.
Figure 3.
Sample waveforms through temporal bone (blue) and parietal bone (red).
B. IR measurement
The optic measurement setup is shown in Fig 4. All measurements were performed in a dark room. Using a heat lamp as an IR source, a skull was situated between the lamp and an IR-sensitive camera (Logitec C920, with IR-filter removed). An ideal light source for these measurements would produce a uniform intensity across the inner surface of the skull, allowing the camera to image relative diffuse transmission on the outer skull surface. However, it was found that approximating such a field would require the lamp to be situated impractically-far from the skull. Alternatively, the lamp was rotated to allow averaging of spatial variations, and thereby remove source bias due to source directivity. These rotations were performed over a one minute period while video frames were recorded and time-averaged (Fig 5). Spatial-means of optic intensity values were then determined over rectangular areas inscribed by each circle corresponding to an acoustic measurement location.
Figure 4.
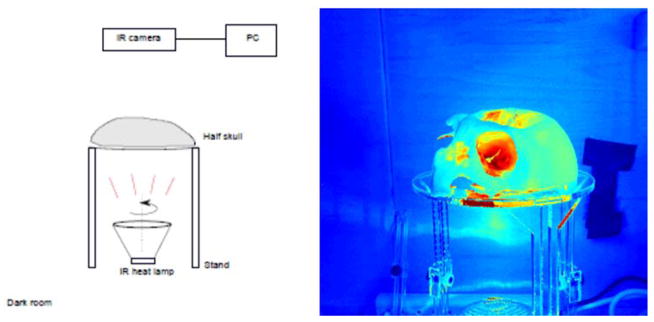
Schematic for IR measurement (left) and in image showing illumination through the skull.
Figure 5.
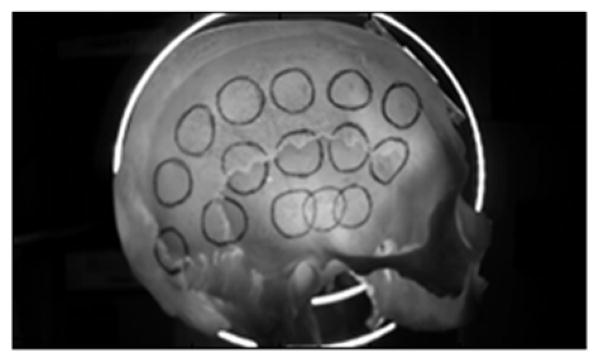
Time-averaged IR image from one minute video.
3. Results
The number of measurement positions attainable by both the ultrasound and optic setups varied, depending on skull size and shape, ranging from 13 to 30 positions (mean 21 points) over the 8 skulls examined and totaling 174 points over all skulls. Data were analyzed to compare relative transmitted optic intensity, transmitted acoustic pressure amplitude, time-of-flight, and skull thickness. Results from one skull subject are shown in Fig. 6. Both the correlation coefficient and p-value were calculated for the data, and are displayed in each figure, where it is apparent all three parameters correlate to some degree with the infrared intensity.
Figure 6.

Experimental results for one skull subject: Comparison between IR intensity, thickness, peak pressure Pmax and time-of-flight TOF.
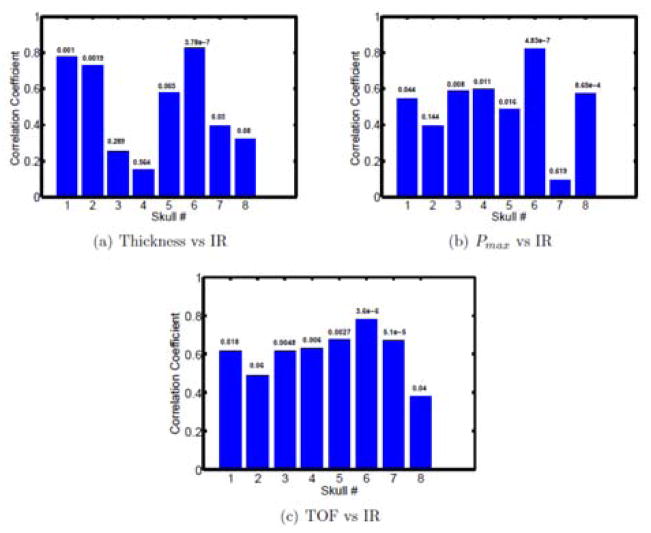
The correlation coefficients for 8 skull subjects were shown in Fig. 7, with p-values listed above each bar. Among the small size samples, it can be seen that some skull can have strong correlation between thickness and infrared intensity or between peak pressure Pmax and infrared intensity but some will have very weak correlation. The better and more uniform correlation was found between time-of-flight and infrared intensity.
Figure 7.
The experimental results for 8 skulls: the correlation between IR intensity, thickness, peak pressure Pmax and time-of-flight TOF; The corresponding p-values were listed above the blue bars.
A demonstration of the potential to use optical information for phase aberration correction was performed based on a skull-specific linear fit between optical intensity and time of flight measurements shown in Fig. 8. It can be seen that the TOF and IR curves match very well over the skull locations (Fig. 8(a)). The fit equation obtained from the experimental data was show in Fig. 8(b):
| (1) |
with the TOA, t, in mico-seconds and optical intensity I in arbitrary units. A composite fit was also obtained by a linear fit of IR vs. TOA data for all points measured over the eight skulls, resulting in
Figure 8.
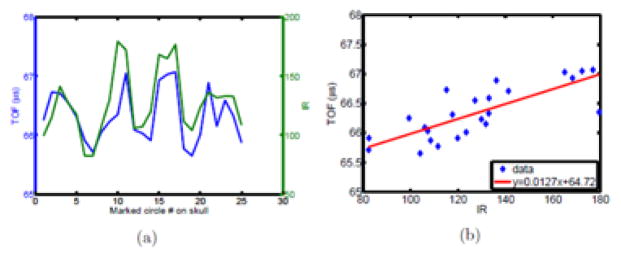
Comparison between US and IR over one skull subject.
| (2) |
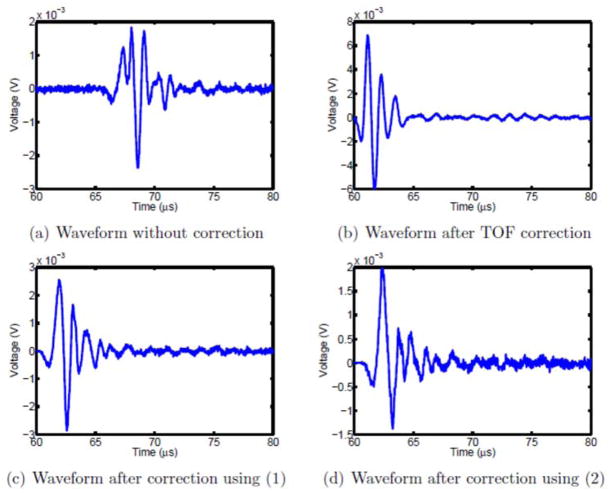
Assuming now each source location represents a single element in a larger array, the array’s pressure field is given by the sum of the fields of the individual elements (Fig 9). Defining a desired focal point as the location of the hydrophone, equidistant from each element each temporal waveform peak would ideally arrive in phase10. Time-of-flight differences caused by the skull thus introduce sub-optimal focusing. The summed signal measured at the hydrophone situated 10 cm from the array elements is shown in Fig. 10(a).
Figure 9.
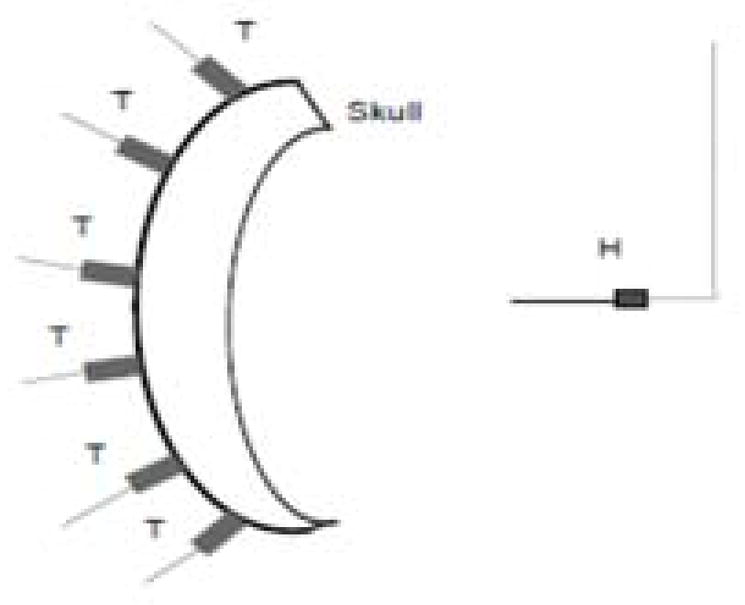
Schematic for virtual beam forming.
Figure 10.
Virtual beam forming.
Restoration of optimal temporal focusing was then performed by time-adjusting each element so that individual peak pressures superimposed constructively. The resulting waveform is shown in Fig. 10(b). Next, an adjustment was made using (1) to synthetically adjust the TOA of each signal. The result is shown in Fig. 10(c). The averaged fit equation (2) was also used to correct the beam and the result was shown in Fig. 10(d). To examine the signal improvement, the cross-correlation p-value was calculated between signals, revealing p= 0.94 between Fig. 10(b) and Fig. 10(a) while p = 1.12 × 10⁻²⁴ between Fig. 10(b) and Fig. 10(c). Although the amplitude for the first peak just increased by 1.5, the wave shape gets greatly improved. The p-value increased to 8.23 × 10⁻⁸ between Fig. 10(b) and Fig. 10(d). It’s not as good as the result in Fig. 10(c), but the signal still gets improved.
4. Discussion and conclusions
A preliminary study with eight ex vivo human skulls was performed to examine correlation between the optic intensity of diffuse light transmitted through the skull ultrasound transmission. Our initial hypothesis that optical intensity would correlate strongly with acoustic transmission was not supported. However, it was found that the IR intensity correlates strongly with relative time-of-arrival changes caused by variable increased speed of sound and thickness over the skull. Notably, this relationship was found to hold even in cases where the correlation of intensity and thickness was poor.
Though the full nature of the optical scattering has yet to be fully investigated, a plausible explanation for correlation between light intensity and TOA entails the skull’s layered composition of relatively opaque (acoustically) trabecular layer sandwiched between more transmissive cortical bone (Fig 11). Moreover thicker bone tends to correspond to thicker cortical layers, thus introducing a negative correlation between IR measurements and thickness as well as TOA vs thickness.
Figure 11.
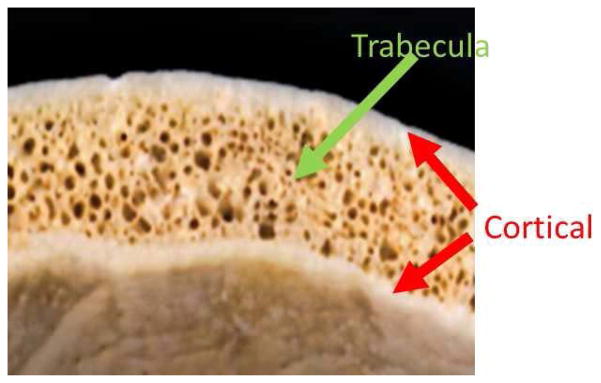
Skull bone: inner and outer layer is the cortical bone; in between is the trabecular bone.
Demonstration of the possibility for phase-based correction using IR is very preliminary, and will require further data, as well as further investigation into the trends between parameters. Nonetheless these preliminary results are encouraging, and have motivated our ongoing investigation using more narrow-band optical sources and detectors designed to both diffusely illuminate and detect optical signals from the outer skull.
Acknowledgments
Research reported in this publication was supported in part by the National Institute of Biomedical Imaging and Bioengineering of the National Institutes of Health under award number R01EB014296. The content is solely the responsibility of the authors.
References
- 1.Dussik KT, Dussik F, Wyt L. Auf dem wege zur hyperphonographie des gehirnes. Wien Med Wochenschr. 1947;97:425–429. [PubMed] [Google Scholar]
- 2.Ballantine HT, Bolt RH, Hueter TF, Ludwig GD. On the Detection of Intracranial Pathology by Ultrasound. Science. 1950;112:525–528. doi: 10.1126/science.112.2914.525. [DOI] [PubMed] [Google Scholar]
- 3.Smith SW, Trahey GE, von Ramm OT. Phased array ultrasound imaging through planar tissue layers. Ultrasound Med Biol. 1986;12:229–243. doi: 10.1016/0301-5629(86)90314-5. [DOI] [PubMed] [Google Scholar]
- 4.Kaye EA, Chen J, Pauly KB. Rapid MR-ARFI method for focal spot localization during focused ultrasound therapy. Magn Reson Med. 2011;65:738–743. doi: 10.1002/mrm.22662. [DOI] [PMC free article] [PubMed] [Google Scholar]
- 5.Clement GT, Hynynen K. A non-invasive method for focusing ultrasound through the human skull. Phys Med Biol. 2002;47:1219–36. doi: 10.1088/0031-9155/47/8/301. [DOI] [PubMed] [Google Scholar]
- 6.Postert T, Federlein J, Przuntek H, Büttner T. Insufficient and absent acoustic temporal bone window: Potential and limitations of transcranial contrast-enhanced color-coded sonography and contrast-enhanced power-based sonography. Ultrasound in Medicine & Biology. 1997;23:857–862. doi: 10.1016/s0301-5629(97)00047-1. [DOI] [PubMed] [Google Scholar]
- 7.White J, Clement GT, Hynynen K. Transcranial ultrasound focus reconstruction with phase and amplitude correction. IEEE Trans Ultrason Ferroelectr Freq Control. 2005;52:1518–1522. doi: 10.1109/tuffc.2005.1516024. [DOI] [PubMed] [Google Scholar]
- 8.Meral FC, Naing ZZC, Meyer FA, Jafferji MA, Power C, Clement GT, White PJ. Transcranial ultrasound-optical transmission correlation. The Journal of the Acoustical Society of America. 2014;135:2209–2209. [Google Scholar]
- 9.Clement GT, White J, Hynynen K. Investigation of a large-area phased array for focused ultrasound surgery through the skull. Phys Med Biol. 2000;45:1071–83. doi: 10.1088/0031-9155/45/4/319. [DOI] [PubMed] [Google Scholar]
- 10.Aubry JF, Tanter M, Gerber J, Thomas JL, Fink M. Optimal focusing by spatio-temporal inverse filter. II. Experiments. Application to focusing through absorbing and reverberating media. J Acoust Soc Am. 2001;110:48. doi: 10.1121/1.1377052. [DOI] [PubMed] [Google Scholar]


