Abstract
Introduction:
Polyelectrolyte complexes (PECs) are the association complexes formed between oppositely charged particles (e.g., polymer-polymer, polymer-drug and polymer-drug-polymer). These are formed due to electrostatic interaction between oppositely charged polyions. Diclofenac is a nonsteroidal anti-inflammatory drug (NSAID) advocated in use of painful and inflammatory rheumatic and certain non-rheumatic conditions. The drug has a relatively short elimination half-life, which limits the potential for drug accumulation. As an analgesic, it has a fast onset and long duration of action.
Aim:
invitro-invivo evaluation of Xanthan gum and Eudragit E100 inter polyelectrolyte complex based sustained release tablet.
Materials and Method:
Xanthan gum and Eudragit E100 were used as PEC and were prepared using different proportions i.e. in 1:1 to 1:6 ratio. The optimum ratio of E100 and XG was 1:6 used to characterize the IPC and the formulation of tablet. The tablets were prepared by wet granulation using PVP K30 as binder.
Results and Discussion:
FT-IR and DSC studies confirmed the formation of IPC. Scanning Electron Microscopy (SEM) studies showed highly porous tablet surface. The tablets were evaluated for hardness, weight variation, and drug content, found to be within limits. In vitro and in vivo studies concluded that tablets showed sustained release profile. The short term stability study of the optimized formulation indicated that the formulation was stable.
Conclusion:
Since the Poly Electrolyte Complex delay the release of the drug, it can be employed in formulating sustained release matrix tablets.
Keywords: Diclofenac sodium, eudragit, inter polyelectrolyte complex, sustained release, xanthan gum
INTRODUCTION
Polyelectrolyte complexes (PECs) are the association complexes formed between oppositely charged particles (e.g., polymer-polymer, polymer-drug and polymer-drug-polymer). These are formed due to electrostatic interaction between oppositely charged polyions. This avoids the use of chemical cross linking agents, thereby reducing the possible toxicity and other undesirable effects of the reagents.
Polyelectrolyte complexes have gained much attention in the past few years because of their potential applications. These can be used as membranes,[1,2,3] for coating on films and fibers,[4] for isolation and fractionation of proteins,[5,6] for isolation of nucleic acid,[7,8,9] for binding pharmaceutical products,[10] as supports for catalyst[11] and for preparation of microcapsules for drug delivery.[12,13] Many of the applications are based on the functional properties of the polyelectrolyte (PE).
Xanthan gum is a high molecular weight extracellular polysaccharide, produced in commercial scale from the fermentation of Gram-negative bacterium Xanthomonas campestris. Xanthan gum is non-ionic in nature and is soluble in cold water, and solutions exhibit highly pseudoplastic flow. Its viscosity has excellent stability over a wide pH and temperature range, and the polysaccharide is resistant to enzymatic degradation. Xanthan gum exhibits a synergistic interaction with the galactomannans guar gum and locust bean gum (LBG) and the glucomannan konjac mannan. This results in enhanced viscosity with guar gum and at low concentrations with LBG. At higher concentrations soft, elastic, thermally reversible gels are formed with LBG and konjac mannan.[14] It is a hydrophilic polymer, which until recently had a limited use as thickening, suspending and emulsifying agent in water based systems. It is now being used in gum based sustained release tablet matrices. Xanthan gum not only retards drug release, but can also provide time independent release kinetics with added advantage of compatibility and inertness. Release of soluble drugs from this biopolymer occurs mainly through diffusion, whereas sparingly soluble or insoluble drugs are released as a result of matrix erosion. It is also recommended for use in both acidic and alkaline media.[15] Xanthan gum has been evaluated as a controlled release formulation for model drugs, including theophylline,[16] cefalexime[17] and indomethacin.[18]
Eudragit E 100 is a cationic PE based on dimethylaminoethylmethacrylate and other neutral methacrylic acid esters. It is soluble in gastric fluid as well as in weakly acidic buffer solutions (up to approximately pH 5). This polymer, in its unprotonated form (EU) is soluble in organic solvents and insoluble in petroleum ether and water. It is currently used as coating in solid pharmaceutical dosage forms (for taste masking and protection).[19]
Diclofenac is a nonsteroidal antiinflammatory drug (NSAID) advocated use in painful and inflammatory rheumatic and certain nonrheumatic conditions. It is available in a number of administration forms that can be given orally, rectally or intramuscularly. The drug has a relatively short elimination half-life, which limits the potential for drug accumulation. In numerous clinical trials, the efficacy of diclofenac is equivalent to that of the many newer and established NSAIDs with which it has been compared. As an analgesic, it has a fast onset and long duration of action. Extensive clinical experience has been gained with diclofenac, clearly establishing its safety profile. It is well tolerated compared with other NSAIDs and rarely produces gastrointestinal ulceration or other serious side effects. Thus, diclofenac can be considered as one of the few NSAIDs of “first choice” in the treatment of acute and chronic painful and inflammatory conditions. In the present work an attempt was made to Prepare and evaluate xanthan gum and eudragit inter polyelectrolyte complex based sustained release tablets.[20]
MATERIALS AND METHODS
Materials
Diclofenac sodium obtained from Darwin Formulations Pvt. Limited, Vijayawada as gift sample, Xanthan gum purchased from Sigma Aldrich, Eudragit E100 purchased from Evonik Degussa, Mumbai, Polyvinyl pyrrolidone K-30 purchased from Loba chime, Mumbai, Magnesium stearate purchased from Reachem labs, New Delhi. All other chemicals used were of analytical grade.
Methods
Determination of the optimum ratio between Xg-E100 (Turbidity Measurements)
The XG/E100 ratio in the complex was examined by monitoring the transmittance of the solution at a wavelength of 600 nm using an ultraviolet (UV) spectrophotometer. An aqueous XG solution (0.5, 1, 1.5, 2, 2.5, 3, 3.5, 4, 4.5 and 5 mM) and E100 0.1N HCL solution (0.5, 1, 1.5, 2, 2.5, 3, 3.5, 4, 4.5 and 5 mM) were used. The concentration was calculated by dividing the weight of XG and E100 by the formula weight of each monomer unit. Each XG solution (3 ml) was mixed with the 0.5 mM E100 solutions (3 ml), and each E100 solution (3 ml) was mixed with a 0.5 mM XG solution (3 ml). Each mixture was shaken vigorously. The mixtures were then left to stand for 10 min before measuring the transmittance as a function of the various mixing ratios (E100/XG).
Preparation of inter polyelectrolyte complex
Solutions of E100 in 0.1 N HCL was mixed with solutions of XG in water at constant temperature. After isolation of the precipitate from the solution, it was washed with demineralized water and the solid inter polyelectrolyte complex (IPC) was subsequently dried under vacuum for at least 2 days at 40°C.
Preparation of matrix tablets
The tablets were prepared by wet granulation using PVP K30 as a binder, and the weight was fixed to 200 mg as composition shown in Table 1. Magnesium stearate and Talc were used as glidant and lubricant. Tablets were compressed (Rimek mini press I) using 9 mm biconvex shape punches.
Table 1.
Formulation chart of diclofenac sodium sustained release tablets

Fourier transform-infrared radiation measurements
Fourier transform-infrared radiation (FT-IR) analysis of pure DS and physical mixture of DS and IPC were recorded on Shimadzu Corporation, 8033, USA. Potassium bromide pellet method was employed each spectrum was derived from single average scans collected in the region 650-4000 cm−1. Spectra were analyzed by software supplied by Shimadzu.
Differential scanning calorimetry
Thermal properties of XG, E-100 and IPC were analyzed by Shimadzu differential scanning calorimetry (DSC)-60, Shimadzu Limited Japan. The samples were heated in hermetically sealed aluminum pans. Heat runs for each sample were set from 30°C to 350°C at a heating rate of 10°C/min, using nitrogen as blanket gas.
Scanning electron microscopy (SEM)
To study the surface characteristics of the tablet, scanning electron micrograph (SEM) of the tablets before and after 6 h of hydration powder was carried out. The samples were sputtered with gold at thickness of 10-nm. The SEM was taken in S-2400 equipment (Hitachi, Tokyo, Japan).
EVALUATION OF TABLETS
Drug content
Drug content of DS in tablets were analyzed by measuring the absorbance of standard and samples at λ = 275 nm using UV/Visible spectrophotometer (Jasco model V-530, Tokyo, Japan) and comparing the content from a standard calibration curve.
Hardness, friability and thickness
The hardness and friability of tablets were determined using the Monsanto hardness tester (Cadmach, Ahmadabad, India) and the Roche friabilator (Campbell Electronics, Mumbai, India), respectively. Thicknesses of tablets were measured by vernier caliper.
In vitro drug release studies
In vitro dissolution studies for the prepared matrix tablet and triple-layered matrix tablets were conducted for a period of 12 h using a six station USP XXII type II apparatus (Lab India Disso 2000 system, India.) at 37°C ± 0.5°C and 50 rpm speed. The dissolution studies were carried out in triplicate for first 2 h in pH 1.2 medium (900 ml) and then in phosphate buffer of pH 6.8 (900 ml). The 5 ml of samples were withdrawn on different time intervals and after each withdrawal; an equal quantity of fresh buffer of pH 6.8 was added to the dissolution medium. The samples were diluted suitably with the same buffer and analyzed spectrophotometrically at 276 nm using an UV spectrophotometer (Shimadzu, 160A, Japan). To analyze the drug release mechanism, in vitro release data were fitted into a various drug release models like Higuchi and Korsmeyer-peppas model.
Water uptake and erosion studies
For conducting water uptake studies, the dissolution jars were marked with the time points of 0.5, 1, 2, up to 12 h. One tablet was placed in each dissolution jar containing 1000 ml of phosphate buffer pH 6.8 at 37°C ± 0.5°C, and the apparatus was run at 100 rpm using paddle. The tablets were taken out after completion of the respected stipulated time span as mentioned above and weighed after the excess of water at the surface had been removed with filter paper. The wetted samples were then dried in an oven at 40°C up to constant weight. The increase of the weight on the tablet reflects the weight of the liquid uptake. It was estimated according to Equation 1:
Q = 100 (Ww − Wi)/WW (1)
Where Q is the percentage of the liquid uptake, and Ww and Wi are the masses of the hydrated samples before drying and the initial starting dry weight, respectively.[21]
The degree of erosion (expressed as percentage erosion of the polymer content, E) was determined using Equation 2:
E = 100 (Wi − Wf) Wi (2)
Where, Wf is the final mass of the same dried and partially eroded sample. The entire process was repeated to get 3 values for each time point, and the average was calculated.
In vivo evaluation
Optimized formulation F4 and pure DS were taken up for in vivo study.[22,23]
Subjects
Three male and three female healthy adult albino rabbits of 1-1.5 years old weighing 2.5-3.0 kg were taken up for the study. Based on the laboratory investigation and medical history it was found that albino rabbits selected were suitable for study. All the observed signs and symptoms occurring during the study period were recorded.
Ethical review
Study was conducted in accordance of provisions of the declaration of Helsinki, as amended in Venice in 1983. Written approval was obtained from Institutional Animal Ethical Committee of JSS College of Pharmacy, Mysore, India (Code: 070/2011). Detailed verbal and written experimental procedure on the study was provided to the committee, and written consent was obtained.
Study design
Prior to oral administration, the rabbits were starved for 12 h and were allowed free access to water only. The study design was open, randomized complete cross over in which a single dose of each product (optimized tablet) was administered to fasting, healthy adult male and female albino rabbits on two different occasions, separated by a wash out period of 2 weeks between dosing. The tablets were put behind the tongue to avoid their destruction due to biting. Food was withdrawn from the rabbits 12 h before drug administration and until 24 h. Blood samples (1 ml) were withdrawn from the marginal ear vein of the rabbit at regular intervals of 0.5, 1, 2, 4, 6, 8, 12, 24 h, for a period of 24 h. Blood collected was centrifuged at 2000 rpm for 10 min and drug concentration after deproteinization with acetonitrile was determined by high-performance liquid chromatography (HPLC) assay.
Extraction of drug from plasma
The drug was extracted by the addition of 100 ml of mefenamic acid (internal standard) solution (0.5 mg) along with 0.25 ml of water, 0.25 ml of 1.0 M dipotassium hydrogen phosphate and 3.0 ml of acetonitrile (1:2). The samples were shaken using a reciprocating test tube shaker for 15 min and the organic phase from the test tube was transferred into another test tube containing 0.5 ml of 0.01 M hydrochloric acid. These tubes were shaken to extract the drug and the internal standard into the aqueous phase.
Estimation of plasma drug concentration by high-performance liquid chromatography
The quantitative determination of diltiazem hydrochloride in plasma was performed by HPLC. After extraction, 10 ml of the aqueous phase was injected into the C-18 column through which mobile phase components were pumped at flow rate of 1 ml/min. Column temperature was 30°C and run time of 15 min. The retention time of DS was found to be 7.7 min. The peak area ratio of DS to that of internal standard (mefenamic acid) was determined, and this was used to estimate the plasma concentration of DS using the regression equation. The regression equation was set up by spiking the drug-free plasma with varying amounts of DS and fixed quantity of internal standard (0.5 mg), and treating the plasma as described above. A good linear relationship was observed between the peak area ratio and plasma concentration of diltiazem hydrochloride in the range of 2000-140000 μg/ml.[24]
Short-term stability studies
To assess the drug and formulation stability, stability studies were done according to ICH and WHO guidelines. The optimized formulation (F4) was subjected to stability studies according to ICH guidelines by storing at 25°C/60% RH and 40°C/75% RH separately (Thermolab Humidity chamber, India) for 90 days.[25] These samples were analyzed and checked for changes in physical appearance and drug content at regular intervals.
RESULTS AND DISCUSSION
The aim of the study was to formulate DS loaded IPC tablets composed of Xanthan gum and Eudragit E100. From the studies in this research work, it can be said that IPC can effectively be employed to formulate sustained release tablets. Yeole et al. 2006 have done design and evaluation of Xanthan gum based sustained release matrix tablets of DS in which they have given effect of natural polymer on drug release and also in increasing therapeutic efficacy. Also, Hingmire et al. 2013 have done formulation and development of sustained release matrix tablet using different drug: Polymer ratio and by using natural polymers, both separately and in combination. They have concluded that, formulation containing combination of two or more natural polymers showed sustained release of drug and hence, a combination technique can be used as an effective matrix former.
By taking this platform with certain changes, in this study, effect of natural polymer in combination with synthetic polymer has been studied to see whether IPC can form which will give better sustained release profile for selected drug. The results are discussed below as per the test.
Turbidity measurements
The change in transmittance as a function of the unit molar ratio of E100 to XG was measured to determine the composition of the IPC, as shown in Figure 1. The E100 acid solution and the XG aqueous solution were transparent regardless of their concentration prior to mixing. The transmittance of the IPC did not show a significant change with increasing E100 concentration up to E100: XG ratio of 1:1. However, the transmittance decreased as the ratio was changed from 1:1 to 1:6. The change in transmittance was not significant at higher ratios. It appears that the excess E100 did not react with XG because of the saturation of the electrostatic interaction sites of E100 by that of XG. As the XG to E100 ratio was changed from 1:1 to 1:6 (the amount of XG was fixed at 0.5 mM), there is no significant changes in transmittance which confirms the poor formation of IPC. The transmittance results clearly show that the complexation unit molar ratio of E100 with XG was 1:6. Therefore, the E100 and XG IPC with the mixing ratio 1/6 were used to characterize the IPC and to study the release profile.
Figure 1.
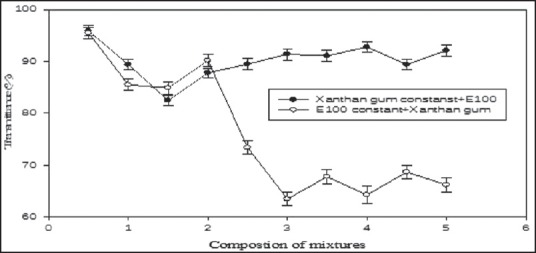
Turbidity of the Eudragit 100 and Xanthan Gum system
Fourier transform-infrared radiation spectra
Fourier transform-infrared radiation spectra were also used to confirm the chemical stability of DS in IPC tablets. Figure 2 shows the FT-IR spectra of (a) formulation, (b) pure DS. In the case of DS, a broad band at 3430 cm−1 is due to N-H stretching vibrations. Bands at 2924, 1772, 748, 1452, 771 cm−1 are attributed to alkaline C-H stretching, ester C = 0 stretching, aromatic C-H and aromatic C = C, C-N respectively. In the case of formulation all the bands that were observed in DS have also appeared, indicating the chemical stability of DS after making into the IPC tablet.
Figure 2.
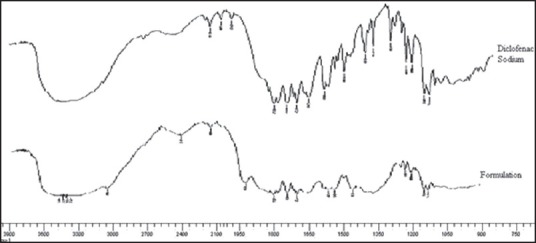
FT-IR spectra of Diclofenac sodium and formulation (F4)
Fourier transform-infrared radiation spectra were also used to confirm the formation of IPC. Figure 3 shows the FT-IR spectra of XG, E100, PM the (physical mixture) and IPC. XG exhibited sharp peak at 1728 cm−1 indicating the presence of carboxyl groups and O-H stretching vibrations and sharp peak at 3450 cm−1. Whereas, in E100, if exhibited sharp peak at 1580 cm−1 indicating the presence of dimethylamino groups and there is C-N stretching vibrations, and there is a sharp peak at 3433 cm−1. In IPC, there was no stretching for N-C group, and the amino group was missing, which infers the formation of complex. These results indicates that the carboxylic groups of XG are dissociated into COO− ions which complex with cationic groups of -N+(CH3)3 in E100 through electrostatic interaction leading to formation of the N+(CH3)3+COO− IPC.
Figure 3.
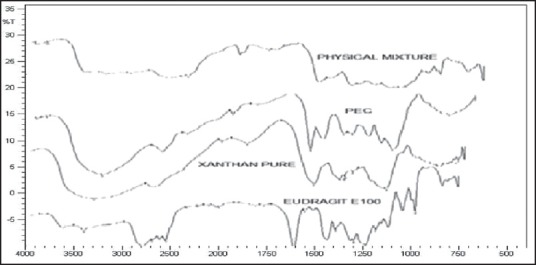
FT-IR spectra of Eudragit E100, Xanthan Gum, Polyelectrolyte complex and Physical mixture
Differential scanning calorimetry
In order to investigate the possible interaction between the drug and polymers, DSC studies were carried out are showed in Figure 4. In the DSC thermogram of XG, the glass transition temperature was observed near 270°C and the decomposition of E100 was observed at approximately 250°C at which E100 had melted and decomposed sequentially. The broad endothermic peak near 110°C was attributed to the physically bound-water. The endothermic peak of the IPC due to bound-water was smaller than that of E100. The water absorption ability of E100 is expected on account of its amine group being reduced by the complexation of E100 with XG. Therefore, the water absorption capacity of the IPC may be lower than E100.[26] The reduced water absorption capacity might result in the slow disintegration of the IPC matrix and the extension of drug release from the IPC matrix.
Figure 4.
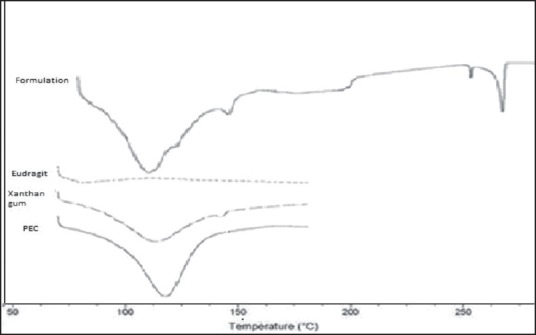
DSC thermograms of Xanthan Gum, Eudragit, Formulation, Polyelectrolyte Complex
Scanning electron microscopy (SEM)
The SEM photomicrograph of the tablet 6 h after hydration in Figure 5b showed a highly porous tablet surface which probably also reflects a porous tablet matrix structure. This would facilitate diffusion of drug from the tablet core to the surface. Since the gel layer undergoes surface erosion, it is possible that the inner porous network is exposed after the dissolution of the outer layer of the matrix. The formation of both pores and gel structure on the tablet surface indicates involvement of both erosion and diffusion mechanisms for sustained drug release.
Figure 5.
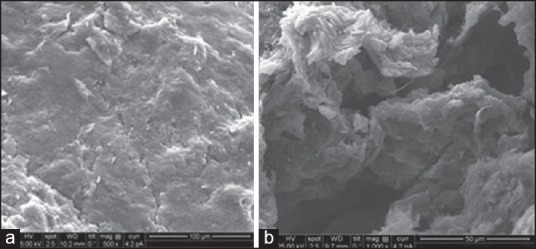
(a) Optimized tablet surface before, (b) after in vitro dissolution
Evaluation of diclofenac sodium matrix tablets
The matrix tablets prepared were evaluated for various tests and the results obtained are given in Table 2. The contents of the formulations were found to be uniform with drug content being >97% with <1.0% relative standard deviation. Hardness and thickness of prepared tablets was found to be satisfactory, and all formulations presented friability <1% during the friability determination. The weight variation test for all formulations complied within I.P. limits (±7.5%).
Table 2.
Evaluation data of diclofenac sodium matrix tablets

In vitro drug release studies
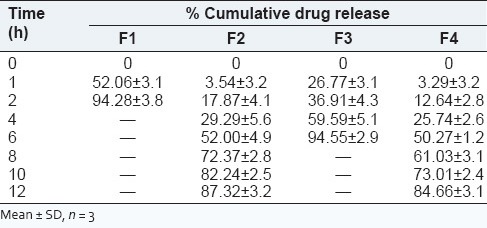
In vitro dissolution studies for the prepared matrix tablet and triple-layered matrix tablets were conducted for a period of 12 h using a six station USP XXII type II apparatus (Lab India Disso 2000 system, India.) at 37°C ± 0.5°C and 50 rpm speed. The dissolution studies were carried out in triplicate for first 2 h in pH 1.2 medium (900 ml) and then in phosphate buffer of pH 6.8 (900 ml). The in vitro release studies were carried out for all formulations in both acidic and basic media, and the release profile is shown in the Figure 6. The release profile of DS from formulation F1 was very fast, because in this E100 was used which was fastly dissolved in acidic pH. Almost 94% drug was released in 2 h. The release profile from formulation F2, F3, F4 was comparatively slower than that of F1. Burst effect was observed at first for all formulations, and later drug release was followed by erosion and diffusion. The pure Xanthan gum formulation showed drug release for 12 h where as the IPC formulation extended the drug release beyond 12 h. The possible explanation for the above pattern of drug release by the formulations can be explained by the following reasons. As per the literatures studied, the fact can be stated that the rate of drug release tended to decrease with an increase in the amount of polymer. Viscosity of the gel layer around the tablet increases with an increase in the hydro gel concentration thus limiting the release of the drug.[27] The gel formed during the penetration of dissolution media into the matrix structure, consists of closely packed swollen particles. With further increase in polymer amount thicker gel forms inhibit the dissolution media penetration resulting in a significant reduction in the drug release (F2 and F4 in comparison to other formulations). Formulation with pure xanthan gum rapidly hydrated and formed weak matrix systems which accounted for burst effect as well as release beyond 12 h as can be observed from the Figure 6. The PEC resulted with increasing matrix rigidity, thereby slowing the hydration rate of the gum followed by erosion that resulted in controlled release of drug with incomplete drug release at the end of 12 h. Among the prepared formulation, F4 showed good controlled release effect. F4 was found to be most similar to the F2 (pure Xanthan gum) with similarity factor value being 51.21 whose comparative release profile and release data are shown in the Figure 6 and Table 3.
Figure 6.
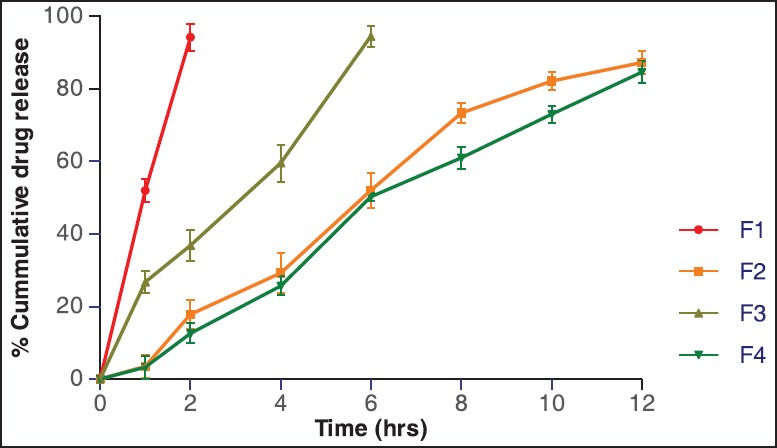
% cumulative drug release
Table 3.
In vitro release data of prepared diclofenac sodium sustained release tablets
Water uptake and erosion
Figure 7 shows the water uptake and erosion profiles for optimized formulation F4. The percentage swelling and erosion at the end of 12 h was 78.32% and 271% respectively. Thus, the matrices underwent both swelling and erosion at the same time immediately after placement in the dissolution medium, and this continued over the 12 h period of the study. Formulation F4 had overlapping erosion profile throughout the study period, but their swelling behavior was similar only up to the 6 h. The graph was almost linear as observed indicating a balance between a swelling and erosion resulting in sustained drug release as observed from the in vitro drug release profile.[28]
Figure 7.
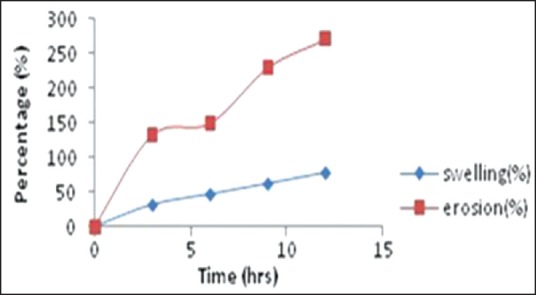
In vitro swelling and erosion data profile of optimized formulation (F4)
Kinetic analysis
The results of kinetic analysis of the dissolution data of the formulations are shown in Table 4. The release data showed high linearity with Korsmeyer equation. Drug release data of all tablet formulations showed a good fit into Korsmeyer equation (r2 =0.851-0.998) and Higuchi equation (r2 = 0.991-0.989) respectively. Value of release exponent “n” determined for various matrices ranged from 0.726 to 1.295. The values of release exponent “n” are characteristic of anomalous kinetics (non-Fickian) and indicated combined effect of diffusion and erosion mechanisms for controlled drug release. For all the formulations contribution of polymer, relaxation occurs throughout the dissolution as the “n” values approach anomalous transport and supercase-II mechanism.
Table 4.
Data of various parameters of model fitting of formulation

In vivo pharmacokinetic analysis
In vivo studies were carried out for oral DS solution and selected optimized formulation (F4) both containing 100 mg of DS on albino rabbits. Blood samples were withdrawn at different time intervals and plasma concentrations of DS were estimated, and the plasma drug concentration time profile is presented in Figure 8. From the data obtained, it may be observed that after oral administration, peak plasma concentration Cmax were 10.213 ± 1.45 μg-h/ml and 6.83 ± 2.86 μg/ml for DS solution and F4. The Tmax for reference and test formulations was 2.23 ± 1.54 h and 5.21 ± 1.32. The observed values AUC0-24 were 64.634 ± 5.67 and 97.637 ± 5.35 μg-h/ml for DS solution and F4. The elimination rate constant (Ke) for DS solution was found to be 0.644 ± 0.01 h−1 and 0.299 ± 0.03 h−1 for F4. The t1 /2 for reference and optimized formulation was found to be 1.054 ± 1.50 h and 2.314 ± 3.59 h respectively. From the results, it was observed that optimized formulation showed sustained/extended release. Standard plot data of DS is reported in the Table 5 graph in Figure 9 and HPLC chromatogram in Figure 10.
Figure 8.
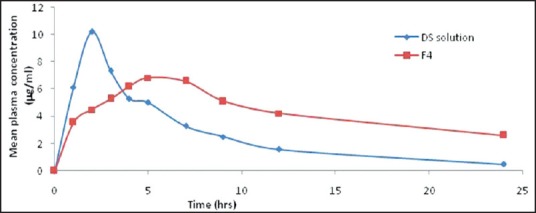
Mean plasma concentrations time profiles of DS Solution and F4
Table 5.
Pharmacokinetic parameters of DS solution and F4

Figure 9.
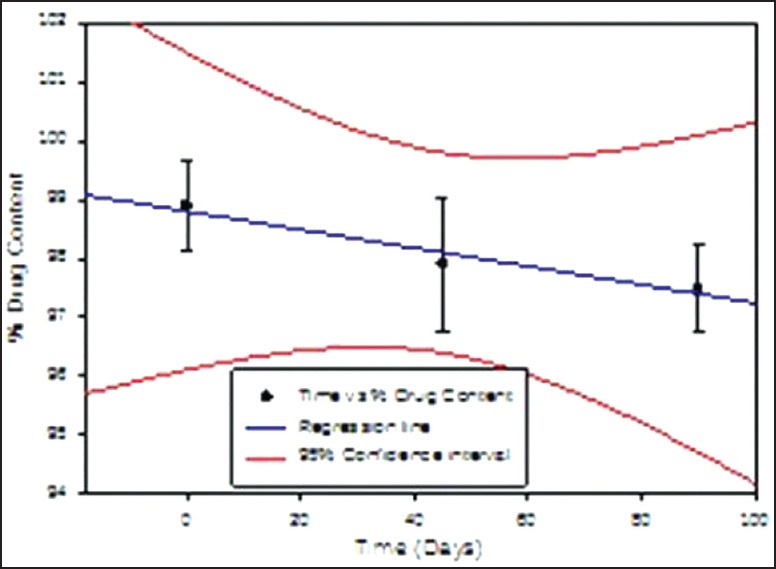
% Drug content in the matrix tablet formulation days F4 when stored at 25 ± 2 °C & 60 ± 5 % RH for 90 days
Figure 10.
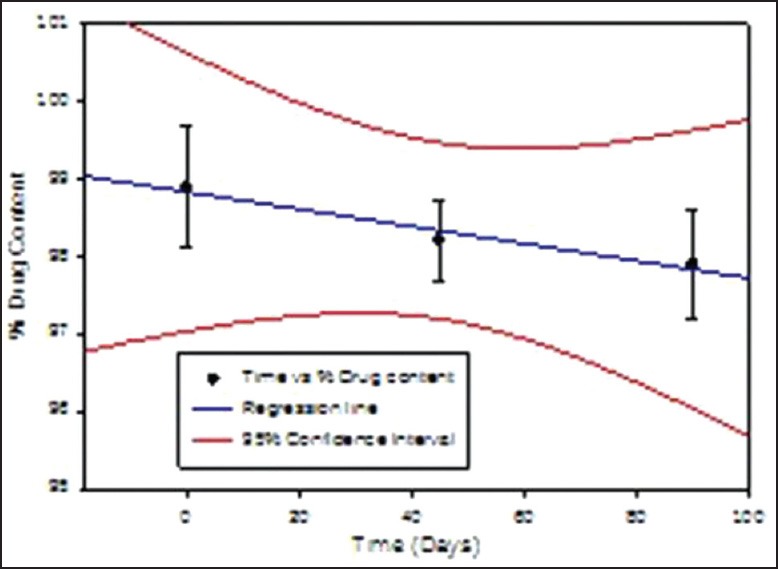
% Drug content in the matrix tablet formulation F4 when stored at 40 ± 2 °C & 75 ± 5 % RH for 90 days
Stability studies
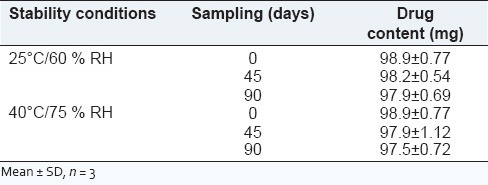
The obtained data is presented in Table 6. It is clear from the data that the formulation did not undergo any physical changes and drug content was within the limits throughout the study period. As India comes under Zone IV, the 30°C ± 2°C/65% RH ± 5% RH conditions are more appropriate but tablets are fairly stable at accelerated testing, it should not have affected the results.
Table 6.
Stability study data for formulation F4
CONCLUSION
By the above study, it was found that IPC was a promising method for formulating sustained release tablets. The formulation of DS as PEC (Xanthan gum and Eudragit E100) showed release of the drug beyond 12 h. The optimum ratio of Eudragit E100: Xanthan gum was found to be 1:6 by turbidity measurement method. The FT-IR studies also concluded that there was no interaction between the Poly Electrolyte Complex and the drug (DS). Short term stability studies show that the formulation was stable. Since the Poly Electrolyte Complex delay the release of the drug, it can be employed in formulating sustained release matrix tablets.
ACKNOWLEDGEMENT
The authors are highly thankful to the management of JSS College of Pharmacy, JSS University, Mysore, for providing all the necessary support.
Footnotes
Source of Support: Nil.
Conflict of Interest: None declared.
REFERENCES
- 1.Senuma M, Kuwabara S, Kaeriyama K, Hase F, Shimura Y. Polymer complex from copolymers of acrylonitrile and ionic vinyl benzyl compounds. J Appl Polym Sci. 1986;31:1687–97. [Google Scholar]
- 2.Sato H, Maeda M, Nakajima A. Mechanochemistry and permeability of polyelectrolyte complex membranes composed of poly (vinyl alcohol) derivatives. J Appl Polym Sci. 1979;23:1759–67. [Google Scholar]
- 3.Harris EL, Angal S. New York: Oxford University Press; 1993. Protein Purification Methods: A Practical Approach. [Google Scholar]
- 4.Yamamoto H, Horita C, Senoo Y, Nishida A, Ohkawa K. Polyion complex fiber and capsule formed by self-assembly of chitosan and gellan at solution interfaces. Macromol Chem Phys. 2000;201:84–92. [Google Scholar]
- 5.Hirouki Y, Takeshi K. Adsorption of BSA on cross-linked chitosan: The equilibrium isotherm. Chem Eng Japan. 1989;41:B11–5. [Google Scholar]
- 6.Dubin PL, Gao J, Mattison K. Protein purification by selective phase separation with polyelectrolytes. Sep Purif Methods. 1994;23:1–16. [Google Scholar]
- 7.Cordes RM, Sims WB, Glatz CE. Precipitation of nucleic acids with poly (ethyleneimine) Biotechnol Prog. 1990;6:283–5. doi: 10.1021/bp00004a009. [DOI] [PubMed] [Google Scholar]
- 8.Atkinson JG. Precipitation of nucleic acids with polyethyleneimine and the chromatography of nucleic acids on immobilized polyethyleneimine. Biochim Biophys Acta. 1973;308:41–52. doi: 10.1016/0005-2787(73)90120-2. [DOI] [PubMed] [Google Scholar]
- 9.Jendrisak J. Protein Purification: Micro to Macro. In: Burgerss R, editor. New York: Alan R Liss Inc; 1987. pp. 75–97. [Google Scholar]
- 10.Chen J, Jo S, Park K. Polysaccharide hydrogels for protein drug delivery. Carbohydr Polym. 1995;28:69–76. [Google Scholar]
- 11.Dautzenberg H, Kotz J, Linow KJ, Philipp B, Rother G. Static light scattering of polyelectrolyte complex solutions. In: Dubin P, Bock J, Davis R, Schulz DN, Thies C, editors. Macromolecular Complexes in Chemistry and Biology. Berlin: Springer Verlag; 1994. pp. 119–33. [Google Scholar]
- 12.Bartkowiak A, Hunkeler D. Carrageenan-oligochitosan microcapsules: Optimization of the formation process (1) Colloids Surf B Biointerfaces. 2001;21:285–98. doi: 10.1016/s0927-7765(00)00211-3. [DOI] [PubMed] [Google Scholar]
- 13.Murakami R, Takashima R. Mechanical properties of the capsules of chitosan-soy globulin polyelectrolyte complex. Food Hydrocoll. 2003;17:885–8. [Google Scholar]
- 14.Harding NE, Ielpi L, Cleary JM. Food Biotechnology Microorganisms. New York: VCH Publishers; 1995. Genetics and biochemistry xanthan gum production by Xanthomonas campestris; pp. 495–514. [Google Scholar]
- 15.Yeole PG, Galgatte UC, Babla TB, Nakhat PD. Design and evaluation of xanthan gum-based sustained release matrix tablets of diclofenac sodium. Indian J Pharm Sci. 2006;68:185–9. [Google Scholar]
- 16.Lu MF, Woodward L, Borokin S. Xanthan gum and alginate based controlled release theophylline formulations. Drug Dev Ind Pharm. 1991;17:1987–2004. [Google Scholar]
- 17.Dhopeswarkar K, O’Keeffe JC, Horton M. Development of an oral sustained-release antibiotic matrix tablet using in-vitro/in-vivo correlations. Drug Dev Ind Pharm. 1994;20:1851–67. [Google Scholar]
- 18.Watanabe K, Yakou S, Takayama K, Machida Y, Isowa K, Nagai T. Investigation on rectal absorption of indomethacin from sustained-release hydrogel suppositories prepared with water-soluble dietary fibers, xanthan gum and locust bean gum. Biol Pharm Bull. 1993;16:391–4. doi: 10.1248/bpb.16.391. [DOI] [PubMed] [Google Scholar]
- 19.Quinteros DA, Allemandi DA, Manzo RH. Equilibrium and release properties of aqueous dispersions of non-steroidal anti-inflammatory drugs complexed with polyelectrolyte eudragit e 100. Sci Pharm. 2012;80:487–96. doi: 10.3797/scipharm.1107-17. [DOI] [PMC free article] [PubMed] [Google Scholar]
- 20.Todd PA, Sorkin EM. Diclofenac sodium. A reappraisal of its pharmacodynamic and pharmacokinetic properties, and therapeutic efficacy. Drugs. 1988;35:244–85. doi: 10.2165/00003495-198835030-00004. [DOI] [PubMed] [Google Scholar]
- 21.Lopes CM, Sousa Lobo JM, Costa P, Pinto JF. Directly compressed mini matrix tablets containing ibuprofen: Preparation and evaluation of sustained release. Drug Dev Ind Pharm. 2006;32:95–106. doi: 10.1080/03639040500388482. [DOI] [PubMed] [Google Scholar]
- 22.Choi JS, Li X. Enhanced diltiazem bioavailability after oral administration of diltiazem with quercetin to rabbits. Int J Pharm. 2005;297:1–8. doi: 10.1016/j.ijpharm.2004.12.004. [DOI] [PubMed] [Google Scholar]
- 23.Farhana SA, Shantakumar SM, Narasu L. Sustained release of diltiazem hydrochloride from chitosan micro-capsules. Curr Drug Deliv. 2009;6:238–48. doi: 10.2174/156720109788680840. [DOI] [PubMed] [Google Scholar]
- 24.Emami J, Ghassami N, Talari R. A rapid and sensitive modified HPLC method for determination of diclofenac in human plasma and its application in pharmacokinetic studies. Daru. 2007;15:132. [Google Scholar]
- 25.ICH Harmonized Tripartite Guidelines, Stability Testing of New Drug Substances and Products. Q1A (R2) 2003 [Google Scholar]
- 26.Moustafine RI, Zaharov IM, Kemenova VA. Physicochemical characterization and drug release properties of Eudragit E PO/Eudragit L 100-55 interpolyelectrolyte complexes. Eur J Pharm Biopharm. 2006;63:26–36. doi: 10.1016/j.ejpb.2005.10.005. [DOI] [PubMed] [Google Scholar]
- 27.Chandran S, Ravi P, Saha RN. Development and in vitro evaluation of oral controlled release formulations of celecoxib using optimization techniques. Yakugaku Zasshi. 2006;126:505–14. doi: 10.1248/yakushi.126.505. [DOI] [PubMed] [Google Scholar]
- 28.Sujja-areevath J, Munday DL, Cox PJ, Khan KA. Relationship between swelling, erosion and drug release in hydrophillic natural gum mini-matrix formulations. Eur J Pharm Sci. 1998;6:207–17. doi: 10.1016/s0928-0987(97)00072-9. [DOI] [PubMed] [Google Scholar]


