

Summary
Objectives
The application of GIS in health science has increased over the last decade and new innovative application areas have emerged. This study reviews the literature and builds a framework to provide a conceptual overview of the domain, and to promote strategic planning for further research of GIS in health.
Method
The framework is based on literature from the library databases Scopus and Web of Science. The articles were identified based on keywords and initially selected for further study based on titles and abstracts. A grounded theory-inspired method was applied to categorize the selected articles in main focus areas. Subsequent frequency analysis was performed on the identified articles in areas of infectious and non-infectious diseases and continent of origin.
Results
A total of 865 articles were included. Four conceptual domains within GIS in health sciences comprise the framework: spatial analysis of disease, spatial analysis of health service planning, public health, health technologies and tools. Frequency analysis by disease status and location show that malaria and schistosomiasis are the most commonly analyzed infectious diseases where cancer and asthma are the most frequently analyzed non-infectious diseases. Across categories, articles from North America predominate, and in the category of spatial analysis of diseases an equal number of studies concern Asia.
Conclusion
Spatial analysis of diseases and health service planning are well-established research areas. The development of future technologies and new application areas for GIS and data-gathering technologies such as GPS, smartphones, remote sensing etc. will be nudging the research in GIS and health.
Keywords: Epidemiology, geographic information system, public health, cluster analysis, spatial analysis
Introduction
Place is the central element in all spatial analyses and varies in both size and shape depending on the context. For more than two thousand years, since Hippocrates’ On Airs, Waters, and Places, place has played an important role in understanding health and disease [1]. Historically, maps have been the primary source for storing and communicating spatial information. Maps have been used to describe geographic health and disease phenomena, which Filippo Arrieta was the first to do in 1694, and Seaman created the first ‘spot map’ in 1798 to describe cases of Yellow Fever in New York [2-3]. The most famous example of disease mapping is John Snow’s mapping of cholera cases in 1854 in London [4]. Maps have traditionally been presented on paper, either individually or in atlases. The development of computers has extended the concept of maps significantly to embrace maps displayed electronically as static maps, animated sequences of maps or interactive maps.
In the last two decades, the possibilities for mapping and for spatial analysis of disease patterns have changed dramatically, as computer power has increased and Geographic Information Systems (GIS) have emerged as individually accessible software, allowing for more widespread, complex and comprehensive analyses than previously. Such advances have made it possible for medical geographers, and others, to seek answers to questions that were previously overly complex and unfeasible. Through GIS analysis it is possible to understand why things are located where they are and, in combination with health and other sciences, how they are related. Obtaining disease and health data has been made easier by low-cost global positioning system (GPS) units and the improvement of the quality of Remote Sensing (RS).
In the course of the last centuries innovators such as Arietta, Finke, Seaman [2] and others [5-10] have mapped disease and measured incidence and prevalence rates, but what about measuring health? Measuring health or well-being includes cultural, social, environmental, biological and physical indicators that are often related to a geographical aspect, which Albrecht and Ramasubramanian [11] utilized in developing their Geographic Index of Relative Wellbeing. However, these indices for measuring health quality are based on society’s individual cultural, social, environmental and biological characteristics and are therefore seldom applicable for uses other than the narrow purpose for which they were developed [12].
GIS can be used to manage the modelling and mapping of disease; to develop new hypotheses in a geographic context; to analyse and predict future disease risks; and to undertake location/allocation analysis of the distribution of services and resources. Additionally, the advances and increased affordability in DNA sequencing has added another layer of complexity and potential insight [13]. GIS has, therefore, become an essential tool for health professionals who work with health data that contain a spatial reference. GIS has become increasingly available in the last two decades, and the implementation of GIS in health research has developed along the way,. Figure 1 shows the number of scientific articles on GIS in health published each year from 1991 to 2011. In 1991 only eight articles were published, in 2000 there were 78, and in 2011 more than 450 articles were published and indexed in either Scopus or Web of Science with the keywords ‘GIS’ and ‘health.’ GIS was added as a MeSH term in 2003 demonstrating its growing importance in the health literature.
Fig. 1.
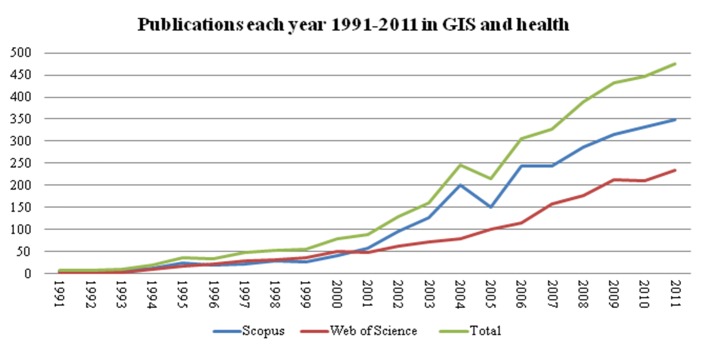
Articles published each year under the search term ‘GIS AND health’.
Data accuracy, correctness and completeness are key elements that affect our ability to effectively use GIS to undertake analysis of health issues. Collecting geographical health data has previously been limited, but the development and enhancement of technologies such as Global Positioning Systems and remote sensing technologies have made it easier to obtain geographical health data. In fact, in the USA, on May the 1st 2000 Bill Clinton removed the selected availability of GPS signals, which improved the accuracy of the spatial references that civilians could receive tremendously [14]. Despite the significant improvement in technologies to obtain geographic data, we still need to be able to geocode patient data to be to be able to undertake effective geographical analyses. This imposes a major challenge to health information systems in collecting data with adequate structure and granularity, ensuring reliability and validity of the relevant health data, and still maintaining appropriate privacy and security for patient records. Further, even when such data is collected it is often held “hostage” under the guise of privacy legislation requirements preventing ready access to key data sets.
Despite the challenges, research comprising health geography and GIS has expanded worldwide. The objective of this study is to review the literature and build a conceptual framework for the published research on health and GIS. The first step in building this framework is the identification and analysis of available literature. New and established research areas will be identified and classified for inclusion so that the framework can be used in strategic discussions and prioritizations in research environments working on GIS applications in health science. In this study the focus is on the applications of GIS and not on the technical and standardization aspect of GIS systems. Furthermore we focus on the public health area and not on environmental health.
Methods
We acknowledge that there are several standards and guidelines for writing reviews (Institute of Medicine, Cochrane, PRISMA etc.) and this paper selected the most relevant components among them. The identification of relevant literature was limited to journal articles, conference papers and reviews in the library databases Scopus, which includes the entire Medline library, and Web of Science published in the years 1991 to 2011. Only articles published in English were included. The search was limited based on the keywords designated to each article.
Papers covering veterinary health, crop or other areas of plant health, building or structuring health, and the health of the environment and ecosystems were identified in the original search, but excluded from further study, as the focus of this framework is on human health and disease as they relate to geography and GIS.
The papers included in this framework were selected and analyzed in a four step process:
The 1st step: The library database Scopus was used to determine the volume and characteristics of the literature and define the keywords strategy and search terms. The search terms applied are shown in table 1.
Table 1.
Search strategy. The search terms A and B contain the essential keywords for relevant articles, whereas the keywords in the search terms 1 to 12 narrow down the results of the literature search.
| Set | Search terms |
|---|---|
| A | Health* OR Disease* OR Illness* OR Medicine OR Medical* |
| B | GIS OR Geographic* Information System* OR Global Positioning System* |
| 1 | [A] AND [B] AND Epidemiology |
| 2 | [A] AND [B] AND Surveillance OR Prediction OR Detection OR Health Monitoring |
| 3 | [A] AND [B] AND Disease Cluster OR Disease Pattern |
| 4 | [A] AND Disease Mapping OR Disease Modelling |
| 5 | [A] AND [B] AND Disease Transmission |
| 6 | [A] AND [B] AND Planning OR Management OR Delivery OR Provision OR Accessibility OR Utilisation |
| 7 | [A] AND [B] AND Location Analysis OR Allocation Analysis |
| 8 | [A] AND [B] AND Health Preventive OR Health Prevention OR Prophylactic OR Health Promotion |
| 9 | [A] AND [B] AND Rehabilitation OR Health Outcome |
| 10 | [A] AND [B] AND Telehealth OR Assisted Living |
| 11 | [A] AND [B] AND Geocoding OR Data Mining |
| 12 | [A] AND [B] AND Remote Sensing OR RFID OR Radio Frequency Identification OR Pedometer OR Accelerometer |
The 2nd step: The library database Web of Science was searched with the same search terms as in table 1. Articles with topics that matched the search terms and were not already included in step 1 were added to the list of references.
The 3rd step: The reference lists of each of the papers selected during steps 1 and 2 were examined. Articles whose title coincided with any of the search terms were deemed relevant and also included in the study.
The 4th step: All the abstracts of the identified papers were read. Using a grounded theory-inspired approach, and passing through several iterations, they were grouped into categories based on their main focus. The key papers, that were felt to speak to fundamental issues, and the papers that were difficult to place in a category were read in their entirety. The categories were treated individually, but in reality papers constituting the categories are often related and it was consequently difficult to achieve complete exclusiveness among the categories and, hence, some articles occured in more than one category.
It should be noted that remote sensing technologies were added to the search because they constitute an important issue when discussiing GIS. GIS needs accurate data to analyse in order to give added value, and are included here to show their significance in the categorization.
Results
The first step in the literature search in the library database, Scopus, yielded 562 references published in the years 2000 to 2011. The search in Web of Science added 144 references, and searching the list of references in these 706 papers added another 159 references, creating a total number of 865 papers.
The first iterations of reviewing the articles identified a number of key areas as described below.
The basic principles of disease geography focus on describing, exploring and analyzing the incidence and prevalence of disease in a spatial context – an epidemiologic surveillance approach, and
Disease surveillance which can be divided into two coherent elements: disease mapping and disease modelling [15].
Disease mapping describes the past and present distribution of disease; past and present spread and transmission of disease; disease incidence and prevalence rates for monitoring health quality; surveillance of environmental hazards; historical trends in disease; combining epidemiological, environmental and geographical information to generate new hypotheses; and evaluating the outcome of interventions and disease preventive activities. Disease modelling takes disease mapping a step further by using past and present disease information to predict future disease outbreaks and transmission patterns; analyze the risk of disease; predict environmental factors that promote disease; test hypotheses; determine disease hotspots for intervention or prevention; and monitor the drivers of epidemics.
The geography of disease is intertwined with the geography of the health care system [16]. The close link between the geography of disease and that of the health care system is significant and has implications regarding the allocation of resources where they are most needed [17]. The geography of the health care system is resourcing the supply of care where it is needed; planning the service structure; allocating staff and resources; allocating and dispatching emergency services; minimizing disparities and inequities in the access to services and facilities; and analyzing the effect of distance to services on the utilization of said services and on health outcomes.
The geography of disease and the health care system cover the surveillance of disease and illness and the planning, provision and management of services to cope with disease and illness – the curative or management aspects of disease and health. Apart from the curative aspects, public health aspects such as health promotion and preventive activities are part of the research carried out within health geography and GIS. Health promotion and prevention are related to reducing the chemical, physical, infectious, behavioral and mental impacts that humans deal with every day and to promoting a healthier lifestyle via, for instance, physical activity and better nutrition.
During the review iterations four distinct categories crystallised: spatial analysis of disease, spatial analysis of health service planning, public health, health technologies and tools. The four categories are defined as follows:
Spatial analysis of disease embraces disease mapping and modelling; geographical epidemiology such as disease detection, prediction, surveillance and monitoring; environmental epidemiology such as causality and risk analysis, disease transmission, and the analysis of disease patterns.
Spatial analysis of health service planning focuses on spatial analysis for planning, management, delivery, provision, accessibility and utilization of health care and emergency facilities.
Public health comprises spatial analysis for promotion, preventive and rehabilitation activities as well as spatial analysis of health outcomes.
Health technologies and tools concentrates on technologies for collecting health data such as GPS, remote sensing, and personal peripheral devices like accelerometers and heart rate monitors as well as health data manipulation tools like geocoding and data mining.
Table 2 shows the categories, the number of articles in each category and the primary keywords describing the content.
Table 2.
The number of articles and the primary keywords for the four categories into which the results have been divided.
| Spatial analysis of disease | Spatial analysis of health service planning | Public health | Health technologies and tools | |
|---|---|---|---|---|
| Number of articles | 503 | 307 | 126 | 176 |
| Primary keywords | Epidemiology, surveillance, prediction, detection, monitoring, disease cluster, disease pattern, disease mapping, disease modelling, disease transmission | Planning, management, delivery, provision, accessibility, utilisation, location analysis, allocation analysis | Health preventive, health prevention, health promotion, prophylactic, rehabilitation, health outcome, telehealth, assisted living | Geocoding, data mining, remote sensing, RFID (radio frequency identification), pedometer, accelerometer |
The publications found were analyzed by publication year to show the chronological development from 2000 to 2012 in the four groups identified – see Figure 2. The publications in the area of spatial analysis of disease dominated the entire period, and during the last year the number of publications in this area almost doubled from 62 to 100. The other three categories have seen up to 20 publications per year. During the last year of the study period the category of spatial analysis of health services planning experienced the same relative increase as spatial analysis of disease while health technology and tools increased by more than 100% (12 to 32 publications per year).
Fig. 2.
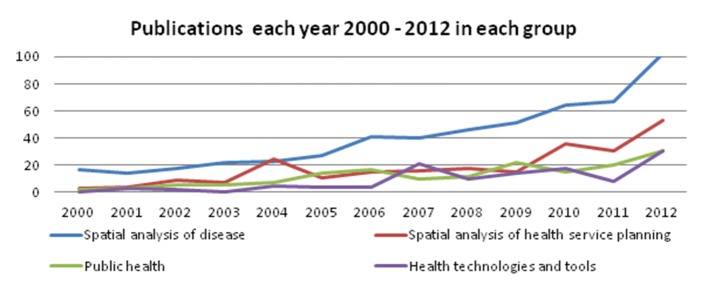
Articles published each year within the four main categories
The articles within the category ‘spatial analysis of disease’ were further analyzed for relation to infectious diseases and non-infectious diseases (see Table 3). The articles in these two areas contained 367 references, of which eight articles focused on mortality in general.
Table 3.
Number of articles in the category “Spatial analysis of disease in relation to infectious and non-infectious disease.
| Spatial analysis of disease | |
|---|---|
| Infectious | 248 |
| Non-infectious | 119 |
Among the articles on infectious diseases malaria was the most common disease undergoing GIS analysis with 40 articles being published on this alone. Thirty-nine articles dealt with Schistosomiasis, a parasitic disease caused by a worm contracted through improper water and sanitation facilities. Dengue fever, HIV and Leishmaniasis occurred 25, 22 and 15 times respectively (see Table 4).
Table 4.
The five infectious diseases most commonly analyzed
| To p 5 infectious diseases | No. of articles |
|---|---|
| 1. Malaria | 40 |
| 2. Schistosomiasis | 39 |
| 3. Dengue fever | 25 |
| 4. HIV | 22 |
| 5. Leishmaniasis | 15 |
The most common non-infectious disease among the GIS and health articles was Cancer with 31 references. Asthma had about half the number of articles and cardiovascular diseases, diabetes and obesity had only eight, seven and five articles focusing on these diseases (see Table 5).
Table 5.
The five non-infectious diseases most commonly analyzed
| Top 5 non-infectious diseases | No. of articles |
|---|---|
| 1. Cancer | 31 |
| 2. Asthma | 14 |
| 3. Cardiovascular diseases | 8 |
| 4. Diabetes | 7 |
| 5. Obesity | 5 |
Given the geographic nature of our work it was appropriate to examine what continent the different articles related to. Table 6 shows the geographic distribution of the 865 studies. Since eight articles concerned more than one continent, the total number of studies represented 873. In the categories spatial analysis of health services planning and health technology tools there are many studies that do not relate to a specific continent because of a generic approach and content so these were categorised as ‘No specific continent mentioned’. The relative proportion of published studies by continent and category is indicated as a percentage in brackets.
Table 6.
The number of articles in the four categories in relation to what continent they are concerned.
| Continent | Spatial analysis of disease | Spatial analysis of health service planning | Public health | Health technologies and tools |
|---|---|---|---|---|
| Africa | 82 (16..0%) | 35 (11..4%) | 4 (3..2%) | 10 (5.4%) |
| Asia | 139 (27.2%) | 33 (10.7%) | 6 (4.8%) | 22 (11.8%) |
| Europe | 64 (12.5%) | 36 (11.7%) | 20 (15.9%) | 27 (14.5%) |
| N. America | 132 (25.8%) | 98 (31.9%) | 44 (34.9%) | 41 (22.0%) |
| Oceania | 14 (2.7%) | 19 (6.2%) | 8 (6.3%) | 2 (1.1%) |
| S. America | 60 (11.7%) | 4 (1.3%) | 2 (1.6%) | 9 (4.8%) |
| No specific continent mentioned | 20 (3.9%) | 82 (26.7%) | 42 (33.3%) | 75 (40.3%) |
The following sections describe each category in more detail. Only the 196 most significant references are mentioned, but the result of the entire search is available here (download pdf file).
Spatial Analysis of Disease
The geography of disease is the most basic theme in GIS analyses in health, as knowledge of spatial disease occurrence, incidence and prevalence are fundamental for planning health care services, for health promotion activities and health prevention activities.
As identified earlier, the surveillance of disease consists of two elements: disease mapping and disease modelling: Disease mapping can include illustrations of the distribution of a disease-infected population in the form of incidence or prevalence rates for a given area or more complex models that mimic real world environments by combining multiple data sources that might be considered non-traditional in the health field, like the presence of highways or green space.
Mapping of disease data can lead to discoveries of patterns; ranging from clusters, to uniformly spaced, to randomly distributed data, and including concepts such as how data are dispersed around a center (compactness) or how they trend in a particular direction. Analysis of disease distribution and the recognition of patterns are scale dependent and individual for each analysis [18]. Disease distribution can be mapped on a global [19-20], national [21] or local scale, i.e. a province [22] or a city [23].
Mapping disease patterns in correlation with other spatial information can be instrumental to examine the cause of the pattern by identifying contributing factors and thereby strategically targeting intervention efforts to reduce or remove any disease-promoting factors in the places where they are most prominent [4], instead of just targeting the whole population.
Analyses of disease distribution and patterns are used frequently within health science research; for example, spatial distribution analysis of incidence and prevalence rates for different ethnic population groups [21], distribution of disease mortality [24], mapping and analysing hotspots for disease occurrence [25-28], maps of transmission hotspots based on geographic information of highly crowded areas [29] or analysis of influenza incidence clustering [30].
Analyzes of spatial clusters are based on Tobler’s first law of geography stating [31] that things which are closer to each other are more alike than things that are further apart. Tobler’s law has been used as the basis for analysis of disease, as people who live next to each other tend to be exposed to the same factors that promote certain diseases; hence, the analysis of disease patterns and the hazards of disease clusters can help determine the causality for disease outbreaks. Diseases are caused by exposure to different hazards. Jarup [32] showed this well in his analysis of the spatial distribution of prostate cancer in relation to environmental carcinogens. He mapped the exposure to chemicals in relation to disease occurrence revealing spatial patterns and relationships [19]. Another example is Fischer’s [33] analysis of the spatial distribution of leprosy in relation to the spatial distribution of risk factors. In addition, Wilhelm [34], among others [35-40], analyzed the relation between air pollution and disease, and Chellini [41] analyzed the hazards of living near a sewage plant in relation to the occurrence of lung and laryngeal cancer incidences.
Analysis of spatial hazards such as air pollution can be a challenging task that may include setting up a fine net of pollution monitoring stations. In a GIS, the task may be simplified by focusing the analysis of data on information from a few measuring stations combined with knowledge of factors such as terrain and wind conditions that can provide a smooth, continuous estimate of exposure values between the monitoring stations.
Maps of disease information over time can provide insight into how a given disease behaves and help predict the development of this disease and future needs for intervention and medical facilities. Temporal disease mapping can identify trends over time [42–44] – when the occurrence increases or decreases in specific areas [30, 45]; moves in a certain direction [46, 47] – or is a periodically recurring pattern (cycles).
Temporal analysis aids our understanding of the etiologic drivers of diseases and limit disease-promoting elements, and for evaluating the efficiency of interventions and testing hypotheses for disease reduction.
GIS can be used to test, or generate, hypotheses in either a theoretical environment or actually based on information from the real-world environment, which is what Wagner et al. [48] did. He used GIS to test the hypothesis that elevated groundwater uranium levels and more frequent groundwater use increased cancer incidence. Furthermore, Beyer et al. [49] developed an open source GIS application that encourages community participation and contains information about colorectal cancer in Iowa, thus using the participants’ local geographic knowledge to promote hypothesis generation about colorectal cancer risks and interventions that might reduce the risk.
Modelling of potential future disease occurrence or the early detection of epidemic outbreaks through surveillance of global disease cases is an area under development. Modern disease outbreak monitoring systems such as the Global Public Health Intelligence Network GPHIN [50], Health-map [51], and BioCaster [52] are, among other things, using online information sources to update their disease maps in real-time. Fleming et al. [53] developed a specific early warning GIS tool to identify suitable environmental conditions for cholera outbreaks in South Africa. Additionally, Lewis et al. [54] analyzed signs, symptoms and diagnostics of disease, gathered on a daily basis and used for monitoring and evaluating disease outbreaks to compare with historical and seasonal patterns in an attempt to detect major disease outbreaks at an early stage. The disease outbreak monitoring system is a great tool for illustrating global patterns of disease, whereas the more specific models for predicting local outbreaks are valuable tools, as these are customised for their region’s unique environmental factors and as such are a better tool for early detection disease epidemic outbreaks.; essential in order to focus health resources and limit the spread of disease. The California Department of Public Health publishes an interactive web map related to Healthcare Associated Infections which exemplifies this use of GIS to limit the spread of disease: It can be seen at http://www.cdph.ca.gov/Programs/Pages/MyHospital411Infections. aspx#/@6/37.546/-119.202?tab=CDI (Last accessed 23rd May 2014)
Modelling geographic areas with a higher risk of disease via temporal and spatial prediction is a valuable tool for limiting future disease occurrence and spread. Multi-criteria decision analysis of casual factors or relationships can identify areas at high risk of disease occurrence by incorporating knowledge of environmental or socioeconomic factors. Examples in the literature mapping the habitats of the host snails for schistosoma japonicum disease [55], mapping elevation height and low population density areas as predictors of a high risk of child mortality [56], analyses of how temperatures affect dengue fever distribution to predict future endemic areas as a result of climate changes [57] or analysis of ecological transformations caused by floods, changes in water resources and climate changes for predicting future infection risks [58].
Relationship analyses constitute another method for identifying high risk areas for disease; for instance, Nakaya et al. [59] developed a model for predicting local HIV epidemics in Japan via geographic variation in population growth and spatial relationships in HIV transmission, and Khormi & Kumar [60] are modelled risk areas of dengue fever on the basis of the relationship between dengue fever cases and socioeconomic factors (such as: population numbers, population density and neighborhood quality).
Spatial Analysis of Health Service Planning
The primary elements in health care systems’ are the patients, clinicians and facilities. They all have a geographical location, and the co-location of all three elements constitutes the highest opportunity for successful management or cure of disease. The absence of planning of services in relationship to the populations served is evident across the globe creating disparities in access for segments of the population. In reallocating health care services often results in a compromise between the population distribution, treatment needs and available resources (equipment and personnel). Incorporating GIS techniques enables for service optimization for population served by incorporating spatial distance, demographic information [55, 56] and capacity [58, 61, 62].
There are multiple methods used for calculating spatial distances. The simplest is the Euclidian (straight line) distance although fast performance and minimal impact on the results in an urban environment but in rural areas can cause errors due to its reliance on aggregating the population in an area to a single point for the entire area population.
A more accurate approach uses a street-level reference datasets that can measure actual distances and travel times which may be especially important for areas where terrain and/or traffic can significantly increase travel times even when distances appear relatively short [57-64].
Apart from location-allocation analysis, parameters for supply and demand are often analyzed, when health care facilities are planned [65-67]. An example of an analysis of the need to plan health care facilities includes Ong et al. [68], who use a database of cardiac arrests to find patterns in the occurrence of incidents and locate defibrillation devices in accordance to the findings. Using GIS to locate optimal places for equipment has also been used in planning the allocation of emergency services; based on geography, population and the projection of needs, to minimise the response time for both ambulances and helicopters [69, 70].
GIS has many application areas within health care planning, but no matter which model or method is used, a compromise between several elements is required.. Policy-makers and government officials have to make the decision, and this is where GIS can play an important role as a spatial decision support system, by informing the decision-makers of the pros and cons of different solutions [71-74]. An example of the use of GIS to reflect on the consequences of health care planning by Brabyn [75], who used GIS to calculate the percentage of the population who, as the result of a proposed health reform, must travel for more than one hour to reach an emergency department. Other examples would be the impact of closing a clinic in a region on service resource allocation and access.
GIS contains a wide variety of tools for conducting relationship analysis, which helps broaden our insight into the factors that influence the utilization of health care facilities and, perhaps more importantly, health outcomes. Higgs [76] stated, “Research is also needed to examine the potential relationship between distance, utilization patterns and health outcomes.”
Utilization is closely linked to accessibility, which can be measured with a variety of methods. Brabyn et al. [79] and others [80-84] have researched methods for measuring accessibility by comparing different methods. Methods compared by Brabyn et al. [79] include measuring the ratio between patients and medical staff in an area, using drive time and distance analysis to determine the shortest path in time or distance between patients and medical staff and complex network analysis that takes the capacity of the medical staff into account, when calculating the shortest time/distance for patients. The methods are different in terms of accuracy and calculation time and are therefore applicable in different analysis conditions, such as the size of geographic area, the number of patients and medical staff and the complexity of the road network. Careful consideration of the advantages and drawbacks of each method is essential to make an adequate analysis of each area.
Spatial modelling aids in planning to model and predict utilization of services and explore the impact of locating these facilities in different places. Other key factors to consider are how various population groups’ utilization of health care facilities differently. Research into the association between human behavior, geographic accessibility and the utilization of health care has been carried out by Arcury [77] and Chang [78] among others. One factor, in particular, has had an impact on the utilization of health facilities: distance [79, 80]. Higgs [76] examined different spatial analytical approaches to investigate the influence of distance on usage of health services. Other factors’ influence on health service utilization has also been examined. Leung et al. [81] state that factors such as socioeconomic status and regional density have a more recognizable effect on the utilization of health services. Environmental factors are also believed to have an impact on utilization of health services [82], along with physical structures such as rivers and borders [83].
Combining usage of health services with accessibility estimations, theoretically actual accessibility can be derived, as demonstrated by Loh et al. [89], who used patient databases to measure actual accessibility as defined through usage, which was then compared to the potential accessibility calculated on the basis of the shortest path between patient and hospital for example. Others compare the actual distance between patient and health facility with the perceived distance as a measure for the perceived accessibility; hence, the actual accessibility is not merely limited by the actual distance, but also the perceived accessibility, which is individual and affected by factors such as access to public transportation or ownership of a car. Perceived accessibility is concerned with the actual use of the health services in question, as this could lead to better health. Hence, research into associations between accessibility and health outcome have been carried out by several researchers [90-93], focusing on the association between heart disease mortality and geographic access to hospitals in one case [94] and survival from cancer associated with patients’ travel time to health care in another [95].
Inequalities in access to health a service are inevitable, but analyses providing information that lead to furthering our understanding of these inequalities can be used in the planning of health care facilities. Researches into inequalities in terms of accessibility have been conducted by several researchers [96-102].
Public Health
Public health is defined by the Institute of Medicine as “fulfilling society’s interest in assuring conditions in which people can be healthy” [103]. Every day humans are exposed to a fluctuating amount of hazardous impacts on their health in the environment in which they live and travel. The amount and type of hazardous impacts each human encounters differ from area to area, but determinants such as prosperity, educational attainment, technological advancement, health norms, politics, religion, gender, age, occupation, genetics and many more also have an influence.
Health agencies and governments implement health preventions across the globe in attempts to reduce the adverse effects of environmental factors. Targeting health prevention activities strategically is crucial, as Alcaraz et al. [104] establish in their study for cancer prevention and control. GIS can provide a deeper understanding of the community and which segments can best be reached with localized interventions, [104]. Miner et al. [106] analyzed the community cancer risk in Alabama, using GIS to target prevention programs. Evaluating preventive activities and health outcomes via GIS has not been widely adopted [102]. Only one article using GIS, Gikandi et al. evaluated the effects of a malaria strategy in Kenya promoting the use of insecticide-treated nets for pregnant women [107]. They concluded, among other things, that women living further away from the antennal clinics were less likely to use the nets, even five years after promoting the issue [107].
The environmental exposures can be divided into four groups: chemical, physical, mental or infectious: Chemical exposures can occur through emissions from traffic and industry; drugs, alcohol or smoking; contaminated earth or water; pesticides in drinking water and vegetables; poisoning; allergy-provoking chemicals; and lack of important vitamins and minerals in daily nutrition. Measuring air pollution and its effects on the public health has been researched eagerly in the past decade. The majority of these studies measure air pollution using methods [36, 108] that are based on the residence of the individuals in question [35, 37, 38, 109, 110] and less often on the individuals’ exposure outside their residence, i.e. in commuting and at the workplace. Isakov et al. [111] presented a method for combining several models for measuring air pollution to get a better estimate of personal exposure, and Lindgren et al. [37] used a questionnaire to obtain self-reported exposure at a personal level. The effect that air pollution has on human health can be associated with allergy [35, 37], respiratory diseases [35, 109], cardiovascular disease [110] and mortality [38, 110].
Research on lead poisoning in children has, in several cases, indicated an association with older housing [112-114], and GIS has been used to determine areas at risk, leading to preventive actions [115] by screening the children in the affected areas [113, 116, 117], lead hazard remediation of houses [117] and the development of healthier neighbour-hoods through increased walkability and green spaces [114].
Exposure assessments, as in the lead prevention or air pollution cases, are useful applications of GIS for improving the health of vulnerable groups, and they can be applied to prevent or minimize the adverse effects of chemical exposures that humans encounter. Other examples of exposure assessments via GIS have measured the trichloroethylene levels in water and its association with neuro-behavioral deficits [118] and the association between nitrate content in drinking water and breast cancer [119]. Exposure assessments are also applicable to other types of impacts, such as the physical, mental and infectious.
Exposure assessments of physical hazards; such as different types of radiation (UV or electromagnetic waves) [120-125], weather changes (extreme heat or cold) and their association with increased probability of fatality [126-128], cardiovascular diseases [129], melioidosis cases [130], and impacts on disease transmission [131] have all been studied. Exposures to noise and light have been mapped to measure the effect on humans [132-135] and associations with specific diseases [136-140], e.g. hypertension and insomnia. Mapping hotspots of traffic accidents, involving vehicles, cyclists and pedestrians provides opportunities for city planners to target interventions to the highest risk areas aimed at preventing accidents and physical injury [141-143].
Measuring the exposure of mental impacts through GIS for prevention and promotion has limited research coverage currently and what does exist concentrates on stress, noisy crowds, relationships to family and friends, society and fear of being assaulted physically or verbally. This is due to the inherent difficulties in obtaining mental health data. Zhang et al. [144] investigated the relation between individual and neighborhood education levels and mental health, which could help target preventive activities to areas with low levels of education. Prevention of depressive episodes for individuals with bipolar disorder can be supported when relevant, due to GIS and GPS monitoring of symptoms. For example, when changes in a patient’s daily routine [145] are observed (such as failing to attend clinic for medication administration) interventions can be targeted by Mental Health Support workers to assure that the individual remains stable.
The built environments impact on disease transmission of viruses, parasites and bacteria transmitted from other humans, insects, fish or animals can be related to the quality of buildings; the materials inside the buildings, as these favor different diseases; the quality of water; and whether the place one has chosen to live has a high or low density population. Attempts to prevent the transmission and occurrence of infectious diseases have utilized GIS to map the distribution and incidences of diseases [28, 146-149] and analyze the environmental risk factors promoting the spread of a given disease, such as animals [28, 147, 150] or water [151].
Health promotion is about encouraging people to live a healthy life by increasing physical activity, consuming nutritious foods and increasing happiness through social community cohesion and equality, which positively affect the human resistance to disease.
A great amount of research promoting physical activity and thus improve the general health has been done – from analyses of walkability in urban areas, as a function of the environment [152-156], to assessing the suitability for walking and cycling [157] and using GPS and accelerometers [158, 159] to measure individuals’ physical activity levels’ association to the housing environment and its impact on the individuals’ health and wellbeing. Research has shown the following environmental factors influence the physical activity: [160]; proximity to green areas, vegetation and recreational areas [152, 161], streets’ and roads’ suitability for walking and cycling [153, 155, 156] building age, public transport provision, safety, crime and street connectivity [151] promoting alternate modes of transportation-public transportation, walking or biking - to increase activity levels [152, 158].
Access to healthy foods has been studied using GIS to identify ‘Food Deserts” and measure the exposure to food outlets and retail stores to analyze the supply of food in a neighborhood [159-161] and to understand the environment influence on eating behaviors, as studied by French et al. [166], can facilitate the creation of interventions that change neighborhood environments in a way that promotes the intake of healthy food [167].
Health Technologies and Tools
GIS software packages of varying content and origin are widely available today. Some GIS software has been made for special purposes and limited analysis capabilities to that purpose, e.g. CMAP (Crime Mapping and Analysis Program) or LOLA (Locational analysis), whereas other more comprehensive packages provide a more general analysis tool, e.g. ArcGIS or MapInfo. In all GIS software on the commercial, or the free market, the core is the analysis they provide to the user. The GIS analysis enables the user to analyze why things are located where they are and how things are related. GIS analysis can improve data accuracy and create information that was previously unavailable and thereby help users get a deeper understanding of a place, make the best choices and prepare for future events and conditions.
GIS has a wide range of analysis options, which can be helpful for health prevention and promotion initiatives, disease curing and rehabilitation. These options include distance, neighborhood, smoothing, spatial interpolation, geostatistical (i.e. Geary’s C and Moran’s I), spatial relationship, density and geographic process analysis.
Examples of the impact of distance on health, e.g. Acharya et al. [91] among others [77, 78, 89, 164-167] where distance analyses is used to understand how utilization of services are influenced by distance to health services.
Variance of Geostatistical methods used to compare neighborhoods is often based on the diseased individual’s address, and relies on a process called geocoding which assigns latitude and longitude coordinates to the address. Different approaches to geocoding exist, with varying levels of accuracy and precision, impacting final analytic results. Zinszer et al. [168] among others [169, 170], evaluated the overall impact of accuracy and precision in geocoding [172-174] who also argue that further research into errors in health data geocoding is essential due to the uncertainty of their results. Improvements in geocoding was demonstrated in studies comparing geocoding methods delivered by the large providers [39, 175-177], which is what Lin et al. [178] did, using ESRI’s ArcGIS geocoder and Google maps’ geocoding service.
Another limitation of Geocoding patient’s residence ignor other locations where individuals spend significant amount of time: work, school, etc. Mapping people’s daily exposure is difficult without accurate knowledge of their behaviour and temporal locations; e.g. Whyatt et al. [179] used GPS to estimate people’s exposure to air pollution. Small sized GPS receivers are optimal for tracking movement and when combined with additional health-related sensors (e.g. ECG or heart rate monitors), can be powerful tools for measuring health-related parameters.
Apart from geocoding on individual levels it can be useful to geocode health survey data to small area levels, such as census tracts or even countries. Other data geocoded to the same geographic level can then be merged into the dataset for subsequent inferential analysis. A GIS can play a key role in merging these multiple data layers. As such uncertainty in geocoding and its potential implication in spatial analysis with health data should be considered in future studies.
A rising concern within health departments are the growing numbers of vulnerable population such as senior citizens, who would prefer to age in place. Aging in place refers to, “the ability to live in one’s own home and community safely, independently, and comfortably, regardless of age, income or ability level” [180]. One study looked at how combinations of GPS with other sensors were used to monitor a sample of elderly and disabled individuals remotely. An alert would be triggered and rescue personnel dispatched to the individual’s GPS location when certain criteria were met [176], enabling [181], these people to live more independently. Worringham et al. [182] combined single-lead ECG and heart rate sensors with GPS to help monitor patients in rehabilitation programs living who live in remotely areas or far from a hospital to participate from a distance and still have contact with qualified exercise scientists. The sensors provided the exercise scientists with information about the physiological parameters of a patient’s performance, while the GPS provided speed and location. Other technologies are also commonly used to measure physical activity such as accelerometers [152], pedometers [183] and mobile phones [184]. The exercise scientists can employ these tools to analyze the patient’s progress and give them advice in the ongoing rehabilitation process.
Other examples of remote sensing or field measurements via GPS. Aids in the Analyses of disease incidence rates and causes of infection impacted often rely on the exploration of environmental risk factors. Remote sensing, in general, refers to the collection of information about an object of phenomenon without making physical contact with it refers to the use of aerial sensor technologies to detect and classify objects on Earth (both on the surface, and in the atmosphere and oceans) by means of propagated signals (e.g. electromagnetic radiation). For example, Chunxiang et al. [190] analyzed the potential endemic disease risk after an earthquake. In practice, this information may be obtained from numerous kinds of monitors or from aerial imagery and satellite systems enabling disease monitoring, surveillance, control, evaluation and risk mapping. Allen and Wong [183] monitored and evaluated disease risk for West Nile virus using GIS and remote sensing to characterize and analyze the habitat and environmental conditions affecting mosquito breeding. Key data is able to be incorporated into the analysis which otherwise may not have been possible before: data at different spatial resolutions (e.g. vegetation types, land cover, surface temperatures, soil moisture and building density)., Johnson et al. [127] use remote sensing to obtain land surface temperatures and combined with sociodemographic risk factors to improve the understanding of health risks caused by high temperatures. And Khormi and Kumar [60] used remotely sensed data to understand housing density, street width and roof areas of houses. When this was combined with socioeconomic parameters, it represented a powerful explanation of risk for infectious disease [185]. The use of remote sensing to give an early warning of epidemic diseases within health research is relatively new, Herbreteau et al.’s [186] and Beck et al.’s [187]
Discussion
The health hazards that humans are exposed to every day are caused by a variety of aspects in their lives. Individuals are born with certain genes, making them more or less susceptible to certain diseases. In the course of an individual’s life his or her socioeconomic status, social conditions and relations affect the individual’s living conditions, which again influence the individual’s lifestyle in terms of housing, mobility, nutrition, stimulants etc. Whether the health hazards are a result of one’s genes, childhood, socioeconomic status, social conditions or relations, living conditions or lifestyle, reducing the number of negative impacts is important and challenging. Such an effort involves a variety of sciences and subject matter experts who, through a collaborative team science approach, will help to achieve a fuller understanding of disease and health. Additionally, scientists need to be taught to think spatially, lest the use of GIS, remote sensing and GPS in health research remain limited [189, 190].
The geographical contribution to understanding disease occurrence, causality and spread rests in the relationship between disease distribution and environmental factors. Current technologies support more advanced calculations of environmental risk by including a more complete personal location history (e.g. historical address histories and workplace histories). Ultimately, by applying the use of GPS, genetic sequencing, and personal health sensors, it will be possible to conduct real-time exposure measurements.
For the past decade, climate changes have been an important topic, and some areas have witnessed an average rise in temperature, increased or decreased amounts of rain and more extreme weather phenomena as an indication of the climatic changes. These changes will most certainly affect the incidence and transmission of some diseases, and this can lead to further understanding of the way diseases are affected by climate and lead to more accurate placement of interventions. Vector-borne diseases, in particular, are climate sensitive. The ability to model climate changes can predict new endemic areas of risk and will inform future intervention foci. Along with the climate, human interference results in ongoing environmental changes, and especially in developing countries there is an increased risk of disease enhanced by development activities, demographic changes and the introduction of new products.
Prediction of disease outbreaks can be valuable information in reducing disease spread. Analysis for optimizing the location of health facilities and the utilization of these facilities are common in the research literature, but, as stated by Higgs [76], health outcomes constitute a relevant analysis factor in getting an estimate of the quality delivered by the health facilities, and not just a quantitative measurement. As many studies reveal, distance does have an impact on the accessibility of health facilities. Analysis of the impact of distances to health facilities on health outcomes as well as the efficiency of emergency services and the quality they deliver in relation to emergency response distance/time could provide valuable information for understanding human behaviour in the health care system. This in turn, could possibly lead to new performance indicators for allocating resources and facilities in health care planning. For example, how does accessibility affect utilization and health outcomes, when analysis is based on both public and private transportation? In several major European cities, public transportation is gaining ground as a priority for health promotion and ecological responsibility though reductions in air pollution and carbon footprint. Other aspects of city planning and “health in all policies” approaches to promote health include neighborhood factors that promote walking and running, the design of cities that are suitable for cycling, and noise and air pollution reduction in cities by restructuring traffic.
Temporal analysis tools and illustrations have become more common in GIS software packages and are therefore more easily accessible than previous; they can be applied to understand the effects of health interventions. Evaluating interventions to reduce or prevent disease incidence and prevalence can benefit from temporal analyses of the status of the disease before and after interventions. Analysis of pre-intervention disease status is an essential element in understanding the effect of interventions on disease occurrence both in the short and long term. It must also be noted that modern statistical software packages are getting more and more GIS functionalities, and GIS software packages are being supplemented with statistical functionalities mainly because spatial statistics often make use of different algorithms than traditional statistics applied in other sciences.
Health is not only about disease analysis; it is also about promoting aspects of a healthy lifestyle, such as healthy nutrition and regular physical activity. Often the promotion of healthy nutrition focuses only on making the healthier alternatives accessible, but individuals are still in a position where they can choose between the healthy and unhealthy alternatives. Today, the unhealthy alternatives are often presented as the easiest choice while the healthiest options are seldom placed in a way that makes the rational and healthier choice easy for the customers. Physical activity is proven to be healthy for the metabolism, but as people cannot be forced to exercise, other solutions that encourage physical activity are needed. Many initiatives without a geographic component have been developed to promote physical activity and geo-applications for mobile phones that encourage physical activity through the mapping and measuring of speeds and distances in training sessions are particularly prevalent.
The analysis of all the articles in the category “spatial analysis of disease” revealed that the majority focus on infectious diseases, which has a straightforward explanation as the spread of infections have a natural geographical component. Studies of malaria and schistosomiasis were the most frequently analyzed diseases. Malaria is also the most common cause of death and schistosomiasis – also known as bilharziosis – is a highly contagious disease that leaves the surviving victims with serious disabilities. It is transmitted through freshwater, which is vital to human life. Studies of dengue fever and HIV are represented equally with 25 and 22 studies, and Leishmaniasis was studied in 15 articles. It is noteworthy that four of the five most frequently studied diseases using GIS are spread by pests including three flying insects.
Of the non-infectious diseases, cancer is by far the most frequently studied, with more than twice as many articles than the second most studied, asthma with only 14 studies. It is significant that the studies of infectious diseases predominantly focus on the spread of the diseases and the causes are well known, whereas the studies on non-infectious diseases pursue the etiology of the disease by searching patterns in the prevalence and incidence rates in relation to a geographical component.
An explanation of this finding could be that infectious diseases are a result of an easily identifiable cause (cf. a mosquito), which can be studied relatively easily. When studying non-infectious diseases the level of complexity increases significantly, and is more complicated to follow as they develop through a life spa. Furthermore if effect sizes are small and distributed among variables it can contribute to a publication bias.
The search revealed very few studies on preventive activities and health outcomes via GIS. This might be due to the fact that preventive studies are much different than other health related studies. In general there are much fewer studies on prevention - those studies take a long time if prospective and require a lot of variables if retrospective where geography is just one. In addition outcomes can be difficult and often surrogates are used for the outcomes of interest.
Obtaining accurate and reliable health data can be a lengthy and expensive process. One that is often confounded by privacy and confidentiality requirements which need to be balanced with the need for good quality analysis. Further, exclusion of key data sets due to privacy concerns or data being withheld due to commercial or political issues skews research results. In different countries there are different traditions in the registration of patients, which entails a variety of barriers in geocoding patient records. North European countries have a tradition for registering a large amount of information for every citizen, which potentially allows for easier process in geocoding patient registers if location is included in this plethora of information. In other parts of the world financing issues tends to restrict the availability of accurate databases and the geocoding process will require a lot of time and resources. Some countries have legally limited the data that each individual is permitted to register at a government level, which means that geographical references may not be recorded in patient records in some jurisdictions. Regardless of the problem each country has in geocoding their patient records, consideration for patient confidentiality is an issue when analyzing the data and making results publicly available. This requires the data providers to ensure the data are appropriately aggregated either through legislation or pre-aggregation of the data.
It is well known that health problems are related to a number of social environmental variables such as poverty and other contextual variables, which in many cases are available at some scales of analysis. However we find a great variety in the granularity of the available data. In Scandinavia data are readily available on an individual level, and simple rules for anonymization and ethics are regulating research on these data. In many other countries only very aggregate data are available, and the use of the data can be complicated to get access to due to strict legislation. An elaboration of this discussion would require further studies of various health surveillance data and their sources to point out limitations and benefits.
Despite the advancement of the sophisticated tools for analyzing GIS data, reliable and valid health data will still have to be provided. The primary use of health data is in the clinic where data are recorded and stored for the purpose of delivering health services to the individual. Applying health data in GIS analysis can be considered as secondary use of health data, which raises a number of concerns. Charles Safran et al. reported the outcome of a panel of diverse stakeholders and experts discussing a range of issues related to secondary use of health data [191]. Using health data outside direct health care delivery raises a number of complex ethical, political, technical and social issues. The panel recommended a number of initiatives that could also apply to GIS analysis of health data. Ultimately, the responsibility for ensuring privacy and safeguarding patient data applies to all data users, and when data are attached to a specific location this responsibility is significant. The de-identification and anonymization of data should be addressed in all GIS applications.
After the 2011 limit of the search in this paper there has been two papers reviewing mapping and surveillance of infectious disease [192, 193]. As they have a slightly different aim, they do not give rise to revision of the results and discussion in this paper.
Conclusion
The increasing number of publications related to GIS and health demonstrates the major growth this research area has seen recently. As our proposed framework illustrates, a lot of research has been undertaken to understand disease and health, but as our understanding increases, new questions arise along with the development of new technologies and applications thereof, which further increase the possibilities for measuring, analysing and understanding disease and health. This framework does not specifically cover studies of realized benefits of applying GIS analysis to health related data, hence future studies would be required to investigate outcomes, utility and benefits. Furthermore it might be relevant to perform further in depth studies on specific aspects of which diseases are surveyed on different continents. The framework has found and systematized a large number of recent articles concerning GIS and health, and the complete set of references, is available as supplementary material.
Supplementary Material
Fig. 3.

The number of articles in the four categories in relation to what continent they concerned
References
- 1.Hipocrates, Clifton F, Watts J.Hippocrates upon air, water, and situation: upon epidemical diseases; and upon prognosticks, in acute cases especially. To this is added (by way of comparison) Thucydides’s account of the plague of Athens, the whole translated, methodis’d, and illustrated with useful and explanatory notes. London; Printed for J. Watts; 1734. 389 p. [Google Scholar]
- 2.Barrett FA. Finke’s 1792 map of human diseases: The first world disease map? Soc Sci Med. 2000;50(7-8):915–21. [DOI] [PubMed] [Google Scholar]
- 3.Koch T.Disease Maps: Epidemics on the Ground. Chicago: University of Chicago Press; 2011. [Google Scholar]
- 4.Snow J.On the mode of communication of cholera. London: John Churchill; 1855. [Google Scholar]
- 5.Brooker S, Hotez PJ, Bundy DAP. The global atlas of helminth infection: Mapping the way forward in neglected tropical disease control. PLoS Negl Trop Dis. 2010;4(7). [DOI] [PMC free article] [PubMed] [Google Scholar]
- 6.Smith R.Dartmouth atlas of health care. BMJ 2011;342. [Google Scholar]
- 7.Mackay J, Mensah GA, Mendis S, Greenlund K.The atlas of heart disease and stroke. World Health Organization; 2004. [Google Scholar]
- 8.Barnett E.Men and heart disease: An atlas of racial and ethnic disparities in mortality. CDC, Centers for Disease Control and Prevention; 2001. [Google Scholar]
- 9.Levêque A, Humblet PC, Lagasse R.Atlas of ‘avoidable mortality’ in Belgium 1985-1989. Arch Public Health 1999;57(1-2):1–87. [Google Scholar]
- 10.Lloyd OL, Tze-Wai W, Siu-Lan W, Ignatius YTS. Atlas of disease mortalities in Hong Kong for the three five-year periods in 1979-93. Chinese Univ Pr;1996. [Google Scholar]
- 11.Albrecht J, Ramasubramanian L.The moving target: A geographic index of relative wellbeing. J Med Syst 2004;28(4):371–84. [DOI] [PubMed] [Google Scholar]
- 12.Meade MS, Emch M.Medical geography. The Guilford Press;2010. [Google Scholar]
- 13.Jacquez G.A commentary on the Behavome and Genetic GIS. 2013 Sep 5. In:BioMedware. Blog [Internet]. Available from: http://www.biomedware.com/blog/2013/a-commentary-on-the-behavome-and-genetic-gis/ [Google Scholar]
- 14.Improving the Civilian Global Positioning System (GPS) [Internet]. Washington: Office of Science & Technology Policy; c2000[cited 2012 Apr 19]. Available from: http://clinton4.nara.gov/WH/EOP/OSTP/html/0053_4.html. [Google Scholar]
- 15.Nykiforuk CI, Flaman LM. Geographic information systems (GIS) for health promotion and public health: A review. Health Promot Pract 2011;12(1):63–73. [DOI] [PubMed] [Google Scholar]
- 16.Gatrell A, Senior M.Health and health care applications. Geographical Information Systems: Principles Techniques Management and Applications;2. [Google Scholar]
- 17.Blatt AJ. Maps, geography libraries, and health outcomes: Gazing into the future of medical geography. J Map Geogr Libr 2011;7(1):2–12. [Google Scholar]
- 18.Senkowski A, Colonna M, Bicout D- Inframunicipality distribution of lung cancer in the urban area of Grenoble. Rev Epidemiol Sante Publ 2008;56(5):315–21. [DOI] [PubMed] [Google Scholar]
- 19.Jarup L.Health and environment information systems for exposure and disease mapping, and risk assessment. Environ Health Perspect 2004;112(9):995–7. [DOI] [PMC free article] [PubMed] [Google Scholar]
- 20.Polack S, Brooker S, Kuper H, Mariotti S, Mabey D, Foster A.Mapping the global distribution of trachoma. Bull WHO 2005;83(12):913–9. [PMC free article] [PubMed] [Google Scholar]
- 21.Wright Willis A, Evanoff BA, Lian M, Criswell SR, Racette BA. Geographic and ethnic variation in Parkinson disease: A population-based study of us Medicare beneficiaries. Neuroepidemiology 2010;34(3):143–51. [DOI] [PMC free article] [PubMed] [Google Scholar]
- 22.Peng ZH, Cheng YJ, Reilly KH, Wang L, Qin QQ, Ding ZW, et al. Spatial distribution of HIV/AIDS in Yunnan province, People’s Republic of China. Geospatial Health 2011;5(2):177–82. [DOI] [PubMed] [Google Scholar]
- 23.Murad AA. Creating a GIS-based epidemiological application for Jeddah city. Int J Healthc Technol Manage 2008;9(5-6):540–51. [Google Scholar]
- 24.Walsh SJ, Dechello LM. Geographical variation in mortality from systemic lupus erythematosus in the United States. Lupus. 2001;10(9):637–46. [DOI] [PubMed] [Google Scholar]
- 25.Jeefoo P, Tripathi NK, Souris M.Spatio-temporal diffusion pattern and hotspot detection of dengue in Chachoengsao province, Thailand. Int J Environ Res Public Health 2011;8(1):51–74. [DOI] [PMC free article] [PubMed] [Google Scholar]
- 26.Tiwari N, Adhikari CMS, Tewari A, Kandpal V.Investigation of geo-spatial hotspots for the occurrence of tuberculosis in Almora district, India, using GIS and spatial scan statistic. Int J Health Geogr 2006;5. [DOI] [PMC free article] [PubMed] [Google Scholar]
- 27.Zuo SQ, Fang LQ, Zhan L, Zhang PH, Jiang JF, Wang LP, et al. Geo-spatial hotspots of haemorrhagic fever with renal syndrome and genetic characterization of Seoul variants in Beijing, China. PLoS Negl Trop Dis 2011;5(1). [DOI] [PMC free article] [PubMed] [Google Scholar]
- 28.Srivastava A, Nagpal BN, Joshi PL, Paliwal JC, Dash AP. Identification of malaria hot spots for focused intervention in tribal state of India: A GIS based approach. Int J Health Geogr 2009;8(1). [DOI] [PMC free article] [PubMed] [Google Scholar]
- 29.Murray EJ, Marais BJ, Mans G, Beyers N, Ayles H, Godfrey-Faussett P, et al. A multidisciplinary method to map potential tuberculosis transmission ‘hot spots’ in high-burden communities. Int J Tuberc Lung Dis 2009;13(6):767–74. [PubMed] [Google Scholar]
- 30.Lee SS, Wong NS. The clustering and transmission dynamics of pandemic influenza A (H1N1) 2009 cases in Hong Kong. J Infect 2011;63(4):274–80. [DOI] [PubMed] [Google Scholar]
- 31.Sui DZ. Tobler’s first law of geography: A big idea for a small world? Ann Assoc Am Geogr 2004;94(2):269–77. [Google Scholar]
- 32.Jarup L, Best N, Toledano MB, Wakefield J, Elliott P.Geographical epidemiology of prostate cancer in Great Britain. Int J Cancer 2002;97(5):695–9. [DOI] [PubMed] [Google Scholar]
- 33.Fischer EAJ, Pahan D, Chowdhury SK, Richardus JH. The spatial distribution of leprosy cases during 15 years of a leprosy control program in Bangladesh: An observational study. BMC Infect Dis 2008;8. [DOI] [PMC free article] [PubMed] [Google Scholar]
- 34.Wilhelm M, Meng Y-, Rull RP, English P, Balmes J, Ritz B.Environmental public health tracking of chidhood asthma using California health interview survey, traffic, and outdoor air pollution data. Environ Health Perspect 2008;116(9):1254–60. [DOI] [PMC free article] [PubMed] [Google Scholar]
- 35.Nuvolone D, Maggiore RD, Maio S, Fresco R, Baldacci S, Carrozzi L, et al. Geographical information system and environmental epidemiology: A cross-sectional spatial analysis of the effects of traffic-related air pollution on population respiratory health. Environ Health Global Access Sci Sour 2011;10(1). [DOI] [PMC free article] [PubMed] [Google Scholar]
- 36.Wang Y, Gulliver J, McHugh C.In:Modeling the health impacts of air pollution exposures in London within the GENESIS system. 2011 international symposium on water resource and environmental protection, ISWREP 2011; 20 May 2011 through 22 May 2011; Xi’an; 2011. p. 2341–4. [Google Scholar]
- 37.Lindgren A, Stroh E, Montnémery P, Nihlén U, Jakobsson K, Axmon A.Traffic-related air pollution associated with prevalence of asthma and COPD/chronic bronchitis. A cross-sectional study in southern Sweden. Int J Health Geogr 2009;8(1). [DOI] [PMC free article] [PubMed] [Google Scholar]
- 38.Jerrett M, Finkelstein MM, Brook JR, Arain MA, Kanaroglou P, Stieb DM, et al. A cohort study of traffic-related air pollution and mortality in Toronto, Ontario, Canada. Environ Health Perspect 2009;117(5):772–7. [DOI] [PMC free article] [PubMed] [Google Scholar]
- 39.Gilboa SM, Mendola P, Olshan AF, Harness C, Loomis D, Langlois PH, et al. Comparison of residential geocoding methods in population-based study of air quality and birth defects. Environ Res 2006;101(2):256–62. [DOI] [PubMed] [Google Scholar]
- 40.Nyberg F, Gustavsson P, Järup L, Bellander T, Berglind N, Jakobsson R, et al. Urban air pollution and lung cancer in Stockholm. Epidemiology 2000;11(5):487–95. [DOI] [PubMed] [Google Scholar]
- 41.Chellini E, Cherubini M, Chetoni L, Seniori Costantini A, Biggeri A, Vannucchi G.Risk of respiratory cancer around a sewage plant in Prato, Italy. Arch Environ Health 2002;57(6):548–53. [DOI] [PubMed] [Google Scholar]
- 42.Goovaerts P, Jacquez GM. Detection of temporal changes in the spatial distribution of cancer rates using local Moran’s I and geostatistically simulated spatial neutral models. J Geogr Syst 2005;7(1):137–59. [DOI] [PMC free article] [PubMed] [Google Scholar]
- 43.Greiling DA, Jacquez GM, Kaufmann AM, Rommel RG. Space-time visualization and analysis in the cancer atlas viewer. J Geogr Syst. 2005;7(1):67–84. [DOI] [PMC free article] [PubMed] [Google Scholar]
- 44.Biggeri A, Catelan D, Dreassi E.The epidemic of lung cancer in Tuscany (Italy): A joint analysis of male and female mortality by birth cohort. Spat Spatio-temporal Epidemiol 2009;1(1):31–40. [DOI] [PubMed] [Google Scholar]
- 45.Horst MA, Coco AS. Observing the spread of common illnesses through a community: Using geographic information systems (GIS) for surveillance. J Am Board Fam Med 2010;23(1):32–41. [DOI] [PubMed] [Google Scholar]
- 46.Hu W, Clements A, Williams G, Tong S.Spatial analysis of notified dengue fever infections. Epidemiol Infect 2011;139(3):391–9. [DOI] [PubMed] [Google Scholar]
- 47.Emch M, Feldacker C, Sirajul SM, Ali M.Seasonality of cholera from 1974 to 2005: A review of global patterns. Int J Health Geogr 2008;7. [DOI] [PMC free article] [PubMed] [Google Scholar]
- 48.Wagner SE, Burch JB, Bottai M, Puett R, Porter D, Bolick-Aldrich S, et al. Groundwater uranium and cancer incidence in south Carolina. Cancer Causes Control 2011;22(1):41–50. [DOI] [PMC free article] [PubMed] [Google Scholar]
- 49.Beyer KMM, Comstock S, Seagren R.Disease maps as context for community mapping: A methodological approach for linking confidential health information with local geographical knowledge for community health research. J Community Health 2010;35(6):635–44. [DOI] [PubMed] [Google Scholar]
- 50.GPHIN [Internet]. Ottawa: Health Canada; c2003[archived 2013 Jun 24; cited 2012 Apr 19]. Available from: http://www.hc-sc.gc.ca/ahc-asc/pubs/_intactiv/gphin-rmisp/index-eng.php [Google Scholar]
- 51.HealthMap [Internet]. Boston: Harvard Medical School; c2006-2013[cited 2012 Apr 19]. Available from: http://healthmap.org/en/ [Google Scholar]
- 52.Biocaster [Internet]. The Biocaster Project; c2006-2011[cited 2012 Apr 19]. Available from: http://born.nii.ac.jp/ [Google Scholar]
- 53.Fleming G, Merwe Mvd, McFerren G.Fuzzy expert systems and GIS for cholera health risk prediction in southern Africa. Environ Model Softw 2007;22(4):442–8. [Google Scholar]
- 54.Lewis MD, Pavlin JA, Mansfield JL, O’Brien S, Boomsma LG, Elbert Y, et al. Disease outbreak detection system using syndromic data in the greater Washington DC area. Am J Prev Med 2002;23(3):180–6. [DOI] [PubMed] [Google Scholar]
- 55.Guo JG, Vounatsou P, Cao CL, Utzinger J, Zhu HQ, Anderegg D, et al. A geographic information and remote sensing based model for prediction of oncomelania hupensis habitats in the Poyang Lake area, China. Acta Trop 2005;96(2-3):213–22. [DOI] [PubMed] [Google Scholar]
- 56.Ombok M, Adazu K, Odhiambo F, Bayoh N, Kiriinya R, Slutsker L, et al. Geospatial distribution and determinants of child mortality in rural western Kenya 2002-2005. Trop Med Int Health 2010;15(4):423–33. [DOI] [PubMed] [Google Scholar]
- 57.Wu P-, Lay J-, Guo H-, Lin C-, Lung S-, Su H- Higher temperature and urbanization affect the spatial patterns of dengue fever transmission in subtropical Taiwan. Sci Total Environ 2009;407(7):2224–33. [DOI] [PubMed] [Google Scholar]
- 58.Yang G-, Vounatsou P, Zhou X-, Utzinger J, Tanner M.A review of geographic information system and remote sensing with applications to the epidemiology and control of schistosomiasis in China. Acta Trop 2005;96(2-3):117–29. [DOI] [PubMed] [Google Scholar]
- 59.Nakaya T, Nakase K, Osaka K.Spatio-temporal modelling of the HIV epidemic in Japan based on the national HIV/AIDS surveillance. J Geogr Syst 2005;7(3-4):313–36. [Google Scholar]
- 60.Khormi HM, Kumar L.Modeling dengue fever risk based on socioeconomic parameters, nationality and age groups: GIS and remote sensing based case study. Sci Total Environ 2011;409(22):4713–9. [DOI] [PubMed] [Google Scholar]
- 61.Møller-Jensen L.KRY. Exploiting available data sources: Location/allocation modeling for health service planning in rural Ghana. Geogr Tidsskr 2001;101:145–53. [Google Scholar]
- 62.Rahman S-, Smith DK. Use of location-allocation models in health service development planning in developing nations. Eur J Oper Res 2000;123(3):437–52. [Google Scholar]
- 63.Schuurman N, Fiedler RS, Grzybowski SCW, Grund D.Defining rational hospital catchments for non-urban areas based on travel-time. Int J Health Geogr 2006;5. [DOI] [PMC free article] [PubMed] [Google Scholar]
- 64.Farahani RZ, Hekmatfar M.Facility location - concepts, models, algorithms and case studies. Heidelberg: Physica-verlag - A Springer Company; 2009. [Google Scholar]
- 65.Shortt NK, Moore A, Coombes M, Wymer C.Defining regions for locality health care planning: A multidimensional approach. Soc Sci Med 2005;60(12):2715–27. [DOI] [PubMed] [Google Scholar]
- 66.Murad AA. Creating a geographical information systems-based spatial profile for exploring health services supply and demand. Am J Appl Sci 2011;8(6):644–51. [Google Scholar]
- 67.Klauss G, Staub L, Widmer M, Busato A.Hospital service areas - A new tool for health care planning in Switzerland. BMC Health Serv Res 2005;5. [DOI] [PMC free article] [PubMed] [Google Scholar]
- 68.Ong MEH, Tan EH, Yan X, Anushia P, Lim SH, Leong BS, et al. An observational study describing the geographic-time distribution of cardiac arrests in Singapore: What is the utility of geographic information systems for planning public access defibrillation? (PADS phase I). Resuscitation 2008;76(3):388–96. [DOI] [PubMed] [Google Scholar]
- 69.Sasaki S, Comber AJ, Suzuki H, Brunsdon C.Using genetic algorithms to optimise current and future health planning - the example of ambulance locations. Int J Health Geogr 2010;9. [DOI] [PMC free article] [PubMed] [Google Scholar]
- 70.Schuurman N, Bell NJ, L’Heureux R, Hameed SM. Modelling optimal location for pre-hospital helicopter emergency medical services. BMC Emerg Med 2009;9. [DOI] [PMC free article] [PubMed] [Google Scholar]
- 71.Gudes O, Pathak V, Kendall E, Yigitcanlar T.Thinking spatially, acting collaboratively: A GIS-based health decision support system for improving the collaborative health-planning practice. International conference on health informatics, HEALTHINF; 2011; 26 January 2011 through 29 January 2011; Rome; 2011 p. 148–55. [Google Scholar]
- 72.Gudes O, Kendall E, Yigitcanlar T, Pathak V, Baum S.Rethinking health planning: A framework for organising information to underpin collaborative health planning. Health Inf Manage 2010;39(2):18–29. [DOI] [PubMed] [Google Scholar]
- 73.Houghton F.Reflections on the science and art1 of using a GIS to locate a new national children’s hospital in Ireland. Ir Geogr 2009;42(2):245–52. [Google Scholar]
- 74.Lwasa S.Geospatial analysis and decision support for health services planning in Uganda. Geospat Health 2007;2(1):29–40. [DOI] [PubMed] [Google Scholar]
- 75.Brabyn L, Beere P.Population access to hospital emergency departments and the impacts of health reform in New Zealand. Health Informatics J 2006;12(3):227–37. [DOI] [PubMed] [Google Scholar]
- 76.Higgs G.The role of GIS for health utilization studies: Literature review. Health Serv Outcomes Res Methodol 2009;9(2):84–99. [Google Scholar]
- 77.Arcury TA, Gesler WM, Preisser JS, Sherman J, Spencer J, Perin J.The effects of geography and spatial behavior on health care utilization among the residents of a rural region. Health Serv Res 2005;40(1):135–55. [DOI] [PMC free article] [PubMed] [Google Scholar]
- 78.Chang Y-, Wen T-, Lai M- Using geographic information systems (GIS) to identify the association between geographic accessibility and hospital-seeking behavior by hepatocellular carcinoma patients in Taiwan. Taiwan J Public Health 2009;28(6):517–29. [Google Scholar]
- 79.Brual J, Gravely-Witte S, Suskin N, Stewart DE, Macpherson A, Grace SL. Drive time to cardiac rehabilitation: At what point does it affect utilization? Int J Health Geogr 2010;9. [DOI] [PMC free article] [PubMed] [Google Scholar]
- 80.Lee JE, Sung JH, Ward WB, Fos PJ, Lee WJ, Kim JC. Utilization of the emergency room: Impact of geographic distance. Geospat Health 2007;1(2):243–53. [DOI] [PubMed] [Google Scholar]
- 81.Leung YW, Brual J, Macpherson A, Grace SL. Geographic issues in cardiac rehabilitation utilization: A narrative review. Health Place 2010;16(6):1196–205. [DOI] [PMC free article] [PubMed] [Google Scholar]
- 82.Zulian G, Donisi V, Secco G, Pertile R, Tansella M, Amaddeo F.How are caseload and service utilization of psychiatric services influenced by distance? A geographical approach to the study of community-based mental health services. Soc Psychiatry Psychiatr Epidemiol 2011;46(9):881–91. [DOI] [PubMed] [Google Scholar]
- 83.Henneman PL, Garb JL, Capraro GA, Li H, Smithline HA, Wait RB. Geography and travel distance impact emergency department visits. J Emerg Med 2011;40(3):333–9. [DOI] [PubMed] [Google Scholar]
- 83.Brabyn L, Gower P.Comparing three GIS techniques for modelling geographical access to general practitioners. Cartographica. 2004;39(2):41–50. [Google Scholar]
- 84.Fortney J, Rost K, Warren J.Comparing alternative methods of measuring geographic access to health services. Health Serv Outcomes Res Methodol 2000;1(2):173–84. [Google Scholar]
- 85.Yang D-, Goerge R, Mullner R.Comparing GIS-based methods of measuring spatial accessibility to health services. J Med Syst 2006;30(1):23–32. [DOI] [PubMed] [Google Scholar]
- 86.Luo W, Qi Y.An enhanced two-step floating catchment area (E2SFCA) method for measuring spatial accessibility to primary care physicians. Health Place 2009;15(4):1100–7. [DOI] [PubMed] [Google Scholar]
- 87.McGrail MR, Humphreys JS. Measuring spatial accessibility to primary care in rural areas: Improving the effectiveness of the two-step floating catchment area method. Appl Geogr 2009;29(4):533–41. [Google Scholar]
- 88.Spencer J, Angeles G.Kernel density estimation as a technique for assessing availability of health services in Nicaragua. Health Serv Outcomes Res Methodol 2007;7(3-4):145–57. [Google Scholar]
- 89.Loh C-A, Cobb SC, Johnson CK. Potential and actual accessibility to hospital and hospital services in northeast Florida. Southeast Geogr 2009;49(2):171–84. [Google Scholar]
- 90.Higgs G.A literature review of the use of GIS-based measures of access to health care services. Health Serv Outcomes Res Methodol 2004;5(2):119–39. [Google Scholar]
- 91.Acharya AB, Nyirenda JC, Higgs GB, Bloomfield MS, Cruz-Flores S, Connor LT, et al. Distance from home to hospital and thrombolytic utilization for acute ischemic stroke. J Stroke Cerebrovasc Dis 2011;20(4):295–301. [DOI] [PubMed] [Google Scholar]
- 92.Simões PP, Almeida RMVR. Geographic accessibility to obstetric care and maternal mortality in a large metropolitan area of Brazil. Int J Gynecol Obstet 2011;112(1):25–9. [DOI] [PubMed] [Google Scholar]
- 93.Cudnik MT, Schmicker RH, Vaillancourt C, Newgard CD, Christenson JM, Davis DP, et al. A geospatial assessment of transport distance and survival to discharge in out of hospital cardiac arrest patients: Implications for resuscitation centers. Resuscitation 2010;81(5):518–23. [DOI] [PMC free article] [PubMed] [Google Scholar]
- 94.Yamashita T, Kunkel SR. The association between heart disease mortality and geographic access to hospitals: County level comparisons in Ohio, USA. Soc Sci Med 2010;70(8):1211–8. [DOI] [PubMed] [Google Scholar]
- 95.Jones AP, Haynes R, Sauerzapf V, Crawford SM, Zhao H, Forman D.Travel times to health care and survival from cancers in northern England. Eur J Cancer 2008;44(2):269–74. [DOI] [PubMed] [Google Scholar]
- 96.Pedigo AS, Odoi A.Investigation of disparities in geographic accessibility to emergency stroke and myocardial infarction care in east Tennessee using geographic information systems and network analysis. Ann Epidemiol 2010;20(12):924–30. [DOI] [PubMed] [Google Scholar]
- 97.Susi L, Mascarenhas AK. Using a geographical information system to map the distribution of dentists in Ohio. J Am Dent Assoc 2002;133(5):636–42. [DOI] [PubMed] [Google Scholar]
- 98.Clark RA, Driscoll A, Nottage J, McLennan S, Coombe DM, Bamford EJ, et al. Inequitable provision of optimal services for patients with chronic heart failure: A national geo-mapping study. Med J Aust 2007;186(4):169–73. [DOI] [PubMed] [Google Scholar]
- 99.Stuart B, Hinde A.Accessing genitourinary medicine clinics: Does it matter where you live? J Fam Plann Reprod Health Care 2011;37(3):152–7. [DOI] [PubMed] [Google Scholar]
- 100.White P, James V, Ansell D, Lodhi V, Donovan KL. Equity of access to dialysis facilities in Wales. QJM 2006;99(7):445–52. [DOI] [PubMed] [Google Scholar]
- 101.Dai D.Black residential segregation, disparities in spatial access to health care facilities, and late-stage breast cancer diagnosis in metropolitan Detroit. Health Place 2010;16(5):1038–52. [DOI] [PubMed] [Google Scholar]
- 102.Fulcher CL, Kaukinen CE. Visualizing the infrastructure of US healthcare using internet GIS: A community health informatics approach for reducing health disparities. Medinfo 2004;11(Pt 2):1197–201. [PubMed] [Google Scholar]
- 103.Committee for the Study of the Future of Public Health. The Future of Public Health. Washington: National Academy Press; 1988. 225 p. [Google Scholar]
- 104.Alcaraz KI, Kreuter MW, Bryan RP. Use of GIS to identify optimal settings for cancer prevention and control in African American communities. Prev Med 2009;49(1):54–7. [DOI] [PMC free article] [PubMed] [Google Scholar]
- 105.Miner JW, White A, Lubenow AE, Palmer S.Geocoding and social marketing in Alabama’s cancer prevention programs. Prev Chronic Dis. 2005;2Spec no. [PMC free article] [PubMed] [Google Scholar]
- 106.Renger R, Cimetta A, Pettygrove S, Rogan S.Geographic information systems (GIS) as an evaluation tool. Am J Eval 2002;23(4):469–79. [Google Scholar]
- 107.Gikandi PW, Noor AM, Gitonga CW, Ajanga AA, Snow RW. Access and barriers to measures targeted to prevent malaria in pregnancy in rural Kenya. Trop Med Int Health 2008;13(2):208–17. [DOI] [PMC free article] [PubMed] [Google Scholar]
- 108.Merbitz H, Buttstädt M, Michael S, Dott W, Schneider C.GIS-based identification of spatial variables enhancing heat and poor air quality in urban areas. Appl Geogr 2012;33:94–106. [Google Scholar]
- 109.Kim BJ, Kwon JW, Seo JH, Kim HB, Lee SY, Park KS, et al. Association of ozone exposure with asthma, allergic rhinitis, and allergic sensitization. Ann Allergy Asthma Immunol 2011;107(3):214–9. [DOI] [PubMed] [Google Scholar]
- 110.Puett RC, Hart JE, Yanosky JD, Paciorek C, Schwartz J, Suh H, et al. Chronic fine and coarse particulate exposure, mortality, and coronary heart disease in the nurses’ health study. Environ Health Perspect 2009;117(11):1697–701. [DOI] [PMC free article] [PubMed] [Google Scholar]
- 111.Isakov V, Touma JS, Burke J, Lobdell DT, Palma T, Rosenbaum A, et al. Combining regional- and local-scale air quality models with exposure models for use in environmental health studies. J Air Waste Manage Assoc 2009;59(4):461–72. [DOI] [PubMed] [Google Scholar]
- 112.Vivier PM, Hauptman M, Weitzen SH, Bell S, Quilliam DN, Logan JR. The important health impact of where a child lives: Neighborhood characteristics and the burden of lead poisoning. Matern Child Health J 2010:1–8. [DOI] [PMC free article] [PubMed] [Google Scholar]
- 113.Roberts JR, Hulsey TC, Curtis GB, Reigart JR. Using geographic information systems to assess risk for elevated blood lead levels in children. Public Health Rep 2003;118(3):221–9. [DOI] [PMC free article] [PubMed] [Google Scholar]
- 114.Oyana TJ, Margai FM. Geographic analysis of health risks of pediatric lead exposure: A golden opportunity to promote healthy neighborhoods. Archiv Environ Occup Health 2007;62(2):93–104. [DOI] [PubMed] [Google Scholar]
- 115.Miranda ML, Dolinoy DC, Overstreet MA. Mapping for prevention: GIS models for directing childhood lead poisoning prevention programs. Environ Health Perspect 2002;110(9):947–53. [DOI] [PMC free article] [PubMed] [Google Scholar]
- 116.Wartenberg D.Screening for lead exposure using a geographic information system. Environ Res 1992;59(2):310–7. [DOI] [PubMed] [Google Scholar]
- 117.Reissman DB, Staley F, Curtis GB, Kaufmann RB. Use of geographic information system technology to aid health department decision making about childhood lead poisoning prevention activities. Environ Health Perspect 2001;109(1):89–94. [DOI] [PMC free article] [PubMed] [Google Scholar]
- 118.Reif JS, Burch JB, Nuckols JR, Metzger L, Ellington D, Anger WK. Neurobehavioral effects of exposure to trichloroethylene through a municipal water supply. Environ Res 2003;93(3):248–58. [DOI] [PubMed] [Google Scholar]
- 119.Swartz CH, Rudel RA, Kachajian JR, Brody JG. Historical reconstruction of wastewater and land use impacts to groundwater used for public drinking water: Exposure assessment using chemical data and GIS. J Expo Anal Environ Epidemiol 2003;13(5):403–16. [DOI] [PubMed] [Google Scholar]
- 120.Ghosh S, Dasgupta A, Ghosh SK. In:A geospatial framework for mapping of electromagnetic radiations. 2nd international conference on computing for geospatial research and applications, COM.geo2011; 23 May 2011 through 25 May 2011; Washington, DC; 2011. [Google Scholar]
- 121.Burch JB, Clark M, Yost MG, Fitzpatrick CTE, Bachand AM, Ramaprasad J, et al. Radio frequency nonionizing radiation in a community exposed to radio and television broadcasting. Environ Health Perspect 2006;114(2):248–53. [DOI] [PMC free article] [PubMed] [Google Scholar]
- 122.Quindós Poncela LS, Fernández PL, Gómez Arozamena J, Sainz C, Fernández JA, Suarez Mahou E, et al. Natural gamma radiation map (MARNA) and indoor radon levels in Spain. Environ Int 2004;29(8):1091–6. [DOI] [PubMed] [Google Scholar]
- 123.Tondel M, Lindgren P, Hellström L, Löfman O, Fredrikson M.Risk of malignancies in relation to terrestrial gamma radiation in a Swedish population cohort. Sci Total Environ 2011;409(3):471–7. [DOI] [PubMed] [Google Scholar]
- 124.Ha M, Im H, Lee M, Kim HJ, Kim B-, Gimm Y-, et al. Radio-frequency radiation exposure from AM radio transmitters and childhood leukemia and brain cancer. Am J Epidemiol 2007;166(3):270–9. [DOI] [PubMed] [Google Scholar]
- 125.Wartenberg D, Greenberg M, Lathrop R.Identification and characterization of populations living near high-voltage transmission lines: A pilot study. Environ Health Perspect. 1993;101(7):626–32. [DOI] [PMC free article] [PubMed] [Google Scholar]
- 126.Rinner C, Patychuk D, Bassil K, Nasr S, Gower S, Campbell M.The role of maps in neighborhood-level heat vulnerability assessment for the city of Toronto. Cartogr Geogr Inf Sci 2010;37(1):31–44. [Google Scholar]
- 127.Johnson DP, Wilson JS, Luber GC. Socioeconomic indicators of heat-related health risk supplemented with remotely sensed data. Int J Health Geogr 2009;8:57. [DOI] [PMC free article] [PubMed] [Google Scholar]
- 128.Luber G, McGeehin M.Climate change and extreme heat events. Am J Prev Med 2008;35(5):429–35. [DOI] [PubMed] [Google Scholar]
- 129.Wu PC, Lin CY, Lung SC, Guo HR, Chou CH, Su HJ. Cardiovascular mortality during heat and cold events: Determinants of regional vulnerability in Taiwan. Occup Environ Med 2011;68(7):525–30. [DOI] [PubMed] [Google Scholar]
- 130.Cheng AC, Jacups SP, Gal D, Mayo M, Currie BJ. Extreme weather events and environmental contamination are associated with case-clusters of melioidosis in the northern territory of Australia. Int J Epidemio. 2006;35(2):323–9. [DOI] [PubMed] [Google Scholar]
- 131.Zhou XN, Yang K, Hong QB, Sun LP, Yang GJ, Liang YS, et al. Prediction of the impact of climate warming on transmission of schistosomiasis in china. Zhongguo Ji Sheng Chong Xue Yu Ji Sheng Chong Bing Za Zhi 2004;22(5):262–5. [PubMed] [Google Scholar]
- 132.Seong JC, Park TH, Ko JH, Chang SI, Kim M, Holt JB, et al. Modeling of road traffic noise and estimated human exposure in Fulton county, Georgia, USA. Environ Int 2011;37(8):1336–41. [DOI] [PubMed] [Google Scholar]
- 133.Mafizur R, Mahmood HASM, Rumana A.Noise pollution modeling of Dhaka city using GIS. J Global Environ Eng 2011;16:19–24. [Google Scholar]
- 134.Murphy E, King EA, Rice HJ. Estimating human exposure to transport noise in central Dublin, Ireland. Environ Int 2009;35(2):298–302. [DOI] [PubMed] [Google Scholar]
- 135.Aspuru I, Vázquez M, Eguiguren JL, Tellado N.In:Nilson A., Boden H., editors.Environmental noise management system. integrated answer to the directive for urban noise management from GIS technologies and interim calculation methods. Proceedings of the tenth international congress on sound and vibration; 7 July 2003 through 10 July 2003; Stockholm; 2003. p. 2663–70. [Google Scholar]
- 136.Brink M.Parameters of well-being and subjective health and their relationship with residential traffic noise exposure - A representative evaluation in Switzerland. Environ Int 2011;37(4):723–33. [DOI] [PubMed] [Google Scholar]
- 137.Eriksson C, Bluhm G, Hilding A, Östenson C-, Pershagen G.Aircraft noise and incidence of hypertension-gender specific effects. Environ Res. 2010;110(8):764–72. [DOI] [PubMed] [Google Scholar]
- 138.Eriksson C, Rosenlund M, Pershagen G, Hilding A, Östenson C-, Bluhm G.Aircraft noise and incidence of hypertension. Epidemiology 2007;18(6):716–21. [DOI] [PubMed] [Google Scholar]
- 139.Bodin T, Albin M, Ardö J, Stroh E, Stergren P-, Björk J. Road traffic noise and hypertension: Results from a cross-sectional public health survey in southern Sweden. Environ Health Global Access Sci Sour 2009;8(1). [DOI] [PMC free article] [PubMed] [Google Scholar]
- 140.Björk J, Ardö J, Stroh E, Lövkvist H, Östergren P-, Albin M.Road traffic noise in southern Sweden and its relation to annoyance, disturbance of daily activities and health. Scand J Work Environ Health 2006;32(5):392–401. [DOI] [PubMed] [Google Scholar]
- 141.Gundogdu IB. Applying linear analysis methods to GIS-supported procedures for preventing traffic accidents: Case study of Konya. Saf Sci 2010;48(6):763–9. [Google Scholar]
- 142.Ziari H, Khabiri MM. Applied GIS software for improving pedestrian & bicycle safety. Transport 2005;20(4):160–4. [Google Scholar]
- 143.Híjar M, Trostle J, Bronfman M.Pedestrian injuries in Mexico: A multi-method approach. Soc Sci Med 2003;57(11):2149–59. [DOI] [PubMed] [Google Scholar]
- 144.Zhang W, Chen Q, McCubbin H, McCubbin L, Foley S.Predictors of mental and physical health: Individual and neighborhood levels of education, social well-being, and ethnicity. Health Place. 2011;17(1):238–47. [DOI] [PubMed] [Google Scholar]
- 145.Prociow PA, Crowe JA. Towards personalised ambient monitoring of mental health via mobile technologies. Technol Health Care 2010;18(4-5):275–84. [DOI] [PubMed] [Google Scholar]
- 146.Lu X.In:Web GIS based information visualization for infectious disease prevention. 3rd international symposium on intelligent information technology application, IITA2009; 21 November 2009 through 22 November 2009; NanChang; 2009. p. 148–51. [Google Scholar]
- 147.Bonet M, Spiegel JM, Ibarra AM, Kouri G, Pintre Lic A, Yassi A.An integrated ecosystem approach for sustainable prevention and control of dengue in central Havana. Int J Occup Environ Health 2007;13(2):188–94. [DOI] [PubMed] [Google Scholar]
- 148.De Souza Dias MCF, Dias GH, Nobre ML. The use of geographical information system (GIS) to improve active leprosy case finding campaigns in the municipality of Mossoro, riot Grande do note state, Brazil. Lepr Rev 2007;78(3):261–9. [PubMed] [Google Scholar]
- 149.Ulugtekin N, Alkoy S, Seker DZ. Use of a geographic information system in an epidemiological study in measles in Istanbul. J Int Med Res 2007;35(1):150–4. [DOI] [PubMed] [Google Scholar]
- 150.Kamiya M, Trinipil Lagapa J, Oku Y.Research on targeting sources of alveolar echinococcosis in Japan. Comp Immunol Microbiol Infect Dis 2007;30(5-6):427–48. [DOI] [PubMed] [Google Scholar]
- 151.Ali M, Emch M, Donnay JP, Yunus M, Sack RB. Identifying environmental risk factors for endemic cholera: A raster GIS approach. Health Place 2002;8(3):201–10. [DOI] [PubMed] [Google Scholar]
- 152.Kligerman M, Sallis JF, Ryan S, Frank LD, Nader PR. Association of neighborhood design and recreation environment variables with physical activity and body mass index in adolescents. Am J Health Promot 2007;21(4):274–7. [DOI] [PubMed] [Google Scholar]
- 153.Leslie E, Coffee N, Frank L, Owen N, Bauman A, Hugo G.Walkability of local communities: Using geographic information systems to objectively assess relevant environmental attributes. Health Place 2007;13(1):111–22. [DOI] [PubMed] [Google Scholar]
- 154.Moudon AV, Lee C, Cheadle AD, Garvin C, Johnson DB, Schmid TL, et al. Attributes of environments supporting walking. Am J Health Promot 2007;21(5):448–59. [DOI] [PubMed] [Google Scholar]
- 155.Wang Z, Lee C.Site and neighborhood environments for walking among older adults. Health Place 2010;16(6):1268–79. [DOI] [PubMed] [Google Scholar]
- 156.Owen N, Cerin E, Leslie E, duToit L, Coffee N, Frank LD, et al. Neighborhood walkability and the walking behavior of Australian adults. Am J Prev Med 2007;33(5):387–95. [DOI] [PubMed] [Google Scholar]
- 157.Hansen W, Kalapasev N, Gillespie A, Singler M, Ball M.Development of a pedestrian walkability database of northern Kentucky using geographic information systems (GIS). J Phys Act Health 2009;6(3):374–85. [DOI] [PubMed] [Google Scholar]
- 158.Duncan MJ, Badland HM, Mummery WK. Applying GPS to enhance understanding of transport-related physical activity. J Sci Med in Sport 2009;12(5):549–56. [DOI] [PubMed] [Google Scholar]
- 159.Meusel D, Ruiz JR, Ortega FB, Hagströmer M, Bergman P, Sjöström M. Assessing levels of physical activity in the European population - the ALPHA project. Seleccion 2007;16(1):9–12. [Google Scholar]
- 160.Davey RC, Cochrane T, Gidlow C, Fairburn J, Smith G.Design of a pragmatic cluster randomised controlled trial: Ecological approach to increasing physical activity in an urban community. Contemp Clin Trials 2008;29(5):774–82. [DOI] [PubMed] [Google Scholar]
- 161.Moore S, Kestens Y.Neighborhood environmental correlates of perceived park proximity in Montreal. Can J Public Health 2011;102(3):176–9. [DOI] [PMC free article] [PubMed] [Google Scholar]
- 162.Dill J.Bicycling for transportation and health: The role of infrastructure. J Public Health Policy 2009;30(SUPPL. 1):S95–S110. [DOI] [PubMed] [Google Scholar]
- 163.Liu GC, Wilson JS, Qi R, Ying J.Green neighborhoods, food retail and childhood overweight: Differences by population density. Am J Health Promot 2007;21(4 SUPPL.):317–25. [DOI] [PubMed] [Google Scholar]
- 164.Kestens Y, Daniel M.Social inequalities in food exposure around schools in an urban area. Am J Prev Med 2010;39(1):33–40. [DOI] [PubMed] [Google Scholar]
- 165.Wang MC, Kim S, Gonzalez AA, MacLeod KE, Winkleby MA. Socioeconomic and food-related physical characteristics of the neighborhood environment are associated with body mass index. J Epidemiol Community Health 2007;61(6):491–8. [DOI] [PMC free article] [PubMed] [Google Scholar]
- 166.French SA, Story M, Jeffery RW. Environmental influences on eating and physical activity; 2001[cited 2 November 2011]. [DOI] [PubMed] [Google Scholar]
- 167.Agarwal PK, Bowman R, Courtright P.Child eye health tertiary facilities in Africa. J AAPOS 2010;14(3):263–6. [DOI] [PubMed] [Google Scholar]
- 168.Bersamin M, Todd M, Remer L.Does distance matter? access to family planning clinics and adolescent sexual behaviors. Matern Child Health J 2011;15(5):652–9. [DOI] [PMC free article] [PubMed] [Google Scholar]
- 169.Duczmal LH, Moreira GJP, Burgarelli D, Takahashi RHC, Magalhães FCO, Bodevan EC. Voronoi distance based prospective space-time scans for point data sets: A dengue fever cluster analysis in a southeast Brazilian town. Int J Health Geogr 2011;10. [DOI] [PMC free article] [PubMed] [Google Scholar]
- 170.Gabrysch S, Cousens S, Cox J, Campbell OMR. The influence of distance and level of care on delivery place in rural Zambia: A study of linked national data in a geographic information system. PLoS Med 2011;8(1). [DOI] [PMC free article] [PubMed] [Google Scholar]
- 171.Jones SG, Ashby AJ, Momin SR, Naidoo A.Spatial implications associated with using euclidean distance measurements and geographic centroid imputation in health care research. Health Serv Res 2010;45(1):316–27. [DOI] [PMC free article] [PubMed] [Google Scholar]
- 172.Zinszer K, Jauvin C, Verma A, Bedard L, Allard R, Schwartzman K, et al. Residential address errors in public health surveillance data: A description and analysis of the impact on geocoding. Spat Spatio-temporal Epidemiol 2010;1(2-3):163–8. [DOI] [PubMed] [Google Scholar]
- 173.Zandbergen PA. Geocoding quality and implications for spatial analysis. Geogr Compass 2009;3(2):647–80. [Google Scholar]
- 174.Zimmerman DL, Li J, Fang X.Spatial autocorrelation among automated geocoding errors and its effects on testing for disease clustering. Stat Med 2010;29(9):1025–36. [DOI] [PMC free article] [PubMed] [Google Scholar]
- 175.Vieira VM, Howard GJ, Gallagher LG, Fletcher T.Geocoding rural addresses in a community contaminated by PFOA: A comparison of methods. Environ Health Global Access Sci Sour 2010;9(1). [DOI] [PMC free article] [PubMed] [Google Scholar]
- 176.Schootman M, Sterling DA, Struthers J, Yan Y, Laboube T, Emo B, et al. Positional accuracy and geographic bias of four methods of geocoding in Epidemiologic research. Ann Epidemiol 2007;17(6):464–70. [DOI] [PubMed] [Google Scholar]
- 177.Zhan FB, Brender JD, DE Lima I, Suarez L, Langlois PH. Match rate and positional accuracy of two geocoding methods for epidemiologic research. Ann Epidemiol 2006;16(11):842–9. [DOI] [PubMed] [Google Scholar]
- 178.Lin G, Gray J, Qu M.Improving geocoding outcomes for the Nebraska cancer registry: Learning from proven practices. J Registry Manag 2010;37(2):49–56. [PubMed] [Google Scholar]
- 179.Whyatt JD, Pooley C, Coulton P, Moser M, Bamford W, Davies G.In:Estimating personal exposure to air pollution on the journey to and from school using GPS, GIS and mobile phone technology. 11th international conference on harmonisation within atmospheric dispersion modelling for regulatory purposes; 2007. [Google Scholar]
- 180.Healthy Places Terminology [Internet]. Atlanta: Centers for Disease Control and Prevention; C2009-2013[updated 2013 Aug 14]. Available from: http://www.cdc.gov/healthyplaces/terminology.htm [Google Scholar]
- 181.Boulos MNK, Anastasiou A, Bekiaris E, Panou M.Geo-enabled technologies for independent living: Examples from four European projects. Technol Disabil 2011;23(1):7–17. [Google Scholar]
- 182.Worringham C, Rojek A, Stewart I.Development and feasibility of a smartphone, ECG and GPS based system for remotely monitoring exercise in cardiac rehabilitation. PLoS One 2011;6(2). [DOI] [PMC free article] [PubMed] [Google Scholar]
- 183.Herrmann S, Ragan BG. Outcome asssessment part 1: Measurement of physical activity. Athl Ther Today 2008;13(2):25–8. [Google Scholar]
- 184.Brezmes T, Gorricho J-, Cotrina J.Activity recognition from accelerometer data on a mobile phone. Salamanca ed; 2009[cited 12 October 2011]. [Google Scholar]
- 185.Allen TR, Wong DW. Exploring GIS, spatial statistics and remote sensing for risk assessment of vector-borne diseases: A west Nile virus example. Int J Risk Assess Manage 2006;6(4-6):253–75. [Google Scholar]
- 186.Herbreteau V, Salem G, Souris M, Hugot JP, Gonzalez JP. Sizing up human health through remote sensing: Uses and misuses. Parassitologia 2005;47(1):63–79. [PubMed] [Google Scholar]
- 187.Beck LR, Lobitz BM, Wood BL. Remote sensing and human health: New sensors and new opportunities. Emerg Infect Dis 2000;6(3):217–27. [DOI] [PMC free article] [PubMed] [Google Scholar]
- 188.Chunxiang C, Chang C, Xu M, Zhao J, Gao M, Zhang H, et al. Epidemic risk analysis after the wenchuan earthquake using remote sensing. Int J Remote Sens 2010;31(13):3631–42. [Google Scholar]
- 189.Graham AJ, Atkinson PM, Danson FM. Spatial analysis for epidemiology. Acta Trop 2004;91(3):219–25. [DOI] [PubMed] [Google Scholar]
- 190.Jacquez GM. Spatial analysis in epidemiology: Nascent science or a failure of GIS? Journal of Geographical Systems 2000;2(1):91–7. [Google Scholar]
- 191.Safran C, Bloomrosen M, Hammond EW, Labkoff S, Markel-Fox S, Tang PC, Detmer DE. Toward a National Framework for the Secondary Use of Health Data: An American Medical Informatics Association White Paper. J Am Med Inform Assoc 2007:14(1). [DOI] [PMC free article] [PubMed] [Google Scholar]
- 192.Hay SI, Battle KE, Pigott DM, Smith DL, Moiyes CL, Bhatt S, et al. Global mapping of infectious disease. Philosophical Transactions of the Royal Society B: Biological Sciences 2013;368(1614). [DOI] [PMC free article] [PubMed] [Google Scholar]
- 193.Hay SI, George DB, Moyes CL, Brownstein JS. Big Data Opportunities for Global Infectious Disease Surveillance. PLoS Med 2013;10(4): e1001413. [DOI] [PMC free article] [PubMed] [Google Scholar]
Associated Data
This section collects any data citations, data availability statements, or supplementary materials included in this article.