

Summary
Objectives
The objective of this paper is to explore approaches to understanding the usability of health information systems at regional and national levels.
Methods
Several different methods are discussed in case studies from Denmark, Finland and Canada. They range from small scale qualitative studies involving usability testing of systems to larger scale national level questionnaire studies aimed at assessing the use and usability of health information systems by entire groups of health professionals.
Results
It was found that regional and national usability studies can complement smaller scale usability studies, and that they are needed in order to understand larger trends regarding system usability. Despite adoption of EHRs, many health professionals rate the usability of the systems as low. A range of usability issues have been noted when data is collected on a large scale through use of widely distributed questionnaires and websites designed to monitor user perceptions of usability.
Conclusion
As health information systems are deployed on a widespread basis, studies that examine systems used regionally or nationally are required. In addition, collection of large scale data on the usability of specific IT products is needed in order to complement smaller scale studies of specific systems.
Keywords: Health informatics, human factors, usability, health information systems, evaluation
1 Introduction
Usability is a critical aspect in the design of complex health information systems [1, 2]. Indeed, nowhere are issues around human factors more important than in healthcare, where the poor usability of health information systems has been cited as being a cause of lack of user acceptance and has introduced new opportunities for users to make medical errors [3]. In this paper, we explore an emerging trend – the evaluation of usability of health information systems at the regional and national levels. This trend had emerged in conjunction with the widespread dissemination of health information systems worldwide. Although traditional usability methods are needed for assessing the usability of health information systems involving in-depth studies of a small number of subjects interacting with the systems (as it is the case in usability testing), there is also a need to consider methods that allow for complementary data to be collected in a meaningful and useful way from users at the larger regional, national and international levels.
Small scale usability studies have been carried out in order to assess and improve the usability of health information systems for the past several decades [3, 4]. In this paper, we refer to “small scale” usability studies as those studies where a small number of users participate in the evaluation of a particular health information system. Large scale usability studies refer to studies that either involve a larger number of participants (e.g. all physicians using an EHR in a region or country), or studies that focus on comparing systems that are deployed widely or across an entire region or nationally. Small scale usability studies focusing on specific isolated systems are needed as they focus on collecting detailed information about user interactions with a specific system in a specific work location or context. Indeed, such studies have improved the usability of many types of health information systems [4, 5]. However, as systems such as electronic health records (EHRs) have become widely deployed and used across regions and entire countries, there is also a need to collect information about the usability of health information systems at a larger more aggregated level - at the regional, national and even international levels. Additionally, there is a growing requirement to compare systems at regional and national levels. There is also a need to feed that information back into decision making about improved design and procurement of vendor-based systems that are more likely to be adopted on a large scale. In this paper, we explore this move from usability studies of specific system implementations to aggregated analyses by examining efforts in several countries. This includes efforts to collect data on the usability of health information systems at the regional as well as the national levels. The aim of the paper is to present the work conducted to develop methods for remotely collecting usability data of large numbers of users interacting with a range of health information systems – an approach we have termed “virtual usability laboratories”. Experiences in moving in this direction, along with issues and challenges encountered, and future directions for collected usability data “in the large” are discussed.
In this article, we present what we expect will lead to an ongoing discussion in moving to large scale usability data collection and analysis in healthcare information technology (IT). We describe several case studies of national and regional approaches aimed at addressing usability. We begin with an example of a study involving a small number of participants, but which has implications for the widespread use of systems across all regions nationally in Denmark. We will then move to a large scale questionnaire deployment (that was sent to all doctors in Finland) to discuss issues in collecting usability data from all potential users of a system in a country. Then we will end with a discussion of new experimental methods for collecting and analyzing what might be termed “big data” emerging from tracking healthcare IT users remotely and ubiquitously. It should be noted that the intent is to begin a discussion of different possibilities for moving from small scale studies with limited implications towards studies with larger scale implications and a larger amount of data.
2 Methods for Assessing Adoption and Usability in the Large
Internationally, a wide variety of approaches have been used to assess the usability of health information systems, ranging from usability inspections to usability testing methods and deployment of usability questionnaires [3, 6]. Many of these studies have been limited in scope and size, taking place in individual hospitals, physician offices, or individual health care organizations. This work has focused on local testing of health information systems. This has included the use of qualitative methods (including think-aloud protocols used in conjunction with usability testing) to compare the usability of different healthcare information systems. Another approach applied to the usability of healthcare information systems has involved regional and nation-wide deployment of questionnaires. Here, regional and national healthcare service provider organizations have asked health professionals about the usability of the health information systems they use at a larger level. In this article, experiences from Denmark, Canada and Finland will be described to provide information about the usability of healthcare systems based on data collected across regions and nationally. As it will be discussed, this move towards analyzing usability data in the larger context of regions or nations is an important emerging trend and can be seen as complementary to more localized usability evaluations. First, a qualitative usability analysis of five different CPOE systems in Denmark is presented as an example of using qualitatively-based usability studies to compare systems deployed across all regions of a country (i.e. the study evaluated and compared all five CPOE systems deployed in Denmark). In the second case study, the use of on-line questionnaires is described to assess physician perception of electronic health records (EHRs) across the entire nation of Finland. Thirdly, approaches to gather a wide range of different types of usability data by using on-line questionnaires and regional web sites in Canada are described. Finally, new approaches to gather usability data known as “virtual usability laboratories” are presented and future directions are explored.
3 Regional Comparison of the Usability of CPOE Systems in Denmark
One approach to comparing the usability of health information systems across regions has involved the application of usability testing methods. In the case study described in this section, five different medication systems (i.e. the systems that have been selected for use in Denmark’s 5 health regions) were evaluated with respect to a number of different usability issues. The following presents results on basic human-computer interaction such as the understanding of terminology, placement of buttons on the screen, and keyboard shortcuts. It is shown how these most basic interactions with a medication system (i.e. a computerized provider order entry – CPOE system) vary from one system to the other, and how this variation can cause confusion, misunderstanding, and dissatisfaction among physician users. The intent of this study was to extend usability evaluations to include comparisons of the five CPOE systems used across Denmark’s five health regions and thus presents an analysis at the regional level.
3.1 Methods
The study was based on a think aloud test with physicians testing five different CPOE systems. The five systems were all used in Denmark at the test time, i.e. physicians are likely to interact with several of these systems during employment and rotation at various hospitals. Test participants were selected based on the criteria that they would be younger physicians; they would be accustomed to doing ward rounds; they had been working with the CPOE system at their hospital for at least three months but less than a year; and they were unlikely to be familiar with other systems from other hospitals (that they would be asked to test the CPOE system in addition to the one they used in their own region). Physicians were recruited by contact persons from each of the hospitals participating in the study.
Each physician was told to pretend to do ward rounds, prescribing medication to patients according to several patient scenarios. Two patient scenarios based on real patient records had been created to make the test situation as realistic as possible. One scenario (M) described a relatively complicated, but not unusual, patient from an internal medicine ward receiving many different drugs and prescriptions according to predefined schemas. The other scenario (S) described a surgical patient with less complicated medications, basically concerned with standard prescriptions. Both scenarios were designed to ensure physicians were required to use a wide array of functions in the different medication systems. Scenarios only described what the physician had to prescribe, not how he/she should prescribe it. Scenarios were anonymous with regards to patient names as well as to the specific hospital they originated from. Cases were therefore completely anonymized and did not require special ethical approvals in Denmark.
Each of the ten physicians (i.e. P1 – P10) used one scenario (i.e. scenario M or scenario S) to test the system (systems A to E) from their own hospital and the other scenario to test a system from another hospital as shown in Table 1.
Table 1.
Design of the usability study of five different medication systems with ten physicians using two different scenarios
| P1 | P2 | P3 | P4 | P5 | P6 | P7 | P8 | P9 | P10 | |
|---|---|---|---|---|---|---|---|---|---|---|
| System A | M | S | S | S | ||||||
| System B | M | S | S | |||||||
| System C | M | S | M | M | ||||||
| System D | S | M | S | M | ||||||
| System E | M | M | S | M | S |
Physicians started the usability testing using the system they knew and had used (i.e. from their own region) to allow them to become accustomed to the test situation with a system they felt confident with, and then they moved on to one other unknown system (i.e. a system from another region which they did not have prior experience with).
The actual testing was performed using the educational version of the systems, as it was for ethical and practical reasons not possible to conduct the test using the production system. This opened up both possibilities and constraints for the usability testing, with some of the most important characteristics of the study listed in Table 2.
Table 2.
Features in the education system and production system when performing usability tests
| Feature | Education system | Production system |
|---|---|---|
| Create fictitious patients | + | - |
| Create fictitious users | + | - |
| Alter dates | +* | - |
| Screen capture | + | - |
| Remote access | + | - |
| Use environment | +* | + |
| Measure response times | - | + |
| Study error messages | - | + |
(* indicates features were not used in the testing)
For this study we set up fictitious user logins to give physicians access to medication systems in hospitals where they did not work, we also had to create fictitious patients according to the two patient scenarios. Using the educational version of the system from their own region, each participant completed one patient scenario on his/her known system. They then completed the other patient scenario using one unknown system, pretending to do the usual ward round and prescribing the necessary drugs for the fictitious patient. Participants were screen and voice-recorded using the system and were instructed to think-aloud while prescribing using the systems to explain what they did and why. The 20 test rounds produced approximately 17 hours of screen and voice recording data.
The Instant Data Analysis (IDA) method was used for analyzing data from the tests. It is known for being a fast and cheap approach to conducting and analyzing usability tests, while still uncovering 85 % of the critical usability issues [7]. The objective of the IDA technique is to serve as a tool for identification and ranking of critical usability problems to provide guidelines for re-design and quality improvement. The procedure in the IDA-method is to carry out a think-aloud test when gathering data. This data is then analyzed by the data collectors - in this case four researchers, who conducted a brainstorming and analysis session, to identify and rank usability problems. Usability problems are identified from what the users say during the test and from the expertise of the researchers. The purpose of this process is to identify the findings and categorize them as critical, serious or cosmetic issues. This method was pioneered in reaction to the critique that conducting a usability analysis requires extensive labor and time, and instead argues that useful usability analyses could be conducted even within a period as short as a day [7].
3.2 Results
The part of the study reported here focuses on the use of terminology, the placement of buttons on the screen, and keyboard shortcuts as mentioned frequently by the users during the test. Thus, we paid special attention to the differences in the five systems rather than equalities and minor potential cosmetic usability errors.
New Prescription
One of the most common functionalities of a CPOE is to start a new prescription. This basic task however has different terminology, buttons, and shortcuts in all 5 systems tested. Table 3 provides an overview of the results.
Table 3.
Location and terminology on buttons to start a new prescription (in Danish: “Ny ordination”)
| System A | System B | System C | System D | System E | |
|---|---|---|---|---|---|
| Button | |||||
| Shortcut | Ctrl + N | No shortcut indicated | Ctrl + y | Ctrl + 0 | Ctrl. + N |
| Location of the button to click |  |
 |
|
 |
 |
For example, in system A the button for starting a new prescription is positioned at the bottom of the screen to the left. It is indicated “Ny ord….” which is probably an abbreviation of “Ny ordination”. However “ord” is also another term in Danish – “word” in English. The keyboard shortcut is Ctrl+N, which is indicated by underlining the letter “N”. In system B the button is located in the same position as in System A, and in the text the function “Ny ordination” is written out in full. However, as there is no keyboard shortcut indicated, it was unclear to users whether it existed at all. In system C, the button is located in the same position again, and the text is written in full, however it is followed by …. The meaning of these dots was not self-evident to users. The keyboard shortcut in this system is Ctrl+y indicated by underlining the letter “y”. In system D, there is no button to click on when a new prescription is wanted. Instead the user has to know that one must right click anywhere in the middle of the screen to activate a drop down menu where the second option is “Opret ordination” which means “Create prescription”. The keyboard shortcut is Ctrl+O. In system E, there is an icon at the top left corner, and the mouse over text reads: “Ny ordination (Ctrl+N)”, in English “New Prescription (Ctrl+N)”.
Discontinue Prescription
Of equal importance to prescribing drugs for patients is the task of discontinuing the medication or adjusting a dosage. Table 4 shows how this is done in the five systems. In System A, the user can discontinue or adjust a prescription using the buttons at the bottom right of center. There is a keyboard shortcut to discontinue (Ctrl+S) and for making adjustments (Ctrl+J). In System B, the user can choose the drug he/she wants to discontinue from the medication list, right click for a drop down menu and then choose “Seponer”. It is also possible to pause the prescription “Pauser”, however to do an adjustment is no option, and there is no keyboard shortcut. System C can discontinue or correct a prescription by right-clicking the concerned drug, which will open a drop-down menu where you can choose either “Seponer…” (Discontinue) or “Ret…” (Correct). These functions can also be reached by clicking one of the buttons at the bottom left of the screen. “Ret…” is at the far left and “Seponer…” as second from the left. In system D, the wanted drug is chosen on the medication list and by right clicking a dropdown menu appears. The top option reads: “Ændre ordination…” (Change prescription) and the last option is: “Seponer ordination…” (Discontinue prescription). In the drop down menu there are other options to prescribe a new dosage “Ny dosering…” or to pause the prescription “Pauser ordination…”. There are keyboard shortcuts for discontinuing (Ctrl+Z) and pausing (Ctrl+B) but not for changing the prescription. In system E, the user can either click on an icon in the top left corner, or right click on the specific drug and then in the drop-down menu choose “Ændre ordination” (Change prescription), “Seponer” (Discontinue) or “Påbegynd pause” (Start pause). There is no keyboard shortcut indicated.
Table 4.
Location and terminology of buttons to discontinue or adjust a prescription (in Danish: “Seponer ordination”)
| System A | System B | System C | System D | System E | |
|---|---|---|---|---|---|
| Button | 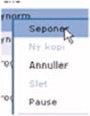 |
 |
 |
 |
|
| Shortcut | Ctrl + N | No shortcut indicated | Ctrl + y | Ctrl + 0 | Ctrl. + N |
| Location of the button to click |  |
 |
 |
 |
 |
Searching a Drug
Given the wide range of different drugs on the market to choose from, all the physicians made queries to the hospital pharmacy drug database, and the differences in the way search results were presented were significant. The following shows how the five systems present the search results for the drug Tramadol with the Danish trade name “Tradolan”. Tramadol is a commonly used narcotic-like pain reliever used to treat moderate to severe pain. Figure 1 shows how system A presented the search results.
Fig.1.
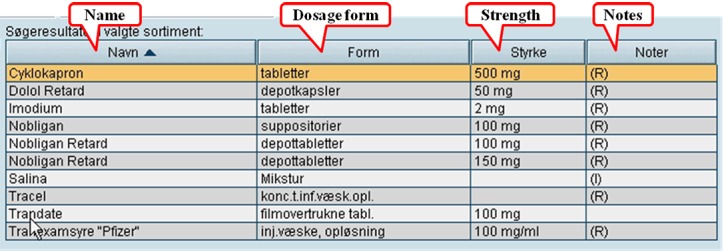
Presentation of search results from a search in the drug database for the drug “Tradalon” – System A
In the first column the trade name of the drug is presented. In the second column the dosage form is found, and no abbreviation in the form is used. The strength of the drugs is listed in the third column. The last column contains notes. There is no explanation to what the (R) and (I) means.
In system B the trade name of the drug is also presented in the first column – the column is called “drug names”(Figure 2). The second column indicates the generic name of the drug. The third column is the form of administration, and the fourth column indicates the strength – note that the weakest dosage of a drug is listed over the stronger dosage e.g. “Mandolgin Retard”. The last three columns are termed “S”, “R”, and “SO”, however there is no explanation of these letter abbreviations.
Fig. 2.
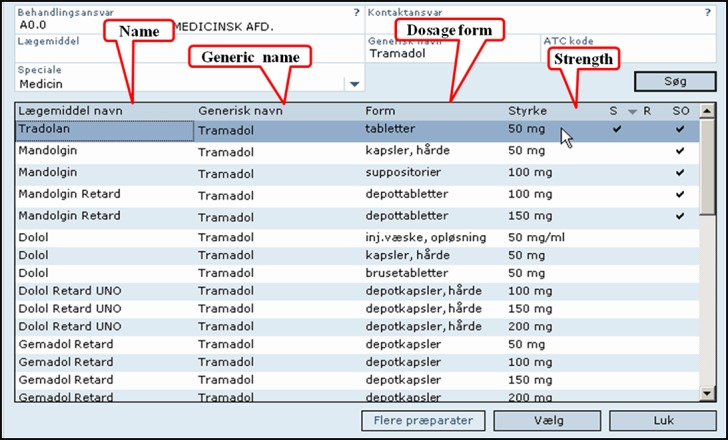
resentation of search results from a search in the drug database for the drug “Tradalon” – System B
The first five columns of the search results in system C were difficult to interpret for users, as the headings were unintelligible to novice users (Figure 3). The following column give the ATC code, the trade name of the drug, and then the dosage form explained in full text. The next column gives the strength and we can notice that the strongest strength of the drug named “Tradolan Retard” is listed on the top of the weaker strength. The last column is set-aside for the manufacturer of the drug, but is obviously not used in this search.
Fig. 3.
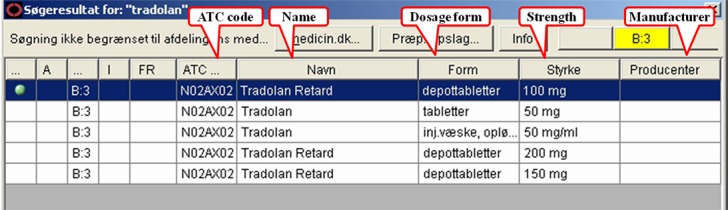
Presentation of search results from a search in the drug database for the drug “Tradalon” – System C
In System D the first column denotes the trade name of the drugs, the second the generic name, and the third the dosage form (Figure 4). Here the form is abbreviated, but only understood by few of the test physicians e.g. INJVSKO means “Injektionsvæske, opløsning” (solution for injection). The fourth column is the strength of the drugs, and here the drug with the weakest strength is listed before the stronger ones. The last column is labeled “Sort.”, but it is unclear what it stands for, and all the cells are empty.
Fig. 4.
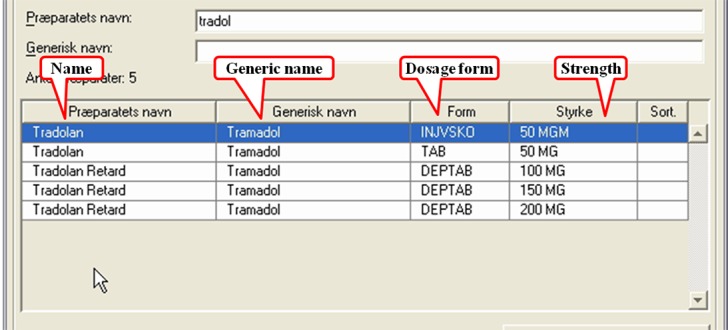
Presentation of search results from a search in the drug database for the drug “Tradalon” – System D
In system E, the first two columns are only explained by icons (Figure 5). The third column gives the trade name of the drugs, and the generic names are listed in the succeeding column, followed by the ATC code. The subsequent column is devoted to important information, but none are listed for this search. The last column indicates the manufacturer of the drugs, but the coded information in the cells was not informative to the test physicians.
Fig. 5.
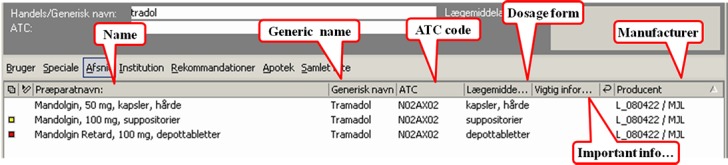
Presentation of search results from a search in the drug database for the drug “Tradalon” – System E
3.3 Summary - Denmark
In Denmark it is very common that physicians work in several different hospitals during their career, and thereby are exposed to different IT systems. However, when health information systems use different icons, different buttons, placed in different positions on the screen for the same functionality it will create unnecessary trouble for the users until they learn how to operate. In other words, new users are presented with a very steep learning curve. From our study, it was found that in some cases it took the users up to 30 minutes just to find the right way to start a new prescription – perhaps the most essential work task. A simple standard could eliminate these troubles for new users. Performing a search for a new drug is easier, but to read and understand the results may pose a number of problems. First of all, the way search results are presented varied a great deal. In most of the systems, the name of the drug is presented in the first column, but only some of the systems present the generic name of the drug. One system (system E) presents the dosage form together with the name of the drug. Some of the systems present the ATC code, others do not. In some of the systems, abbreviations are used instead of writing the full text. Abbreviations were not easy to understand for new users, and even some of the experienced users did not understand the abbreviations e.g. dosage form in system D and manufacturer in System E. Some of the users tried unsuccessfully to interpret the abbreviations. If essential information such as dosage form should be written in full text, and if the information is not significant to the user it could be left out leaving the space on the screen for more essential information.
More serious is the order in which the same kind of drugs are presented. The drug “Tradolan Retard” is found in strengths of 100 mg, 150 mg, and 200 mg. In most of the systems, the lowest strength is presented first and the higher strengths below, except in System C where the highest strength is presented first. This is a potential hazard as it increases the risk of committing a technology-induced error by choosing a high dosage by default [8].The differences identified in the five systems lead to unnecessary difficulties for the users, and some of the issues found can even lead to patient safety problems. It should be noted that this study was the first of its kind in Denmark, where physicians were studied as they interact not only with the system they were familiar with in their own region, but also with systems from other regions of the country.
This small size study examined all CPOE systems of a country. It provided a rich source of information applicable to the whole country despite the small number of users. This shows the importance of targeting studies to systems that are widely used as a basis for comparing systems and to provide continuous improvement that will ultimately affect thousands of users (i.e. this represents a study of all CPOE systems used in a nation that all draw data from an integrated national medication database, making it a unique study in terms of implications to large numbers of users). In addition, the results indicate a preliminary need to look at the importance of user interface standardization for health IT systems used within a region and across regions, as the results from the study in terms of usability problems varied highly according to the system studied. This also points out the potential advantage of adopting EHR user interface standards, and that further work along the lines of development of such standards based on comparative usability studies is needed. Research along these lines is now being considered by the authors of this paper, inspired by work reported from the CUI project [33].
4 Designing and Deploying a National Usability Questionnaire in Finland
Finland has been a leader internationally in the adoption of electronic health record (EHR) systems (EHRs). By 2007, 99% of the Finnish public sector health centers, and 100% of the hospitals were using EHR systems [9]. However, despite this high adoption rate, minimal attention was given to usability, either in national discussions or in published research. Increasing dissatisfaction among physicians lead to the first attempt to conduct a nationwide usability evaluation in 2007, when a study was initiated and conducted by a group of physicians from the eHealth Committee of Finnish Medical Association [10]. Five physicians evaluated ten EHR systems used in public sector hospitals and health centers by on site-visits. They observed experienced local physician end-users performing a pre-defined set of tasks (e.g. “write a prescription”). Although usability experts were neither involved in the design nor in the interpretation of the results of this study, results clearly showed that physicians’ needs had not been taken into account when designing EHRs that physicians were using.
By the year 2010, EHR systems covered 100% of the specialized and primary healthcare organizations (hospitals and health centers) in Finland [9]. To further investigate usability issues, the next step was to survey physicians’ perceptions nationally in order to gather more comprehensive and systematic data about physicians’ experiences about the use and usability of their EHR systems. We started by surveying the opinions of 30 physicians from primary and secondary care with a semi-structured questionnaire; most of them were also active in national or local eHealth activities. We asked them to pinpoint the major problems and benefits of both the EHR systems they use themselves and EHR systems in general. We also ask them to speculate as to the reasons behind these problems and to propose possible solutions. With this baseline information at hand, a multidisciplinary study group was formed in order to involve different areas of expertise in questionnaire design: clinical medicine (the three physicians were specialists in Internal Medicine, Radiology and General Practice), usability, medical informatics, sociology of technology, and occupational health research.
From the usability viewpoint, the aim of the survey was to identify the main usability problems, find out what features physicians found positive, and address the participatory development of the systems. In the era of full EHR coverage, from the national perspective, the aim was to evaluate the success of different EHRs employing a large-scale national questionnaire. The advantages of using questionnaires in usability research are that they can provide feedback from a large end-user group and the gathering of data is quick and cost-effective. Usability questionnaires such as the SUMI (Software Usability Measurement Inventory), SUS (System Usability Scale) and QUIS (Questionnaire for User Interaction Satisfaction) are context and domain independent questionnaires, and focus on a selected software, system or workstation under evaluation. Our aim was to research the usability and use of the clinical ICT systems from the perspective of physicians, and analyze the clinical tasks involving simultaneous usage of numerous systems. Since there was no standardized or scientifically validated usability questionnaire available, that could characterize usability, particularly in the clinical context in which physicians utilize EHRs and other clinical IT systems simultaneously to carry out daily tasks, we decided to develop our own set of usability questions. For this purpose, we reviewed available usability questionnaires and proposed a conceptualization of clinical ICT systems usability, which draws from the widely cited definitions of usability [1, 26] and describes aspects of the usability of clinical ICT systems at a context-sensitive level. The usability of clinical ICT systems refers to the ability of the systems to have a positive impact on patient care by supporting physicians in achieving their goals with a pleasant user experience. In order to support physicians in their daily clinical work, ICT systems need to be compatible with physicians’ tasks. At a more concrete level, this indicates that systems should provide physicians with key (context-matching) functionalities, be efficient (especially in terms of record-keeping and information retrieval), and have intuitive user interfaces. In addition, ICT systems should support information exchange, communication and collaboration in clinical work and be interoperable and reliable. Since clinical ICT systems are used in numerous environments, they should also adjust to various user needs and organizational settings.
The questions for the national questionnaire were formulated by the study group. The questionnaire incorporated several user-related themes: usability, information system success, user-centered ICT development, and occupational health. Usability questions were designed so that they covered broadly (from various viewpoints and with various levels of abstraction) issues of usability of clinical ICT systems: a set of statements was developed to address the usability of EHR user interfaces. These questions were similar to questions in standardized usability questionnaires. On the other end, questions about IT support for communication and collaboration between physicians were more abstract but also reflected how well systems are suited to the needs of physicians and if systems have a positive impact on patient care, and thereby improve healthcare delivery by supporting operational tasks and goals. The questionnaire was pilot tested with six physicians that had not been involved in the design of the study in order to ensure that the language used in the questions was understandable to an ordinary physician i.e. terms used were not too technical.
4.1 Methods
The questionnaire was targeted to Finnish physicians, who were under 65 years and actively engaged with clinical work. A web-based questionnaire was designed to cover the following areas: usability (including key functionalities, efficiency of use and intuitiveness of EHR user interfaces), ICT support on collaboration and health information exchange, technical reliability and interoperability, and support for clinical workflow. The questionnaire was in Finnish and included 16 background questions and 38 usability-related questions. Only few of the questions were obligatory [11].
Altogether 3,929 physicians, representing one third of the physicians actively working in the clinics in Finland, completed the questionnaire. The sample was found to be representative of the population. The large research data made it possible to explore differences between responses from various healthcare organizations. The large amount of data that was collected also enabled the researchers to analyze data from different viewpoints and based on published multiple academic articles e.g. articles about physicians’ experiences of usability of their current EHR systems [11], physicians’ experiences with different regional health information exchange systems [12], physicians’ experiences with computer-supported information exchange and communication [13], and physicians’ willingness to participate to system development [14]. The following section describes a summary of the results presented in these publications.
4.2 Results
With 3,929 respondents (27% of all working-age physicians), the national questionnaire study was considered as representative of the users of all main EHR-systems in public primary and specialized care, and private care organizations in ambulatory and institutional care in Finland. The results show that Finnish physicians are highly critical of the IT systems they currently use, regardless of the context of use. The averages of the ratings given to EHR systems reflect physicians’ dissatisfaction: with a rating scale from 4 to 10 (which is the grading scale in Finnish schools and was chosen as a consequence), the average grade varied from 6.1 to 8.4. A deeper analysis revealed that dissatisfaction with EHR systems was highest in public sector hospitals and healthcare centers. What makes the findings even more concerning is that systems with larger user populations received lower ratings (averages between 6 and 7) [11].
Physicians expressed fairly positive opinions about user interface characteristics (e.g., terminology and feedback) and the intuitiveness of use. These opinions were more positive than were their opinions on other subjects related to interfaces. Physicians expected their IT systems to provide better support for performing routine tasks than they currently do. Physicians’ responses indicated that routine tasks cannot be performed in a straightforward way, and that IT systems require physicians to perform fixed sequences of steps and tasks [11]. Questionnaire responses indicated that the current healthcare IT systems lack key functionalities, such as a proper patient overview chart (daily treatment chart), and support for decision making and for medical errors prevention.
Questionnaire results were mixed with reference to the quality of IT support for communication. Physicians were rather satisfied with computer-supported collaborative activities between physicians working in the same organization. In contrast, findings on computer-supported collaboration between physicians and nurses showed concerning opinions. Responses to the statements on ICT-supported interaction between physicians and patients showed that, at present, the use of information systems takes time and even disturbs direct patient contact [11].
4.3 Summary - Finland
To support healthcare delivery and physicians’ daily work, EHR systems need to be effective, efficient, intuitive to use, and to have a low error rate. The national questionnaire with Finnish physicians pointed out several serious usability problems and deficiencies. Based on the questionnaire results from nearly one third of working-age Finnish physicians it was concluded that currently used EHR systems do not adequately support the daily work and clinical tasks of physicians. Physicians’ ratings for the EHR systems they mainly use were relatively low which indicate significant dissatisfaction towards these systems.
The tailored usability questionnaire for physicians’ clinical work represents a methodological contribution to the field of health informatics. The questionnaire incorporated several usability and use-related questions, and the design of the usability items in the questionnaire drew from the conceptualization of the usability of clinical ICT systems (presented by Viitanen et al. [11]). This kind of conceptualization was not found in academic articles. We had not tailored the questions by specialty, i.e. the questions were the same for all physicians, but physicians working in diagnostic specialties (e.g. Radiology and Laboratory) found some of the questions unsuitable to their clinical environment.
Compared to established usability questionnaires, a tailor-made questionnaire has several advantages. Questionnaire studies typically address usability at an abstract, not context-sensitive level. The development of a tailored usability questionnaire required the understanding of usability issues and of the particular context of research – the characteristics of clinicians’ work and working environments, as well as the variety of organizational settings.
4.4 Ongoing Work to Monitor eHealth Usability and Benefits in the Large
In Finland, the national usability study directed to physicians is part of a national eHealth monitoring system. Legislation on the electronic processing of client data in social and health care services [15] requires that National health information services (currently including ePrescription, patient data repository, and in the future the national PHR-services) be monitored regularly by the National Institute for Health and Welfare. The aim is to provide national results (as opposed to more small scale data collections) that can capture the big picture, and differences between regions and various IT-systems used for the national health information services. The national level results are needed to identify issues everybody is struggling against, as well as those particular actors that are struggling against certain issues, and thus help to plan support actions for different stakeholders in the planning, steering, diffusion and use of IT-systems for these services in order to gain anticipated benefits. A preliminary national plan on monitoring was compiled in 2009 [16]. Usability monitoring was integrated into a national monitoring programme in 2013 with the support of the Ministry of Social affairs and Health. At the same time, data collection from availability and usability surveys was harmonized to obtain a better overall picture of availability, use rate, usability, benefits and development needs of the specific eHealth services (specifically the health information exchange - HIE and personal health record - PHR services). A further aim was to develop the data collection tools to provide internationally comparable data, especially within the Nordic countries. In addition, there was a need to start monitoring citizen’s experiences and needs.
The national level monitoring in 2014 consists of four national level surveys as well as collation of statistical and log data on diffusion, use and benefits of the defined eHealth services. One survey is targeted to the CIO’s in health care (previous data collection points 2003, 2007, 2010), and one concerned social care organisations (previous data collection points 2000, 2010). These two surveys focus on data collection of availability and use rate (% of transactions performed electronically) of key health information systems, functionalities and services in social and health care organisations. The physician survey was targeted to all practicing clinicians (previous collection point 2010). It focuses on experienced usability, experienced benefits and key development areas of health information systems from the physician’s viewpoint. A new survey for citizens has been developed for data collection point in 2014 to monitor citizen’s use, usability, experienced benefits and key development areas of HIT. The survey will be targeted to a representative sample (ca. 20 000, aim to gain 5000 responses) of citizens. The citizen survey has been developed based on similar surveys conducted with citizens in Canada and Denmark.
Nordic countries have taken the benchmarking and learnings from other eHealth work involving systems a step forward from national monitoring activities. In 2011, a collaboration was established between the Nordic Council of Ministers eHealth group and the Nordic eHealth researchers in Sweden, Denmark, Norway and Iceland to develop, test, and access a common set of indicators for monitoring eHealth in the Nordic countries and Greenland, Faroe Islands and Åland. The plans and first results of this collaboration were published in 2013 [16, 17]. The work has continued from the identification of common availability- and use rate variables to usability and benefit-variables. The national usability surveys in the participating countries will collect the usability data, and the commonly defined variables and measures in all Nordic countries can then be used to benchmark usability and user experiences of eHealth systems, functionalities and services in these countries. The main outcome will be the definition and deployment of common variables, with which key issues are measured in a common manner across the Nordic countries amongst different IT system users working in different contexts of use. These comparative variables form an important achievement in the Nordic context, where there is a long tradition of collaboration and learning especially in the development and deployment of national health information systems and services – work led by the Social and Health care Ministries. Comparative data provides improved evidence for the management of the national health information systems. This also points to areas (and individual variables) where some Nordic countries perform better than others. This information is important for identifying both the best practices as well as the most critical development needs in the different countries. Even if data is collected at a system level, the plan is to publish comparison results at a more aggregated level. Nordic results are thus first and foremost directed to national eHealth policy makers. Via the national eHealth policies and national eHealth system management actions, they are reflected to other stakeholders, including vendors. Results of national surveys also reported at the system level, providing the vendors data on how their systems scored compared to others.
5 Assessing Health Information System Usability in Canada in the Large
In Canada a number of different approaches have been taken to collecting large-scale data on health system use and usability. Much of this work has been motivated by regional and national initiatives to increase the adoption of EHRs, as the rate of adoption of these systems in Canada is lower than in other countries such as Denmark and Finland. As a result, national efforts are underway to stimulate the usage of these systems, including provincial programs that subsidise physicians for purchasing specific regionally certified EHR systems.
In terms of large scale data collection, the National Physician Survey (NPS) is a lengthy questionnaire focused on measuring a wide range of aspects of the medical practice of physicians in Canada [18]. The survey was given in 2004, 2007, 2010 and 2013, and includes a subset of questions focused around the use of a range of information technologies by physicians (starting in 2012, it became an annual survey). For its last release, it was sent out to all Canadian physicians (by email and regular mail), with 12,076 physicians replying to the survey for a response rate of 18%. The questionnaire is targeted to all Canadian physicians and residents and includes scales for asking physicians about their type of practice, specialty, and issues in healthcare [18]. The technology subsection includes questions about which type of information technologies they use; for example, use of web applications, electronic records and provincial electronic patient data viewing systems (e.g. where systems are accessed from, use for which type of patient cases, etc.). However, questions about usability or user satisfaction are limited. Results over the past several years are broken down by province and territory and have indicated a steady increase in the use of EHRs. Data is analyzed and presented as percentages of physician responses (e.g. the percentage of physicians in a province using EHRs) that can be filtered from the national website according to province or territory. However, although levels of adoption of health information technology can be gathered from this type of survey, the lack of specific questions about usability limits its usefulness for assessing how satisfied physicians are with using the systems that they do use.
Regarding the assessment of end user perceptions of the usability of EHRs although Canada does not have a national questionnaire addressing issues of usability specifically (as it is done in Finland), several provincial regions have begun to host web sites where physicians may post their subjective ratings of the usability of specific commercial EHR systems (i.e. for systems that are supported by the provincial EHR adoption programs). These websites allow physicians to rate the products they are using and review summaries of other physician ratings for each product. This is targeted to helping physicians in selecting products supported by provincial EHR adoption programs. For example, the provincial organization OntarioMD deployed a site that allows physicians to indicate their ratings (on a 5 point scale) of the following dimensions of systems they have purchased: purchase experience, implementation experience, support experience, overall usability, and satisfaction with the product. Physician users can rate each of these 5 dimensions for a specific EHR product they are using on a 1-5 scale. The intent is that other physicians who are considering selecting a specific EHR product can also log into the site and assess the aggregated ratings of that EHR product, including reading comments about the usability of these systems entered by their colleagues who are using those systems. These types of rating sites have been successful in eliciting thousands of ratings, comments and blogs. However, in terms of usability, it has been noted that such sites need to be expanded to include not just an overall usability rating for a product but also be expanded to include ratings on the main dimensions of usability, namely: system effectiveness, efficiency, enjoyability, learnability and safety. In addition, blogs from end users could potentially be analyzed qualitatively to identify key themes and issues.
In the remainder of this section we will focus on new methods that have begun to be applied in Canada to assess usability of health systems on a large scale using methods that allow for remote data collection. The methods integrate the collection of large-scale user logging data with collection of on-line surveys as well as tailored questions about usability that can be triggered to appear at pre-selected points in their interaction with systems. As will be described, the various forms of data collected are beginning to be aggregated and analyzed using data mining methods.
5.1 Methods
The remote and widespread evaluation of the use and usability of health information systems has lead to new developments in collecting data from end users remotely. This is particularly the case when considering Web-based health information systems. In response to this need, Kushniruk and colleagues have been working on developing what they refer to as “virtual usability laboratories” [19]. The intent of this work was to extend earlier work conducted by Kushniruk and colleagues in designing “televaluations” of health information systems [20]. This work involved deploying mulit-method evaluations over the WWW, including using a variety of data sources including the following: automated collection of end user interactions and logging data, collection of data from on-line questionnaires triggered to appear when users interacted with specific system functions, and results from questionnaires triggered to appear periodically. The tracking component of this work extended the work by Feliciano and Altman by allowing for remotely tracking and logging use of health information systems remotely [21]. In developing the tool known as the Virtual Usability Laboratory (VULab), we drew on these experiences to integrate into one tool the collection of both quantitative logging data and qualitative use and usability data collected remotely from many users of systems (interacting with healthcare systems from many locations).
The architecture of the VULab consists of four main system components: (1) a central end user tracking and logging component, (2) a component responsible for controlling the presentation of on-line forms and questionnaires (both questionnaires triggered when users entered specific parts of a system and those triggered periodically, e.g. at a two month period), (3) a database component that allows for collecting and collating varied forms of data, including usage logs, results of questionnaires and user comments, (4) a researcher user interface that allows evaluators of health information systems to set up remote evaluation studies (e.g. by specifying how log files should be set up, when users should see questionnaires etc.) and to also query the database to support analysis of results of evaluation studies. Details of the architecture of the VULab is described in Kushniruk et al. [19].
5.2 Results
The VULab has been employed in a number of studies in Canada for evaluating the use and usability of a range of health information systems. In this section, we will show how the tool has been used to set up a research study of the use of clinical guidelines by physicians. Figure 6 shows the user interface as seen by a researcher setting up specific queries that were triggered by end users when they entered a specific part of a web site that contained clinical practice guidelines about breast cancer. In the figure, we can see that there were a number of options that could be selected from for the presentation of a series of background questions that were posed to participants of the study when they interacted with the online guidelines. From the figure, you can see the researcher had selected the following questionnaires: Demographics, Computer Background and Expectations (these questionnaires are pre-stored in the VULab and can be selected or modified for deployment). In the figure, it can also be seen that a new question was entered by the researcher to be triggered when users arrived on the web page illustrated in the figure. Here the researcher had set up the question “ Why are you interested in breast cancer guidelines?” and had indicated that this question should be automatically triggered when the user enters the guideline page.
Fig. 6.
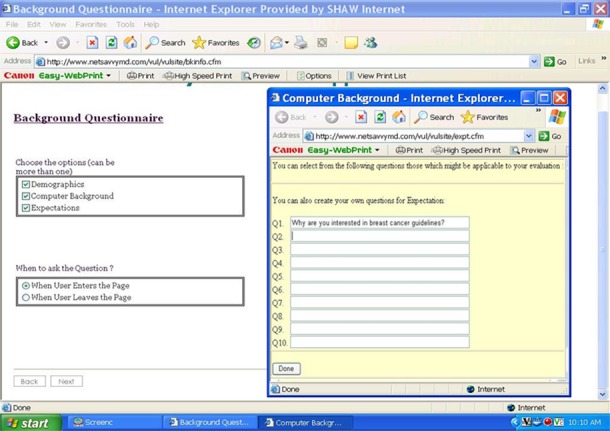
Screen shot of the VU-Lab researcher interface (where a researcher is creating questions to be presented to users of the system under study).
Once the researcher had set up the study parameters, the study began and users were tracked as they interacted with the guidelines. In this example, physicians participating in the study were given the links to the breast cancer guidelines and asked to read through the guidelines. Figure 7 shows the user interface as seen by a study participant when he/she reached the clinical guideline web page, where the question about his/her interest in guidelines (which was set up by the investigator) pops up. The user then used a text box to enter his/her response and then continued browsing through the guidelines, with all his/her browsing being recorded in a log file. Thus the VULab can collect both logging data (creating log files of use of different systems components that can be quantified and statistically summarized) as well as qualitative data on user preferences, information needs and usability issues. Data from this particular study were used to fine tune the presentation of clinical guideline information and the results were consistent with prior studies of clinical guidelines and web-based health information systems, including those by Kushniruk and colleagues, where it was found that many guidelines designed for use by health professionals were cumbersome and difficult to read and interpret during their busy daily routine (particularly when they were interacting with patients) [19, 20]. In several of our studies, this result has led to redesign the guidelines. With one healthcare organization, this led to creation of guidelines in two different formats (which could be selected by the end user, depending on the context of use) – one format allows for quick reading using a flow-chart formalism, and another format was designed for reference reading and to be used when the physician had more time to review the information in the guideline. Another point is that using this approach, the data collected can consist of records of thousands of user interactions. Given the capability of collecting large amounts of usage and usability data this way, current work is underway on applying data mining methods to analyze both logging data and usability data obtained from on-line questionnaires in an integrated way.
Fig. 7.
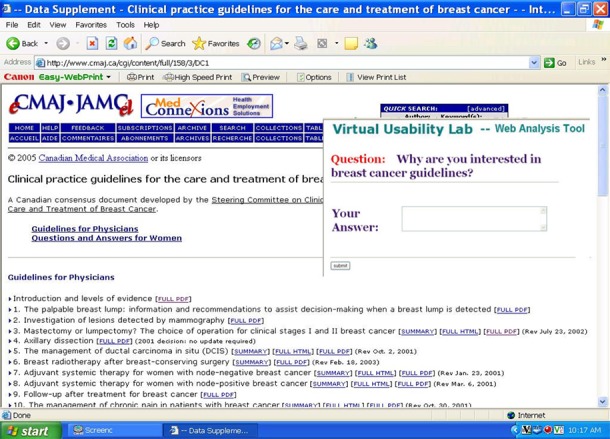
Screen shot of the VULab end user interface (where the pop-up question created by the researcher in Figure 6 has been automatically triggered to appear to the end user of the guidelines)
5.3 Summary - Canada
In Canada, a combination of methods and approaches has been explored for considering usability in the large. This has included portions of a nationally administered physician questionnaire containing some questions related to EHR use and usage. In addition, at the regional level, web sites have been developed where users of particular information systems can provide ratings of the usability of these systems. At the larger end, experimentation is ongoing in developing tools and methods that will allow for large scale data collection, including recording click streams, qualitative perceptions of usability at point of use as well as allowance for automated analysis of large amounts of usage and usability data.
6 Discussion
Compared to general field of HCI, the scope of usability studies in health informatics has been somewhat restricted. Little systematic data has been gathered to approach usability issues from a broader perspective and to support user-centered design of healthcare ICT systems, e.g. examine usability in the context of clinical work in which numerous systems are in use, study experiences of use and usability from the perspective of a large group of clinicians. In the health informatics literature, the definition for usability presented by the ISO standard [26] is often referred to; however, no specific clarification or definition has been presented on the concept of the usability with regard to healthcare ICT or clinical IT systems. The need exists for extending traditional approaches to usability research, which concentrate on the evaluation of user-interface aspects, and to go beyond the study of the interaction between a single user and a single healthcare information system. In the clinical context for example, the technology environment can consist of hundreds if not thousands of information systems (and potentially thousands of users of those systems). With the end-users’ perspective in mind, usability studies should address the usability of healthcare information systems from a broader viewpoint: user needs, experiences, and expectations with regards to several systems which physicians and nurses simultaneously use in their daily work. Compared to small scale usability studies, which concentrate on user interface aspects of a single system, a broadening of the interpretation of usability to cover aspects of collaboration, communication, simultaneous use of multiple clinical ICT systems clinical contexts could: 1) increase our understanding of contextual characteristics that reflect user’s experiences of information system use and acceptance in healthcare settings, and 2) steer researchers to address issues that are not typically acknowledged in usability evaluation studies (e.g. support for collaboration or need for rapid context switching). What is more, a broader view to usability can help us understand and cope with the ongoing changes in healthcare technology adoption and use. The emerging trends of collaboration and patient-centered care in clinical work will raise even more concerns for traditional approaches to usability and its evaluation, and underlies the need for shifting the focus from single system evaluations to evaluation of broader aspects, e.g. communication and collaboration.
In addition, recently researchers have pointed out the need for bringing usability approaches into the system procurement process (e.g. Kushniruk et al. [22], Carvalho et al. [23], Schumacher [24]). This is an emerging research approach and trend, particularly where the current work in HCI field is considered (e.g. see recently published article by Jokela et al. [25]). Further, usability data and evidence are often lacking regarding the benefits of successful and highly usable systems and the costs of bad usability in healthcare. Healthcare organization representatives arguably have an important role in healthcare information system development and procurement, since they are in charge of the investments and have the power to determine the criteria for selecting systems. If such organizations would have access to “larger data” about the expected and realized usability from the viewpoint of end-users, they would have better evidence for decision making, investments and development activities. Along these lines, making end users and potential purchasers of such systems able to see aggregated summaries of ratings for specific products would allow for improved sharing of valuable information about the usability of specific products they may consider to purchase. In addition, the information could be used by vendors themselves to obtain feedback from end users in order to improve their system design and usability.
Research on user perspectives of technology use in healthcare seems to generate considerable inter-disciplinary interest, although concepts and approaches used in different disciplines are somewhat different. For example, the national questionnaire study with physicians in Finland described in this paper indicates that several items in the questionnaire addressed attributes of usability and user experience as well as variables related to information system success. The recently launched ISO 9241-210 (2010) standard clarifies the relationship between the concepts of usability and user experience (UX) by stating that user experience refers to a person‘s perceptions and responses resulting from the use and/or anticipated use of a system [26, 27]. Accordingly, usability should be understood as a broad concept that includes the kind of perceptual and emotional aspects typically associated with user experience. Furthermore, it has suggested that “perceived usability” refers to usability experienced by system end-users and this is paramount to whether systems get adopted, used, and liked or rejected [28]. Further conceptual analyses around the concepts of usability, user experience, user satisfaction, perceived usefulness, quality of use, and user acceptance should carefully consider the mutual interests of usability and health informatics research with other academic research fields, e.g. with information and communication theory, information system research (e.g. article by Davis [29]), and measurements of information systems success (DeLone and McLean [30]; Hyppönen et al. [17]).
Traditionally, usability has been evaluated and monitored in a qualitative way. Methods have included both laboratory and field studies. For traditional standalone applications, this has been the way to gather detailed information about the usage of a single application. Many modern information systems are, however, being increasingly deployed as on-line services. In practice, this means that users access the functionality offered by the systems through local and wide area networks. Actual systems and software run in the servers on intranets, the internet, or the “cloud”. Separate and standalone applications are becoming scarce even in the case of mobile applications. This development opens up new possibilities for creating a more detailed understanding on the interaction between the system and the user. User and interaction analysis is no longer constrained to interviews and observations. When we use digital services, traces of our activities remain not only in local browsers and applications but also in the servers that we access. Since the introduction of web servers, a standard feature has been the logging of the requests from the browsers that access the data at the server. These log files have been the source of details and analyses for understanding the popularity of the web pages at a specific site. Often, this data has been used for commercial and marketing purposes, but it provides an interesting real-time source of information for understanding details about user interaction with the service. New approaches will be needed in order to harness the large amounts of data that is now able to be collected from end user interactions with health information systems over the Internet [19].
Traditionally, user modeling has been done based on qualitative data and descriptions in the form of “personas” [31]. Much of the underlying data for constructing these descriptions comes from qualitative observations and interviews. Detailed interaction data can, however, complement qualitative findings with facts about the realized interactions with the service. With the help of detailed data collection from analysis of user interactions, remote evaluation and analysis can take place. Fern and colleagues present a model for mining and analyzing usage data [32]. The large amount of low level interaction data is first preprocessed resulting in event sequences that can be used for frequent pattern mining. The second part in working with the data is the interpretation of the patterns through pattern clustering and grouping resulting from statistical analysis. According to Fern and colleagues this type of analysis is capable of unveiling not only patterns that match and confirm users’ previous verbalizations but also strategic patterns that remain hidden in interviews and observation studies [32]. This type of massive interaction data, “big data”, will require new types of methods to be used in the gathering and analysis of user data for remotely collecting and analyzing user interactions with online clinical information resources (e.g. clinical guidelines) and the increasingly varied range of health information systems being deployed online.
7 Conclusion
The increasingly widespread adoption of health information systems is well underway in many countries around the world. In this paper, we have described approaches taken in three countries to collecting and analyzing data about usability collected regionally as well as nationally. There is an increasing need to share information about system usability at the local, national and more recently at the international level. Along with these trends, there are emerging efforts to collecting usability data that can be used to compare systems across the regions of a country and within an entire country. Methods that have been employed have ranged from qualitative usability analyses (as described for ongoing work in Denmark) to deployment of on-line questionnaires to all physicians within a country (as described in Finland). In addition, with the increase in deployment of system functionality as on-line Web-based services, new methods will be needed to remotely and automatically collect, collate and analyze large amounts of user interaction data in order to improve system design, implementation as well as system selection and procurement.
References
- 1.Nielsen J. Usability engineering. San Diego: Academic Press, Inc.; 1993. [Google Scholar]
- 2.Shackel B, Richardson S, Human factors for informatics usability. New York: Cambridge University Press; 1991. [Google Scholar]
- 3.Kushniruk AW, Patel V. Cognitive and usability engineering approaches to the evaluation of clinical information systems. J Biomed Inform 2004;37(1):56–76. [DOI] [PubMed] [Google Scholar]
- 4.Beuscart-Zéphir MC, Pelayo S, Ancequx F, Meaux J, Degroisse M, Degoulet P. Impact of CPOE on doctor–nurse cooperation for the medication ordering and administration process. Int J Med Inform 2005;74(7): 629–41. [DOI] [PubMed] [Google Scholar]
- 5.Kaufman DR, Patel VL, Hiliman PC, Morin J, Pevzner RS, Weinstock RG, et al. Usability in the real world: assessing medical information technologies in patients’ homes. J Biomed Inform 2003;36(1):45–60. [DOI] [PubMed] [Google Scholar]
- 6.Zhang J, Johnson TR, Patel VL, Paige DL, Kubose T. Using usability heuristics to evaluate patient safety of medical devices. J Biomed Inform 2003;36(1): 23–30. [DOI] [PubMed] [Google Scholar]
- 7.Kjeldskov J, Skov M, Stage J. Instant data analysis: Conducting usability evaluations in a day. Nordi-CHI ’04, October 23-27, 2004Tampere, Finland; 2004. [Google Scholar]
- 8.Kushniruk AW, Triola M, Borycki EM, Stein B, Kannry J. Technology induced error and usability: The relationship between usability problems and prescription errors when using a handheld application. Int J Med Inform 2005;74(7-8):519–26. [DOI] [PubMed] [Google Scholar]
- 9.Winblad I, Reponen J, Hämäläinen P, Kangas M. Informaatio- ja kommunikaatioteknologian käyttö Suomen terveydenhuollossa vuonna 2007. Tilanne ja kehityksen suunta. Stakesin raportteja 37/2008. [Health Care ICT and eHealth in Finland 2007. Status report and future trends. Reports 37/2008] Helsinki: 2008. http://www.stakes.fi/verkkojulkaisut/raportit/R37-2008-VERKKO.pdf. In Finnish. [Google Scholar]
- 10.Lääveri T, Virtanen A, Paajanen H, Ahtola H, Konki K. Potilaskertomusjärjestelmien käytettävyysselvitys osoitti: Lääkärien mielipiteitä ei ole kuunneltu. [Study on Usability of Electronic Health Record Systems Shows: Physicians’ Opinions Have Been Ignored]. Finnish Medical Journal 6, 2008, additional part on Electronic health record systems, 3–33 In Finnish. [Google Scholar]
- 11.Viitanen J, Hyppönen H, Lääveri T, Vänskä J, Reponen J, Winblad I. National questionnaire study on clinical ICT systems proofs: Physicians suffer from poor usability. Int J Med Inform 2011;80(10):708–25. [DOI] [PubMed] [Google Scholar]
- 12.Hyppönen H, Faxvaag A, Gilstad H, Hardardottir G, Jerlvall L, Kangas M, et al. Nordic eHealth indicators. Organization of research, first results and the plan for the future. TemaNord 2013:522, http://dx.doi.org/10.6027/TN2013-522, Accessed 5.2.2014 [PubMed] [Google Scholar]
- 13.Viitanen J, Nieminen M, Hyppönen H, Lääveri T. Finnish physicians’ experiences with computer-supported patient information exchange and communication in clinical work. Int J Electron Healthc 2011;6(2-4):153–73. [DOI] [PubMed] [Google Scholar]
- 14.Martikainen S, Viitanen J, Korpela M, Lääveri T. Physicians’ experiences of participation in healthcare IT development: Willing but not able. Int J Med Inform 2012;81(2):98–113. [DOI] [PubMed] [Google Scholar]
- 15.Act on the electronic processing of client data in social and health care services. Available (in Finnish and Swedish) from http://plus.edilex.fi/kela/fi/lainsaadanto/20070159. Accessed 5.2.2014
- 16.Hyppönen H, Doupi P, Hämäläinen P, Komulainen J, Nykänen P, Suomi R. Towards a national health information system evaluation. Stud Health Technol Inform 2010;160(2):1216–20. [PubMed] [Google Scholar]
- 17.Hyppönen H, Faxvaag A, Gilstad H, Hardardottir GA, Jerlvall L, Kangas M, et al. Nordic eHealth indicators: organization of research, first results and plan for the future. Stud Health Technol Inform 2013;192:273–7. [PubMed] [Google Scholar]
- 18.National Physician Survey, 2010, Retrieved from: http:www.nationalphysiciansurvey.ca
- 19.Kushniruk A, Owston R, Ho F, Pitts K, Wideman H, Brown C, et al. Design of the VULab: A quantitative and qualitative tool for analyzing use of on-line health information resources. Proceedings of ITCH 2007; February2007. [Google Scholar]
- 20.Kushniruk AW, Patel C, Patel VL, Cimino JJ. “Televaluation” of information systems: An integrative approach to design and evaluation of Web-based systems. Int J Med Inform 2001;61(1):45–70. [DOI] [PubMed] [Google Scholar]
- 21.Felciano RM, Altman RB. Lamprey: Tracking users on the World Wide Web. In:Proceedings of the 1996 AMIA Ann Fall Symposium; 1996. p. 757–61. [PMC free article] [PubMed] [Google Scholar]
- 22.Kushniruk A, Beuscart-Zéphir MC, Grzes A, Borycki EM, Watbled L, Kannry J. Increasing the safety of healthcare information systems through improved procurement: Toward a framework for selection of safe healthcare systems. Healthc Q 2010;13:53–8. [DOI] [PubMed] [Google Scholar]
- 23.Carvalho CJ, Borycki EM, Kushniruk A. Ensuring the safety of health information systems: Using heuristics for patient safety. Healthc Q 2009;12:49–54. [DOI] [PubMed] [Google Scholar]
- 24.Schumacher RM, Webb JM, Johnson KR. How to select an electronic health record system that healthcare professionals can use. User centric, Inc.; 2009. Available from: http://www.usercentric.com/sites/usercentric.com/files/usercentric-ehr-white-paper.pdf [Google Scholar]
- 25.Jokela T, Laine J, Nieminen M. Usability in RFP’s: The current practice and outline for the future. Lecture notes in computer science; 2013, vol. 8005 p. 101–6 Available online from: http://link.springer. com/chapter/10.1007%2F978-3-642-39262-7_12. [Google Scholar]
- 26.ISO 9241-11/ISO 9241 Ergonomic requirements for office work with visual display terminals, Part 11: Guidance on Usability. Geneve: International Organization for Standardization, Geneve; 1998. [Google Scholar]
- 27.ISO 9241-210 International Standard: Ergonomics of human-system interaction – Part 210: Human-centred Design for Interactive Systems. First edition2010-03-15, 2010. Reference number ISO 9241-210:2010(E). [Google Scholar]
- 28.Hertzum M. Images of usability. Int J Human-Comp Interact 2010;26:567–600. [Google Scholar]
- 29.Davis LS. Problems facing large health information systems. Proceedings of the Annual ACM Conference, 1973, Atlanta, USA. New York, NY, USA: ACM; 1973. [Google Scholar]
- 30.DeLone WH, McLean ER. TheDelone and McLean model of information systems success: A ten-year update. Journal of Management Information Systems 2003;19:9–30. [Google Scholar]
- 31.Cooper A. Inmates are running the asylum: Why high-tech products drive us crazy and how to restore the sanity. Sams Publishing; 1998. [Google Scholar]
- 32.Fern X, Komireddy C, Grigoreanu V, Burnett M. Mining problem-solving strategies from HCI data. Trans Comput Hum Interact 2010:17(1). [Google Scholar]
- 33.Microsoft Health. Common User Interface. http://www.mscui.net Accessed May 4 2014. [Google Scholar]