

Abstract
Strong evidence implicates prefrontal cortex (PFC) as a major source of functional impairment in severe mental illness such as schizophrenia. Numerous schizophrenia studies report deficits in PFC structure, activation, and functional connectivity in patients with chronic illness, suggesting that deficient PFC functional connectivity occurs in this disorder. However, the PFC functional connectivity patterns during illness onset and its longitudinal progression remain uncharacterized. Emerging evidence suggests that early-course schizophrenia involves increased PFC glutamate, which might elevate PFC functional connectivity. To test this hypothesis, we examined 129 non-medicated, human subjects diagnosed with early-course schizophrenia and 106 matched healthy human subjects using both whole-brain data-driven and hypothesis-driven PFC analyses of resting-state fMRI. We identified increased PFC connectivity in early-course patients, predictive of symptoms and diagnostic classification, but less evidence for “hypoconnectivity.” At the whole-brain level, we observed “hyperconnectivity” around areas centered on the default system, with modest overlap with PFC-specific effects. The PFC hyperconnectivity normalized for a subset of the sample followed longitudinally (n = 25), which also predicted immediate symptom improvement. Biologically informed computational modeling implicates altered overall connection strength in schizophrenia. The initial hyperconnectivity, which may decrease longitudinally, could have prognostic and therapeutic implications.
Keywords: computational modeling, first episode, hyperconnectivity, longitudinal, prefrontal cortex, schizophrenia
Introduction
Severe mental illness causes lifelong disability (Vos et al., 2012) and profound economic cost. Schizophrenia (SCZ) is one of the most disabling neuropsychiatric conditions in the world (Murray et al., 1996) and emerges in part from prefrontal cortex (PFC) impairments (Goldman-Rakic, 1991; Reichenberg et al., 2009; Barch and Ceaser, 2012). This is supported by postmortem studies (Gonzalez-Burgos and Lewis, 2012; Lewis et al., 2012) and neuroimaging studies examining structure (Cannon et al., 2002), task-based activation (Carter et al., 1998; Glahn et al., 2003; Barch and Ceaser, 2012), and functional connectivity (Cole et al., 2011a; Fornito et al., 2012). However, the emergence and progression of PFC dysfunction in SCZ remains to be fully characterized.
The prevailing view suggests that SCZ is associated with reductions in connectivity (Cho et al., 2006) and activation (Van Snellenberg et al., 2006), especially in the PFC (Cole et al., 2011a). However, most investigations marshaling this evidence studied patients with long-standing illness (Repovs et al., 2011; Fornito et al., 2012; Repovs and Barch, 2012). Therefore, studies have not explored PFC dysfunction associated with SCZ onset and its progressive dynamics (Insel, 2010; Uhlhaas, 2013). Meta-analyses report declining gray and white matter integrity (Mathalon et al., 2001; Chan et al., 2011) and altered cortical glutamate levels (Marsman et al., 2013) across illness stages. Emerging findings suggest PFC and hippocampal hyperactivity during initial illness stages, followed by subsequent decline (Marsman et al., 2013; Schobel et al., 2013; Sun et al., 2013). Therefore, early-course SCZ might be associated with elevated excitation (E) and inhibition (I) balance in cortical circuits, consistent with disinhibition (Uhlhaas, 2013). It remains unknown whether initial SCZ stages exhibit increases (or reductions) in PFC functional connectivity and whether such patterns show progressive longitudinal change.
Emerging methods allow for examining functional connectivity by studying low-frequency fluctuations in the blood-oxygenation-level-dependent (BOLD) signal at rest (i.e., rs-fcMRI; Biswal et al., 2010), an approach increasingly applied to neuropsychiatric illness (Fox and Greicius, 2010; Palaniyappan et al., 2013). To search for PFC hyperconnectivity in early-course SCZ, we used a well established data-driven metric called global brain connectivity (GBC; Cole et al., 2012), which has been successfully applied across psychiatric conditions (Anticevic et al., 2013; Anticevic et al., 2014b). This is the first study to apply such GBC methods to characterize PFC functional connectivity in recent onset SCZ and its longitudinal course.
We studied 129 medication-free patients and investigated whether early-course SCZ is associated with increased PFC and whole-brain functional connectivity compared with healthy subjects. Second, we investigated whether the identified results predicted symptoms and diagnostic classification. Next, we characterized longitudinal PFC connectivity at 12-month follow-up, quantified the relationships between connectivity patterns over time and symptom improvement, and conducted targeted corticostriatal analyses to examine mechanisms of longitudinal connectivity normalization in response to treatment. Finally, we extended a microcircuit computational model (Wong and Wang, 2006) to implement biologically plausible BOLD signal connectivity and to explore synaptic parameters that could affect global connectivity, as observed clinically. We hypothesized that biologically based computational parameter alterations affecting E/I balance may capture clinical effects.
Materials and Methods
Participants
All participants were recruited via the Mental Health Center and imaged at the Huaxi MR Research Center (HMRRC), Department of Radiology, West China Hospital, Chengdu, China. All participants signed the informed consent approved by the Institutional Review Board (IRB) of West China Hospital. All reported analyses were also approved by the Yale IRB. All patients, of either sex included in the study had to meet diagnostic criteria for SCZ according to DSM-IV criteria, but no other Axis I disorders. All diagnoses were confirmed between the attending psychiatrist and a trained interviewer. Diagnoses for all patients were confirmed at 12-month follow-up. Duration of illness was calculated by deducting each patient's age at first symptom onset from his or her age at the time of the scan. Age of symptom onset was self-reported by participants and confirmed by secondary sources (medical records and reports from relatives). The majority of patients met criteria for early-course schizophrenia (EC-SCZ), defined as falling within 1 year of initial symptom presentation (see Table 1 for details on demographics and mean illness duration).
Table 1.
Clinical and demographic characteristics
| Characteristic | HCS (n = 106) |
Baseline SCZ (n = 129) |
Baseline (with 12 mo followup) SCZ (n = 25) |
At 12 mo followup SCZ (n = 25) |
(i) HCS vs SCZ all subjects (baseline) Significance |
(ii) HCS vs SCZ 12 mo (matched, n = 25) Significance |
(iii) SCZ (n = 106) vs SCZ (n = 25) at baseline Significance |
(iv) SCZ baseline vs 12 mo (n = 25) Significance |
||||||||
|---|---|---|---|---|---|---|---|---|---|---|---|---|---|---|---|---|
| M | SD | M | SD | M | SD | M | SD | p | T/χ2 | p | T/χ2 | p | T/χ2 | p | T/χ2 | |
| Age (y) | 26.30 | 9.45 | 24.29 | 7.88 | 23.60 | 9.22 | 24.56 | 9.22 | 0.08 | 1.77 | 0.90 | 0.13 | 0.63 | 0.49 | — | — |
| Sex (% male) | 48 | — | 43 | — | 20 | — | 20 | — | 0.47 | 0.72 | 0.34 | 0.96 | 0.01 | 2.68* | — | — |
| Education (y) | 12.47 | 3.27 | 12.47 | 3.13 | 12.04 | 2.70 | 12.04 | 2.70 | 0.99 | 0.01 | 0.81 | 0.25 | 0.45 | 0.76 | — | — |
| Handedness (% right) | 100 | — | 100 | — | 100 | — | 100 | — | 1 | 0 | 0 | 1 | 1 | 0 | — | — |
| Signal-to-noise (SNR) | 181.91 | 43.06 | 181.97 | 46.00 | 180.59 | 51.58 | 196.94 | 52.06 | 0.99 | 0.01 | 0.40 | 0.85 | 0.87 | 0.17 | 0.18 | 1.38 |
| Frames scrubbed (T) (%) | 5.74 | 9.03 | 5.88 | 9.24 | 4.78 | 7.83 | 5.64 | 7.47 | 0.9 | 0.11 | 0.85 | 0.19 | 0.51 | 0.66 | 0.72 | 0.37 |
| Medication (CPZ equivalents) | — | — | — | — | — | — | 168.83 | 184.68 | — | — | — | — | — | — | — | — |
| Illness duration (mo) | — | — | 12.62 | 21.58 | 9.10 | 13.70 | 21.10 | 13.70 | — | — | — | — | — | — | — | — |
| GAF scores | — | — | 29.22 | 10.73 | 30.96 | 11.97 | 61.00 | 23.36 | — | — | — | 0.37 | 0.90 | 0.0001 | 4.87* | |
| PANSS positive symptoms | — | — | 24.50 | 6.63 | 22.44 | 5.94 | 12.17 | 7.33 | — | — | — | — | 0.08 | 1.74 | 0.0000 | 5.75* |
| PANSS negative symptoms | — | — | 18.88 | 8.33 | 18.56 | 5.83 | 12.71 | 4.94 | — | — | — | — | 0.83 | 0.22 | 0.0005 | 4.02* |
| PANSS general psychopathology | — | — | 46.73 | 9.63 | 46.44 | 8.92 | 29.63 | 11.94 | — | — | — | — | 0.87 | 0.17 | 0.0000 | 6.52* |
| PANSS thought disturbance | — | — | 13.76 | 4.07 | 11.68 | 3.12 | 6.83 | 4.10 | — | — | — | — | 0.00 | 2.93 | 0.0002 | 4.4* |
| PANSS activation | — | — | 9.19 | 3.35 | 8.56 | 3.20 | 5.63 | 2.68 | — | — | — | — | 0.29 | 1.05 | 0.0009 | 3.81* |
| PANSS paranoid | — | — | 10.10 | 2.87 | 10.32 | 3.09 | 5.17 | 3.05 | — | — | — | — | 0.67 | 0.42 | 0.0000 | 7.21* |
| PANSS depression | — | — | 8.71 | 3.88 | 8.52 | 3.48 | 6.42 | 2.78 | — | — | — | — | 0.79 | 0.27 | 0.0016 | 3.58* |
| PANSS anergia | — | — | 8.93 | 4.44 | 8.68 | 3.21 | 6.63 | 2.41 | — | — | — | — | 0.76 | 0.31 | 0.0015 | 3.59* |
| PANSS impulsive aggression | — | — | 15.93 | 5.04 | 15.08 | 5.83 | 9.17 | 4.61 | — | — | — | — | 0.35 | 0.94 | 0.0001 | 4.92* |
| PANSS total psychopathology | — | — | 95.88 | 19.99 | 94.68 | 16.86 | 58.88 | 24.81 | — | — | — | — | 0.74 | 0.33 | 0.0000 | 6.24* |
Participants had no current or past alcohol/drug abuse/dependence. The statistical comparisons reflect four different tests that allow interpretation of the demographics for the complete EC-SCZ sample studied at baseline (n = 106) and specifically patients who were followed longitudinally (n = 25 EC-SCZ scanned at baseline and at 12 mo follow-up): (i) comparison of all HCS and EC-SCZ at baseline; (ii) comparison of a subset of matched HCS and those EC-SCZ that received a longitudinal scan (n = 25); (iii) comparison of those EC-SCZ subjects at baseline who did not receive a longitudinal scan (n = 106) versus those who did (n = 25), illustrating comparable profiles (this comparison, however, revealed a difference in gender proportion, but no differences across any other measures, indicating that the subsample followed longitudinally is highly comparable to the complete sample studied at baseline) and (iv) paired t test comparison of EC-SCZ at baseline versus 12 mo follow-up (this analysis revealed a significant improvement across all symptoms for n = 25 patients who received longitudinal follow-up; we specifically quantified this symptom improvement in relation to longitudinally altered PFC rGBC; Fig. 8). CPZ, chlorpromazine; GAF, global assessment of functioning; PANSS, Positive and Negative Symptom Scale.
* Significant T or χ2 statistic for the between-group comparison.
The final sample included 129 patients out of which N = 93 were within 1 year of their illness onset (mean illness duration 2.4 months). All other patients (N = 36) had somewhat longer untreated psychosis (mean illness duration 37 months). Healthy comparison subjects (HCS) were recruited from the local area via poster advertisement and screened using the SCID-Non-Patient Version to confirm the lifetime absence of psychiatric and neurological illness. HCS were also interviewed to confirm that there was no history of psychiatric illness among their first-degree relatives. The final sample included 106 HCS with no current or lifetime Axis I psychiatric disorders (determined by a psychiatrist), no history of any serious medical or neurological conditions, and no history of psychotic, mood, or other Axis I disorders in first-degree relatives. Participants were not excluded based on the history of nicotine or alcohol use (to provide a more representative clinical sample). However, current nicotine, alcohol, or drug abuse/dependence was not allowed. No participants reported past history of alcohol or drug dependence. All HCS subjects were mean-matched to the clinical group by age, sex, ethnicity, handedness (based on the Annett Handedness Scale; Dragovic and Hammond, 2007), and neuroimaging quality-assurance metrics (see Table 1 and Neuroimaging Processing and Analysis section). Additional exclusion criteria were identical across groups and included history of neurological conditions (e.g., epilepsy, migraine, head trauma with loss of consciousness), MRI contraindications, alcohol/drug abuse, pregnancy, or any concomitant major medical disorder. All clinical symptom ratings were obtained by two experienced clinical psychiatrists before initiating any treatment or neuroimaging examinations. An experienced neuroradiologist inspected all scans; no gross abnormalities were observed in either group. All patients were evaluated using the Global Assessment of Functioning Scale (GAF) based on the DSM-IV. All EC-SCZ individuals were medication free at the time of the baseline scan; therefore, present findings cannot be related to medication status.
Longitudinal patient evaluation
We followed a subset of individuals diagnosed with EC-SCZ longitudinally. In the present investigation, we report available data from 31 patients at 12-month follow-up after the baseline assessment. At follow-up assessment, all clinical and neuroimaging measures were collected as done at baseline. Given that it is ethically prohibited to withhold treatment, some of the EC-SCZ patients were receiving medication at the time of the follow-up visit. If medication was received, we converted individual patient medication levels to chlorpromazine equivalents via standard approaches (Andreasen et al., 2010). All EC-SCZ patients who were followed longitudinally had to meet identical neuroimaging quality-assurance stringency as applied at baseline (see Neuroimaging Preprocessing and Analysis section). Following quality assurance measures, we identified 25 EC-SCZ patients with neuroimaging data of sufficient quality that satisfied our stringent criteria (for details, see Neuroimaging acquisition, below). These subjects were included in the final longitudinal analyses. HCS did not receive longitudinal follow-up. Instead, where appropriate, we randomly sampled a set of 25 HCS who were demographically matched to the subset of patients who received 12-month longitudinal follow-up. Patients included in the longitudinal analysis were those from the baseline cohort who had completed the longitudinal assessment for this ongoing study at the time. Therefore, the results of the longitudinal analysis reported here represent the findings of an interim analysis, which will be repeated later when the study is completed.
Neuroimaging acquisition
All imaging data were acquired on a state-of-the-art 3T magnetic resonance (MR) scanner at the HMRRC Department of Radiology, West China Hospital (EXCITE; General Electric). We used an eight-channel phase array head coil with foam padding to minimize head motion. All participants were instructed to rest during scanning, but were monitored to ensure that they stayed awake. Specifically, all subjects were routinely monitored through a video camera in the scanner console room and observed from the console room by trained staff. After each brief scan, subjects were contacted by the study staff via a headphone set and explicitly asked about their functional status, any reported discomfort, level of wakefulness, etc. Critically, no participants reported falling asleep during the scan when routinely asked immediately after scanning. High-resolution images were acquired using a T1-weighted, 3D fast spoiled gradient-echo sequence with the following parameters: TR/TE = 8.5/3.4 ms, flip angle = 12°, voxel size = 0.47 × 0.47 × 1 mm3, field of view = 240 × 240 mm, with 156 contiguous coronal slices. BOLD images were acquired using a T2*-weighted gradient-echo planar imaging sequence with the following parameters: TR/TE = 2000/30 ms, flip angle = 90°, voxel size = 3.75 × 3.75 × 5 mm [no slice gap], field of view = 240 × 240 mm, with 30 axial slices parallel to the AC-PC line. BOLD acquisition lasted 6.66 min and produced 200 volumetric images per subject.
Neuroimaging preprocessing and analysis
All preprocessing, quality assurance, and connectivity analyses followed our prior validated and published approaches that were applied to clinical populations (Cole et al., 2011a; Anticevic et al., 2013). We first performed the following preprocessing steps for all BOLD images, as done in our prior studies (Cole et al., 2011a; Anticevic et al., 2013): (1) slice-time correction, (2) first five images removed from each run, (3) rigid body motion correction, (4) 12-parameter affine transform of the structural image to the Talairach coordinate system, and (5) coregistration of volumes to the structural image with 3 × 3 × 3 mm resampling.
In addition, all BOLD images had to pass stringent quality assurance criteria to ensure that all data were of high and comparable quality across groups: (1) signal-to-noise ratios (SNRs) >100, computed by obtaining the mean signal and SD for a given slice across the BOLD run while excluding all nonbrain voxels across all frames (Anticevic et al., 2013); (2) no BOLD run with a single frame movement >1 functional voxel; and (3) movement scrubbing as recommended by Power et al. (2012, 2013). As described previously (Anticevic et al., 2012b), all image frames with possible movement-induced artifactual fluctuations in intensity were identified via two criteria: first, frames in which the sum of the displacement across all 6 rigid body movement correction parameters exceeded 0.5 mm (assuming 50 mm cortical sphere radius) were identified. Second, root mean square (RMS) of differences in intensity between the current and preceding frame was computed across all voxels and divided by mean intensity. Frames in which normalized RMS exceeded 1.6 times the median across scans were identified. The frames flagged by either criterion, as well as the one frame preceding and two frames following each flagged frame, were marked for exclusion (logical or). Subjects with >50% frames flagged were completely excluded from all analyses. All of the included subjects in the final samples passed these criteria (N = 129 EC-SCZ; N = 106 HCS reported in Table 1). Based on these two criteria we excluded 8 patients and 10 healthy comparison subjects from the final analysis.
The final included images had high SNR values with no between-group differences (HCS-mean = 181.91 and EC-SCZ-mean = 181.97, p = 0.99, NS). Moreover, all participants fulfilled the described movement-scrubbing criteria, and there were no significant between-group differences in the mean proportions of removed frames across groups (HCS-proportion-flagged = 5.74 and EC-SCZ-proportion-flagged = 5.88, p = 0.90, NS).
Lastly, to remove potential sources of spurious signal in resting-state data, we completed additional preprocessing steps, as is standard practice (Biswal et al., 2010): all BOLD time series underwent high-pass (0.009 Hz) and low-pass (0.08 Hz) temporal filtering, nuisance signal removal from ventricles and deep white matter, global signal regression (GSR, see below), six rigid-body motion correction parameters, and their first derivatives using in-house MATLAB tools (Repovs et al., 2011).
GSR
GSR was performed using standard procedures (Fox et al., 2005) by calculating mean raw BOLD signal averaged over all voxels for each time point, explicitly excluding ventricles and white matter (which are defined as separate nuisance regressors). The GS and its first derivative (with respect to time) were used as nuisance predictor terms within a multiple linear regression model along with other nuisance predictor terms (ventricular signal, white matter signal, movement parameters, and the first derivatives of each of these, as noted above). Because of emerging findings suggesting that chronic SCZ patients exhibit elevated GS variability (Yang et al., 2014), we separately examined results without GSR implemented; all effects remained unchanged (see Fig. 3). This demonstration is particularly important given recent reports suggesting that, in chronic SCZ patients, the GS may be abnormally elevated (Gotts et al., 2013; Yang et al., 2014), which could in turn transform GBC analyses. Based on that effect, we recommended that clinical analyses should be repeated without GSR to ensure robustness of main effects, as demonstrated here (cf Figs. 1, 3, 13).
Figure 3.

Effects without GSR remain unchanged. a–c, Effects as in Figures 1 and 2, only without GSR applied, illustrating a consistent pattern of core clinical effects. Clusters mark regions surviving an independent samples t test comparing patients with schizophrenia early in their illness course (EC-SCZ, N = 129) to HCS. d–g, Effects at lower thresholds also remained qualitatively unchanged without GSR (as in Fig. 2). Error bars mark ± 1 SEM. This demonstration is particularly important given recent reports that the global signal may show elevated variability in chronic SCZ patients, which could possibly affect between-group analyses in complex ways (Yang et al., 2014). All p-values are 2-tailed. ****p < 0.0001; ***p < 0.001; **p < 0.01; *p < 0.05.
Figure 1.

PFC connectivity is increased in EC-SCZ. a, Clusters mark regions surviving an independent samples t test comparing patients with schizophrenia early in their illness course (EC-SCZ, N = 129) with HCS (N = 106). b, c, Signal was extracted from all clusters showing a significant effect in a to characterize the magnitude and distribution of the main effect. Effects indicate a highly robust increase in PFC rGBC for EC-SCZ relative to HCS, verified via formal effect sizes computed across subjects (Cohen's d = 0.84). Gray vertical dashed line in c marks the mean for the HCS group. For all region coordinates and relevant statistics, see Table 2. Error bars mark ± 1 SEM. All p-values are 2-tailed. ***p < 0.001; **p < 0.01; *p < 0.05.
Figure 13.

Examining PFC BOLD signal variability and PFC rGBC using non-normalized covariance. The modeling simulations revealed that the in silico derived GBC decreased as a function of increasing σ (i.e., the noise parameter, see Fig. 12b, right). This effect in particular illustrates that elevated GBC is not a generic property of any chosen parameter, but rather reflects an increase in key signal-bearing w/G parameters. However, it is possible that, in vivo, there is actually a decrease in PFC-wide variance of BOLD signals in EC-SCZ. This is particularly relevant to the modeling simulations because a decrease in BOLD signal variability in EC-SCZ relative to HCS would by definition produce an increased correlation (and would therefore result in a profile of hyperconnectivity in EC-SCZ mathematically). However, such a result would not actually reflect an aberrant increase in signal covariance, as predicted by the model. a–c, We first examined whether the PFC-derived BOLD signal exhibited differences in variance structure between EC-SCZ and HCS groups. There were no between-group effects in mean PFC variance without GSR (t(235) = 1.02, p = 0.3) or after GSR (t(235) = 1.2, p = 0.23), suggesting no differences in overall PFC BOLD signal variability profiles. Moreover, when examining voxelwise effects (see map in a), the areas where the variance was mostly decreased in EC-SCZ (blue) did not overlap with areas where there was hyperconnectivity (red). This indicates that the PFC hyperconnectivity reported in Figure 1 cannot be driven exclusively by lower variance in EC-SCZ, which would by definition increase the correlation coefficient. d, Further, we computed a non-normalized covariance as an index of rGBC (as opposed to a correlation coefficient) within the discovered regions to fully establish that between-group clinical comparisons did not arise due to nonshared sources of variability (Friston, 2011). That is, the correlation coefficient normalizes the covariance between signals by using the variance of each of the signals, whereas the covariance analysis only considers the shared signal. e, f, Covariance results still indicated robust hyperconnectivity in EC-SCZ, both without GSR (t(235) = 2.3, p < 0.026; e) and after GSR (t(235) = 4.4, p < 0.00001; f). This effect is consistent with the abnormally increased GBC in silico, supporting the conclusion that hyperconnectivity effects in patients cannot be driven by a PFC BOLD signal variability reduction. Error bars mark ± 1 SEM. ***p < 0.001; **p < 0.01; *p < 0.05.
GBC analyses
The GBC approach (Cole et al., 2010; Cole et al., 2011a) was applied using in-house MATLAB tools, here either restricted to the PFC (see Fig. 1) or extended across all gray matter voxels in the brain (see Fig. 4). Although GBC is designed to estimate the connectivity between each individual voxel and every other voxel in the brain, restricted GBC is optimized to estimate connectivity at every voxel with every other voxel in a specific restricted space (referred to as restricted GBC or rGBC). Although we conducted a whole-brain GBC search (see Fig. 4), the main focus here was on the PFC rGBC metric for the following a priori reasons. First, both theoretical models and empirical studies of schizophrenia progression have emphasized disturbances in PFC network integrity (Goldman-Rakic, 1991). Given these models, we opted for a PFC-centric analysis as an initial starting GBC point to remain maximally sensitive to possible alterations in PFC networks. Second, the use of a restricted PFC search space provided more statistical power to observe baseline clinical effects as well as less powered longitudinal effects (N = 25) given the more stringent multiple comparisons needed for a whole-brain data-driven analysis. Nevertheless, we acknowledge that a whole-brain search was vital to place PFC effects in a broader context. To this end, we also provide whole-brain GBC effects, which we treat as more provisional/exploratory. Finally, we opted for a similar PFC rGBC analytic strategy in several prior clinical investigations focusing on chronic patients with schizophrenia (Cole et al., 2011a; Anticevic et al., 2014c) and psychotic bipolar patients (Anticevic et al., 2013). Therefore, this study represents a programmatic extension of such efforts to map PFC dysconnectivity in schizophrenia and psychotic bipolar illness, focusing here on early illness course and its longitudinal progression. Therefore, we chose the same methodological approach to remain consistent with reported discoveries and to provide a direct extension of this existing body of work. Collectively, PFC rGBC provides a sensitive measure by computing correlational strength of each voxel with all other voxels being considered within the defined search space (e.g., PFC).
Figure 4.

Comparing PFC and whole-brain (WB) GBC results. The principal findings revealed robustly increased PFC rGBC in EC-SCZ, but little evidence for PFC hypoconnectivity. It remains unknown whether areas identified within the PFC are indeed specific to the restricted analysis or instead represent a more general feature when the analyses are extended to all voxels (i.e., whole-brain GBC). To test this question, we directly juxtaposed threshold-free cluster enhancement (TFCE; Smith and Nichols, 2009) corrected volume and surface maps of group differences between EC-SCZ patients and matched HCS. a, b, Results are shown for the PFC analysis (as in Fig. 1). Here, red foci mark regions where SCZ showed statistically higher PFC rGBC than HCS. c, d, Results are shown for the WB GBC analysis. Red foci mark regions where patients showed statistically higher WB GBC than HCS, whereas blue foci show regions where patients show statistically lower WB GBC than HCS. Results indicated both increased and decreased WB GBC when extending analyses across all voxels; however, the clusters evident for the PFC analyses were not present to the same extent for the WB analyses. e–f, To highlight the relatively small degree of overlap between the analyses, we computed a conjunction between the WB (orange areas) and the PFC effects (yellow areas); overlap is shown in red. g, h, Results are shown for the WB GBC analysis at a lower statistical threshold. Red foci mark regions where patients showed statistically higher WB GBC than HCS, whereas blue foci show regions where patients show statistically lower WB GBC than HCS. The clusters evident for the PFC analyses were not present to the same extent even for these lower threshold analyses. Top panels show the results in a volume representation, whereas bottom panels show the same data mapped onto a surface representation.
As described previously in several clinical studies (Cole et al., 2011a; Anticevic et al., 2013; Anticevic et al., 2014b), we conducted rGBC analysis restricted to voxels within subject-specific, anatomically defined prefrontal gray matter masks defined via Freesurfer software (Fischl et al., 2002). We included the following labels extracted from the aparc+aseg FreeSurfer segmentation: Bilateral Caudal Anterior Cingulate Cortex (codes 1002, 2002), Caudal Middle Frontal Cortex (codes 1003, 2003), Lateral Orbitofrontal Cortex (codes 1012, 2012), Medial Orbitofrontal Cortex (codes 1014, 2014), Inferior Frontal Cortex - Pars Opercularis (codes 1018, 2018), Inferior Frontal Cortex - Pars Orbitalis (codes 1019, 2019), Inferior Frontal Cortex - Pars Triangularis (codes 1020, 2020), Rostral Anterior Cingulate Cortex (codes 1026, 2026), Rostral Middle Frontal Cortex (codes 1027, 2027), Superior Frontal Cortex (codes 1028, 2028), and the Frontal Pole (codes 1032, 2032). The final PFC mask consisted of 18229 voxels. Whole-brain GBC included all FreeSurfer segmented gray-matter voxels.
All Freesurfer segmentations were visually inspected for quality by a trained rater (A.A.). Before GBC analysis, BOLD signal within the subject-specific cortical or PFC mask was spatially smoothed with a 6 mm full-width-at-half-maximum Gaussian kernel and dilated by 2 voxels (6 mm) to account for individual differences in anatomy. Finally, for each PFC or whole-brain voxel, we computed a correlation with every other PFC or whole-brain voxel, transformed the correlations to Fisher z-values, and finally computed their mean. This calculation yielded an rGBC map for each subject in which each voxel value represents the mean connectivity of that voxel with the rest of PFC (or for GBC all other gray matter voxels in the brain). We also verified that differences in variance of BOLD signals did not drive our GBC results, as predicted by our prior computational modeling work (Yang et al., 2014). To this end, we computed GBC using a non-normalized covariance measure (see Fig. 13), which did not alter effects. To compute specificity of PFC rGBC effects, we also extended the GBC analyses across all gray matter voxels (i.e., whole-brain GBC), which we detail below. Appropriate type I error correction for each comparison was computed via FSL's Randomize tool (see Second-Level Group Comparisons section).
Hypothesis-driven striatal connectivity analyses to characterize longitudinal normalization in PFC connectivity
We identified dissociable longitudinal alterations in PFC rGBC for the medial PFC (MPFC) and lateral PFC (LPFC) regions (see Figs. 8,9). Importantly, antipsychotic medication exerts its primary effects on the dorsal striatum, predominantly via D2 receptor blockage (Howes and Kapur, 2009). Therefore, we hypothesized that these “normalized” patterns of PFC connectivity may reflect dissociable connectivity with the dorsal striatum. We tested this in the following way. First, we identified each subject's anatomically defined dorsal striatum (caudate nucleus) via automated FreeSurfer segmentation. Next, we computed a group average across all subjects (including both HCS and SCZ) where there was at least 90% overlap in dorsal striatum anatomy. This generated an a priori, anatomically defined, and unbiased ROI based on the current sample. In turn, we extracted the signal out of bilaterally defined individual subject caudate nuclei for two different functional connectivity maps: caudate to MPFC connectivity and caudate to LPFC connectivity. This yielded a subject-specific connectivity between either caudate-MPFC or caudate-LPFC. We did so for patients at their baseline scans and patients at 12-month follow-up. Here, we tested the specific hypothesis that caudate-MPFC connectivity may be elevated at baseline and show a progressive reduction, whereas caudate-LPFC connectivity may be reduced at baseline and show a progressive increase after 12 months (see Fig. 10), perhaps reflecting a treatment-induced normalization. To quantify this predicted dissociation, we computed a second-level ANOVA with 2 repeated measures: Seed (LPFC vs MPFC) × Follow-up (Baseline vs 12-months) interaction (see Fig. 10).
Figure 8.
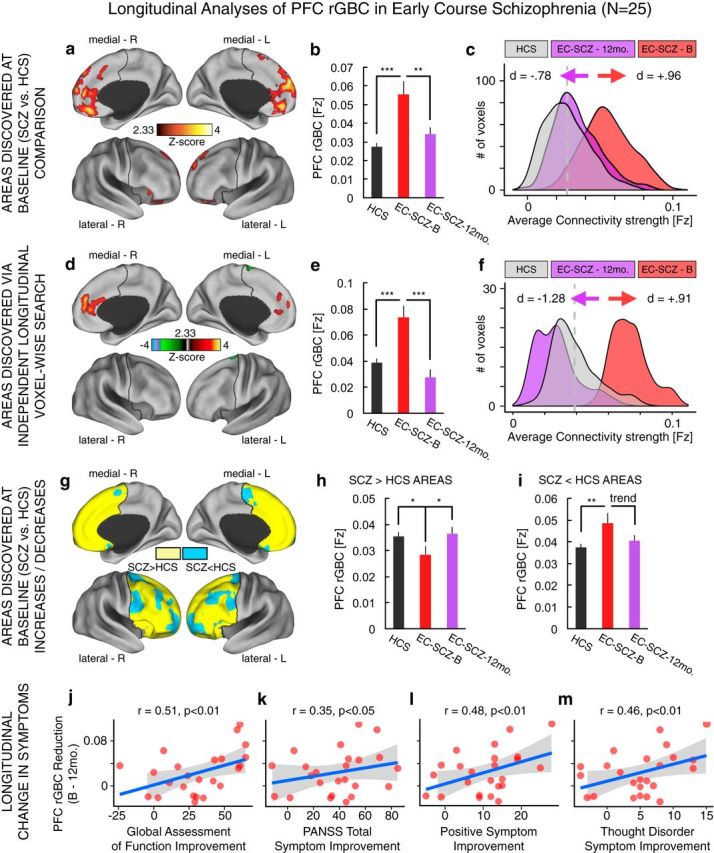
Longitudinal analyses of PFC rGBC in relation to symptom improvement. a, Effects as in Figure 1, indicating discovery results. b, c, When examining only voxels identified at baseline (Fig. 1), there was a significant longitudinal reduction in PFC rGBC in EC-SCZ at 12-month follow-up (EC-SCZ-12mo., N = 25, purple) relative to baseline scans (EC-SCZ-B, N = 25, red), quantified via formal effect sizes computed across subjects (Cohen's d = −0.78). d–f, The same pattern held when computing a PFC voxelwise search comparing patients' baseline scans with their scans at 12-month follow-up (Cohen's d = −1.28). g–i, The normalization in connectivity was evident when examining all regions where rGBC was increased in EC-SCZ relative to HCS at baseline (yellow areas) and decreased in EC-SCZ relative to HCS at baseline (blue areas; as in Fig. 2). j–m, The magnitude of PFC rGBC hyperconnectivity normalization was significantly related to symptom improvement at 12-month follow-up. The pattern was driven predominantly by a change in positive symptoms (negative symptoms did not show a significant relationship, r = 0.09, NS). Gray vertical dashed lines in distribution plots marks the mean for the HCS group. Error bars mark ± 1 SEM. PANSS, Positive and Negative Symptom Scale for SCZ (Kay et al., 1987). All p-values are 2-tailed. ***p < 0.001; **p < 0.01; *p < 0.05.
Figure 9.

Magnitude of baseline PFC rGBC predicts longitudinal improvement in connectivity and symptoms. a, b, The magnitude of PFC rGBC hyperconnectivity at baseline was highly significantly related to normalization in connectivity at 12-month follow-up (r = 0.88, p < 0.0001). c–f, The same relationship held for symptom improvement at 12-month follow-up. These effects illustrated that those patients with most severe PFC hyperconnectivity were those with most improvement in connectivity and symptoms after treatment was started. PANSS, Positive and Negative Symptom Scale for SCZ (Kay et al., 1987). All p-values are 2-tailed. ***p < 0.001; **p < 0.01; *p < 0.05.
Figure 10.

Longitudinal normalization of prefrontal-striatal connectivity. Using GBC analyses, we found a normalization of PFC rGBC at 12-month follow-up in two foci—left lateral PFC and medial PFC (see Fig. 8d). a, We examined connectivity between the MPFC region and the anatomically defined caudate ROI for EC-SCZ at baseline (EC-SCZ-B, N = 25, purple) versus EC-SCZ at 12-month follow-up (EC-SCZ-12mo., N = 25, purple; see Materials and Methods for details). b, Red foci show a caudate mask for which connectivity with MPFC was increased at baseline (EC-SCZ-B), but normalized at 12-month follow-up (EC-SCZ-12mo). c, Bar plot illustrating this reduction of MPFC-caudate connectivity at 12-month follow-up (t(23) = 3.6, p < 0.002; Cohen's d = 0.72). d, In turn, we examined connectivity from the LPFC region to anatomically defined caudate ROI for EC-SCZ-B versus EC-SCZ-12mo. e, Blue foci mark regions for which connectivity with LPFC was reduced at baseline (EC-SCZ-B), but normalized at 12-month follow-up (EC-SCZ-12mo). f, Bar plot illustrating this “increase” of LPFC-caudate connectivity at 12-month follow-up (t(23) = 3.82, p < 0.001; Cohen's d = −0.77). The dissociation was also verified by a significant Seed (LPFC vs MPFC) × Follow-up (Baseline vs 12-mo.) interaction (F(1,24) = 31.4, p = 9.1 × 10⁻⁶), indicating a differential pattern of connectivity normalization between lateral and medial PFC with caudate. Cohen's d values were corrected for correlation between repeated measures and reflect the effect size for the SCZ baseline versus 12-month follow-up comparison (within-subject comparison). Error bars mark ± 1 SEM. ***p < 0.001; **p < 0.01; *p < 0.05.
Seed-based analyses to characterize longitudinal normalization in connectivity
To better understand whole-brain effects, we also examined two specific seeds, which showed longitudinal alterations in functional connectivity at 12-month follow-up relative to baseline (see Fig. 11). The key purpose of this secondary analysis was to qualitatively highlight, at the whole-brain level, the possible dissociations in connectivity normalization across the LPFC and MPFC regions at 12-month follow-up. Here, it is important to show that the lateral and medial areas show unique disruptions of their respective whole-brain connectivity, which are distinct from within-PFC connectivity normalization. In other words, the focused striatal analyses above cannot determine whether these two regions exhibit normalized connectivity longitudinally that reflects a dissociable pattern with other brain regions.
Figure 11.

Qualitatively examining MPFC versus LPFC seeds showing longitudinal PFC rGBC normalization at 12-month follow-up. a, The two regions that exhibited longitudinal alterations in PFC rGBC when comparing patients at baseline (SCZ-B) versus the 12-month follow-up (SCZ-12.mo; same data as shown in Fig. 8d). Here, we explored the pattern of connectivity for each of the regions identified via PFC rGBC analyses—namely the LPFC (shown in green) and the MPFC (shown in red-yellow). We used these regions as seeds to compute a connectivity map for each patient at baseline and their 12-month follow-up scan. These analyses were conducted for exploratory reasons to further inform the pattern of normalization in connectivity at 12-month follow-up shown in Figure 10. b, Differences between SCZ-B and SCZ-12.mo for the MPFC seed. Red-orange foci mark regions where SCZ-B exhibited elevated MPFC connectivity relative to SCZ-12.mo, whereas blue foci mark regions where SCZ-B exhibited reduced MPFC connectivity relative to SCZ-12.mo. c, Differences between SCZ-B and SCZ-12.mo for the LPFC seed. Again, red-orange foci mark regions where SCZ-B exhibited elevated MPFC connectivity relative to SCZ-12.mo, whereas blue foci mark regions where SCZ-B exhibited reduced MPFC connectivity relative to SCZ-12.mo. Both maps are shown at a reduced threshold (p < 0.05, uncorrected) to better highlight the qualitative whole-brain dissociations in connectivity between the two seeds. For the MPFC seed, patients exhibited elevated connectivity with PFC, consistent with the main effect (orange box). However, for the LPFC seed, patients exhibited mainly reductions in connectivity with other PFC regions (blue box). The red and blue arrows in the third row highlight the dissociations in the dorsal striatum, which are presented in a focused a priori analysis based on hypothesized mechanisms of antipsychotic action (see Fig. 10). Collectively, these patterns highlight the dissociation in whole-brain patterns of normalization for the MPFC and LPFC seeds, which mirror the patterns presented specifically for the striatum.
To examine this issue, subject-specific whole-brain seed maps were computed by extracting the average time series across all voxels for a given seed (LPFC or MPFC) and computing its correlation with all other voxels in the brain. Next, we computed a Fisher r-to-Z transform, yielding a whole-brain connectivity map for each participant where each seed region's value represents its connectivity with all other voxels in the brain. To examine between-group differences, all individual-subject maps were entered into a second-level paired t test (i.e., SCZ at baseline vs SCZ at 12-month follow-up; see Fig. 11).
Second-level group comparisons
All second-level group analyses were computed on GBC correlation maps that were converted to Fisher z-maps or using covariance maps (to test for connectivity differences using a non-normalized statistical dependency measure; see Fig. 13). Collectively, we conducted several separate group-level analyses. We computed PFC rGBC differences between the EC-SCZ and HCS groups at baseline assessment (see Fig. 1) via an independent-samples t test. We computed PFC rGBC differences between 25 EC-SCZ patients at baseline and at 12-month follow-up via a paired-samples t test (see Figs. 8d–f, 10). Each of the PFC analyses was appropriately corrected for type I error within the PFC probabilistic mask defined anatomically via FreeSurfer (showing at least 20% overlap across all subjects). We extended the GBC analyses to the whole-brain level (i.e., all gray matter voxels) to test the specificity of PFC effects (see Fig. 4), again appropriately correcting for multiple comparisons. Type I error correction for a given analysis was ascertained via FSL's nonparametric Randomize tool with 10 000 permutations (Nichols and Holmes, 2002). Across analyses, we first performed a voxelwise two-sample t test and in turn applied a correction for multiple comparisons across the whole PFC (or whole-brain). We report clusters that survived this comparison (Tables 2, 3, 4). Results were then visualized using Caret 5.5 software (http://brainvis.wustl.edu/wiki/index.php/Caret:Download) and NeuroLens software (http://www.neurolens.org).
Table 2.
Region coordinates, p-values, and effect sizes: PFC rGBC with GSR
| X | Y | Z | Hemisphere | Anatomical landmark | Size (mm3) | Cohen's d | Mean T-value | p-value |
|---|---|---|---|---|---|---|---|---|
| −31 | 26 | −8 | Left | Inferior frontal gyrus | 3294 | 0.64 | 4.87 | < 0.00001 |
| 0 | 46 | 22 | Midline | Medial frontal gyrus | 40176 | 0.76 | 5.77 | < 0.00001 |
| 32 | 27 | −6 | Right | Inferior frontal gyrus | 3618 | 0.59 | 4.51 | < 0.00001 |
| 5 | 14 | 41 | Midline | Cingulate gyrus | 1107 | 0.41 | 3.14 | < 0.002 |
| −2 | 9 | 62 | Midline | Superior frontal gyrus | 1134 | 0.48 | 3.69 | < 0.001 |
PFC rGBC results for the clinical between-group analyses with region coordinates and relevant pairwise statistics reported. For completeness, we present all region comparisons. Effect sizes show standard Cohen's d estimates. Cohen's d was obtained by extracting the average Fisher's r-to-Z connectivity value for each subject across the entire identified cluster. This was done in order to characterize the magnitude of between-group effects across voxels surviving the type I error correction and provide a guide regarding sample sizes needed for future replications (Button et al., 2013).
Table 3.
Region coordinates, p-values, effect sizes: PFC rGBC no GSR
| X | Y | Z | Hemisphere | Anatomical landmark | Size (mm3) | Cohen's d | Mean T-value | p-value |
|---|---|---|---|---|---|---|---|---|
| 1 | 58 | −5 | Right | Medial frontal gyrus | 6750 | 0.59 | 4.50 | <0.00001 |
| 14 | 12 | −14 | Right | Medial/inferior frontal gyrus | 837 | 0.47 | 3.62 | <0.0001 |
| −42 | 32 | −7 | Left | Inferior frontal gyrus | 864 | 0.43 | 3.31 | <0.0015 |
| 32 | 27 | −7 | Right | Inferior frontal gyrus | 1647 | 0.46 | 3.54 | <0.001 |
| −41 | 15 | −4 | Left | Inferior frontal gyrus/insula | 972 | 0.44 | 3.34 | <0.001 |
| 39 | 52 | 13 | Right | Middle frontal gyrus | 2106 | 0.49 | 3.75 | <0.001 |
| −3 | 51 | 34 | Left | Medial/superior frontal gyrus | 20817 | 0.61 | 4.66 | <0.00001 |
| 9 | 45 | 15 | Right | Medial frontal gyrus | 891 | 0.42 | 3.24 | <0.0015 |
| 39 | 17 | 38 | Right | Precentral gyrus | 1539 | 0.42 | 3.22 | <0.0015 |
| −5 | 0 | 66 | Left | Superior frontal gyrus | 3321 | 0.55 | 4.22 | <0.00001 |
PFC rGBC results for the clinical between-group analyses with region coordinates and relevant pairwise statistics reported. For completeness, we present all region comparisons. Effect sizes show standard Cohen's d estimates. Cohen's d was obtained by extracting the average Fisher's r-to-Z connectivity value for each subject across the entire identified cluster. This was done in order to characterize the magnitude of between-group effects across voxels surviving the type I error correction and provide a guide regarding sample sizes needed for future replications (Button et al., 2013).
Table 4.
Region coordinates, p-values, and effect sizes: whole-brain GBC
| X | Y | Z | Hemisphere | Anatomical landmark | Size (mm3) | Cohen's d | Mean T-value | p-value |
|---|---|---|---|---|---|---|---|---|
| −22 | −47 | −55 | Left | Inferior cerebellum | 999 | 0.51 | −3.89 | <0.00015 |
| −10 | −74 | −5 | Left | Visual cortex/lingual gyrus | 41796 | 0.70 | −5.37 | <0.00001 |
| 21 | −55 | −15 | Right | Visual cortex/lingual gyrus | 2889 | 0.49 | −3.72 | <0.00025 |
| 5 | 59 | −6 | Right | Medial frontal gyrus | 1620 | 0.53 | 4.01 | <0.0001 |
| −53 | −25 | −9 | Left | Middle temporal gyrus | 3834 | 0.55 | 4.19 | <0.00005 |
| 40 | −56 | −15 | Right | Fusiform gyrus | 1782 | 0.50 | −3.85 | <0.0002 |
| −18 | −31 | 50 | Left | Post-central/motor cortex | 75249 | 0.74 | −5.68 | <0.00001 |
| 0 | −57 | 32 | Midline | Precuneus | 29943 | 0.62 | 4.71 | <0.00001 |
| 23 | 25 | 42 | Right | Middle/superior frontal gyrus | 20979 | 0.66 | 5.01 | <0.00001 |
| 41 | −25 | 18 | Right | Insular/auditory cortex | 6372 | 0.56 | −4.30 | <0.0001 |
| 44 | −65 | 32 | Right | Angular gyrus | 17874 | 0.67 | 5.11 | <0.00001 |
| −44 | −68 | 26 | Left | Middle temporal gyrus | 13851 | 0.62 | 4.70 | <0.00001 |
| −32 | 12 | 44 | Left | Middle frontal gyrus | 4806 | 0.51 | 3.91 | <0.00015 |
| 47 | −30 | 47 | Left | Post-central gyrus | 1242 | 0.43 | −3.28 | <0.0015 |
Whole-brain GBC results for the clinical between-group analyses with region coordinates and relevant pairwise statistics reported. For completeness, we present all region comparisons. Effect sizes show standard Cohen's d estimates. Cohen's d was obtained by extracting the average Fisher's r-to-Z connectivity value for each subject across the entire identified cluster. As with PFC rGBC results, this was done in order to characterize the magnitude of between-group effects across voxels surviving the type I error correction and provide a guide regarding sample sizes needed for future replications (Button et al., 2013). Negative values denote effects for which patients exhibited lower connectivity than controls.
Group classification using multivariate pattern analysis
For group classification using multivariate pattern analysis (MVPA), as in our prior work (Anticevic et al., 2014a), we used linear support vector machines with LIBSVM in MATLAB (Chang and Lin, 2011; software is available at http://www.csie.ntu.edu.tw/∼cjlin/libsvm/) to test the consistency of PFC rGBC dysconnectivity on an individual subject basis. The key utility of this additional classification analysis was to provide provisional evidence that observed disrupted PFC connectivity may aid diagnostic decisions and may be sensitive to predicting group membership. Each subject's preprocessed PFC rGBC map was used with standard leave-one-subject-out cross-validation to train and test linear support vector machines (C = 1). A subject from each group was held out in turn as their group membership (patient or control) was predicted based on a support vector machine trained to distinguish between groups based on the other subjects' data. Feature selection was used within each cross-validation fold (a t test run for each voxel/feature in the training data, thresholded at p < 0.1) to reduce the number of irrelevant voxels included in training and testing. A lack of balance could be problematic for these analyses because it could bias a classifier to predict that any input data more likely belonged to one group over another. This dataset was not balanced (N = 129/106). Therefore, a randomly sampled subset of 106 patients relative to 106 controls was selected for inclusion. Statistical significance for classifications was obtained using binomial testing.
Computing specificity of PFC rGBC effects as a function of location, connection strength, and connection distance
Location specificity analyses: PFC versus whole-brain.
We quantified whether the core PFC rGBC effect was also present when extending the analyses to the whole-brain level, an approach used in our prior work to determine specificity of PFC effects (Anticevic et al., 2014b). For this purpose, we computed a whole-brain GBC analysis using identical procedures as described above. This analysis was not restricted to PFC, but rather extended to all gray matter voxels within subject-specific anatomically defined gray matter masks defined via Freesurfer software (Fischl et al., 2002). As with the PFC analyses, for each gray matter voxel, we computed a correlation with every other gray matter voxel, transformed the correlations to Fisher z-values, and finally computed their mean. This calculation yielded a whole-brain GBC map for each subject in which each voxel value represents the mean connectivity of that voxel with the rest of the brain. We used these maps for second-level comparisons between EC-SCZ and HCS (see Fig. 4), as described above. As with the PFC analyses, we computed appropriate type I error correction via FSL's nonparametric Randomize tool with 10 000 permutations (Nichols and Holmes, 2002). The resulting maps were juxtaposed next to the PFC-specific effects (see Fig. 4a–d). We also computed a formal conjunction to examine the degree of overlap between the two analyses (see Fig. 4e,f) and present whole-brain effects at a relaxed threshold for qualitative inspection.
Connection strength analyses.
It may be possible that PFC rGBC hyperconnectivity is driven by a specific subset of connection strengths. That is, either weak or strong PFC connections could be exclusively driving the core clinical effect, which would have implications for interpreting the hyperconnectivity observation as possibly restricted to a given type of connection. In contrast, the observed hyperconnectivity in EC-SCZ could be a general property of PFC networks present across most connection strengths. To test this hypothesis, before computing the mean Fisher z-value across all connections, we first sorted individual connections by strength, divided them into deciles (ranges that spanned 10% of all connections), and then computed PFC rGBC for each connection strength band separately. We extracted the resulting values for all regions that showed hyperconnectivity in EC-SCZ (see Fig. 1) and separately tested each of the strength bands for presence of hyperconnectivity in EC-SCZ versus HCS. To better visualize the differences, we expressed the PFC rGBC values as a difference from the mean of the control group at each specific decile range (see Fig. 5).
Figure 5.

Examining strength of connection contribution to the PFC rGBC effect. a, We examined whether the PFC rGBC effect in EC-SCZ is driven by a particular connection strength range or if it is generally prevalent across connection strengths. We did so by extracting the signal out of regions showing hyperconnectivity in EC-SCZ versus HCS (as in Fig. 1a). b, Averaging across all of the regions identified in the original analysis, we quantified the contribution to the effect across strength connection bins, separated into deciles (i.e., 10% increments). As with the original effect, this analysis was restricted to PFC voxels only. EC-SCZ was associated with higher PFC rGBC for both negative (top) and positive (bottom) connection ranges, although the top two bins failed to reach significance. c, We expressed values at each connection strength bin as differences from the mean of the control group at that particular bin. This analysis further indicates that the hyperconnectivity in SCZ is evident across most connection strengths, but somewhat progressively reduced at the top connection strengths (and was not significant for the top 20% of connection strengths, which are presented in a, perhaps reflecting a ceiling effect). We quantified this effect using an ANOVA with one between-group factor (Group, EC-SCZ vs HCS) and one within-group factor (Strength Range). ANOVA results revealed a significant main effect of group, confirming the general PFC hyperconnectivity in EC-SCZ (F(1,233) = 38.65, p = 2.31 × 10⁻⁹). Overall, these analyses highlight a relatively uniform increase across most of the connection strength ranges, except for the top connections, perhaps reflecting a ceiling effect. Error bars mark ± 1 SEM. All p-values are 2-tailed. ***p < 0.001; **p < 0.01; *p < 0.05.
Connection distance analyses.
PFC hyperconnectivity in EC-SCZ might arise due to abnormalities in the normal progression of developmental changes of decreased local and increased distal connectivity (Fair et al., 2008). Therefore, it is possible that the PFC rGBC hyperconnectivity is driven by connections of a specific distance (e.g., lack of reduction in local connectivity). To explore that possibility before computing the PFC rGBC for each of the regions that showed hyperconnectivity in EC-SCZ (see Fig. 1), we sorted the connections to all other PFC voxels by distance into 10 bands of equal size and computed PFC rGBC for each distance band separately. Next, we combined the resulting values across all the regions and tested for presence of hyperconnectivity in EC-SCZ versus HCS for each distance band separately. Again, we visualized the differences by expressing the resulting PFC rGBC values as differences from the mean of the control group at each specific distance range (see Fig. 6).
Figure 6.

Examining distance of connection contribution to the PFC rGBC effect. a, As with the strength of connection analysis above, here, we examined whether the PFC rGBC effect in EC-SCZ is driven by a particular connection distance. Put simply, perhaps only the local (or distal) voxels are impacting the effect. Alternatively, the effect may be prevalent regardless of connection distance. We quantified the Euclidian distance from each voxel to the center of mass of the regions that displayed hyperconnectivity at baseline (see Materials and Methods). b, Averaging across all of the regions identified in the original analysis in Figure 1a, we quantified the contribution to the effect across connection distances, separated into deciles (i.e., 10% increments), also restricted to PFC voxels only. As evident for each connection distance range, EC-SCZ was associated with higher PFC rGBC for both near and far connections. c, Again, we expressed values at each connection distance bin as differences from the mean of the control group at that particular bin. This analysis indicates that the hyperconnectivity in SCZ is evident across connection distances (although the effect was not sensitive to the closest connections, as those were the same voxels from which the GBC was computed). We quantified this effect using an ANOVA with one between-group factor (Group, EC-SCZ vs HCS) and one within-group factor (Connection Distance). ANOVA results revealed a main effect of group, confirming the hyperconnectivity in SCZ (F(1,233) = 44.35, p = 1.95 × 10⁻¹⁰). These analyses further support the hypothesis that hyperconnectivity is present across PFC connections across distances. Error bars mark ± 1 SEM. All p-values are 2-tailed. ***p < 0.001; **p < 0.01; *p < 0.05.
Computational modeling framework.
We implemented a validated computational model of resting-state functional connectivity (Deco et al., 2013), which extends a local circuit model (Wang, 2002; Wong and Wang, 2006) to implement biologically plausible mechanisms for BOLD signal fluctuations (Yang et al., 2014). The network is composed of 66 nodes and is a dynamic mean-field model (Wong and Wang, 2006) coupled through a large-scale anatomical connectivity matrix derived from diffusion tractography in humans as reported in Hagmann et al. (2008). We extracted the anatomical connectivity matrix from Deco and Jirsa (2012), as described in our prior work (Yang et al., 2014).
It is worth noting that the strengths of global connections in the model allow for an undetermined scale factor, which accounts for differences in the range of local self-coupling (w) within nodes and global coupling (G) between our simulations and those reported by Deco et al. (2013). BOLD signals were simulated via the Balloon-Windkessel model, as done previously (Yang et al., 2014). We parametrically varied strengths of G and w values between nodes. Default values were set to w = 0.531, G = 1.25, and noise (σ) = 0.0004. None of the reported effects depended qualitatively on the specific default values, as shown in Figure 12c. All other parameter values were set to those of Deco et al. (2013).
Figure 12.

Computational modeling simulation of BOLD signal illustrates a biologically grounded hypothetical mechanism for increased connectivity in schizophrenia. a, We used a biophysically based computational model of BOLD rs-fcMRI to explore parameters that could reflect elevated connectivity observations in SCZ. The two key parameters are strength of local, recurrent self-coupling (w) within nodes (solid lines) and strength of long-range, global coupling (G) between 66 nodes in total (dashed lines), adapted from prior work (Deco et al., 2013). b, Simulations indicate increased GBC, computed across all nodes, in response to increased G (left) or w (middle). The noise parameter (σ; right) provided a control, indicating a reduction in GBC as expected. Error bars represent the SD at each value of w or G computed across four simulated models with different random noise, illustrating model stability. c, The specific configuration of the structural connectivity matrix (Hagmann et al., 2008) did not affect the net pattern of the modeling results, indicating the same trends across 100 simulations with randomly repermuted structural connectivity matrices (all p < 0.001, test for binomial proportions). d, Two-dimensional parameter space capturing the positive relationship between w/G and GBC of the BOLD signal across all nodes. The blue area marks regimes where the model baseline is unstable due to elevated G and/or w. These simulations illustrate how alterations in biophysically based parameters (rather than physiological noise) can increase GBC, as observed empirically in EC-SCZ.
Deco et al. (2013) did not incorporate a common shared signal component—that is, the global signal. When using their original approach for other clinical purposes (Yang et al., 2014), we found the results to be somewhat unrealistic given the known large contribution of the global signal in empirical data. Therefore, we implemented an important adjustment to the model based on our recent work examining biophysical properties of the global brain signal (Yang et al., 2014). That is, to more realistically capture the percentage of BOLD signal variance represented by the global signal, we introduced a common input to all nodes, mimicking low baseline level correlations seen empirically in gray matter. Specifically, a shared noise term of amplitude 0.0005 was added to the signal of all nodes. This way, we were able to simulate a neuronal GS that accounted for 77% of the total simulated BOLD signal variance at the default values given above. Based on our prior simulations (Yang et al., 2014), we opted to use this value to account for the fact that empirical GS likely contained a physiological non-neuronal component, which is supported by primate studies (Schölvinck et al., 2010). Detailed model-derived GS simulations are reported in our prior work (Yang et al., 2014).
Computational modeling: in silico GBC computation.
To better adapt the model for GBC computations, it was necessary to introduce a common signal to all nodes, mimicking low baseline level correlations seen empirically in gray matter. Next, to compute GBC of each node, we first generated a correlation matrix of each node's signal with signals from all other (65) nodes, as done empirically with voxelwise GBC. Values in the correlation matrix were converted to z-score equivalents using a Fischer r-to-Z transform, as with empirical connectivity data. Next, GBC for a given node in the model was computed as the mean value of each of the 65 columns (corresponding to the 65 remaining nodes) in this transformed matrix. To compute the average GBC of the network, we took the mean GBC value across the 66 nodes. This effectively yielded a GBC index of the model across parameters, which could be qualitatively examined in relation to empirical clinical results as a function of specific parameter perturbation (see Fig. 12).
Results
Prefrontal connectivity is increased in EC-SCZ
We hypothesized that EC-SCZ may be associated with elevated PFC connectivity relative to HCS, possibly reflecting cortical disinhibition (Rolls and Deco, 2010). We tested this hypothesis using a validated connectivity method restricted to PFC voxels (i.e., restricted GBC or rGBC; Cole et al., 2010; Cole et al., 2011a). We directly compared EC-SCZ (n = 129) patients relative to matched HCS (n = 106; see Table 1 for demographics). Consistent with predictions, we found evidence for increased PFC rGBC in the EC-SCZ group relative to HCS (quantified via an independent-sample t test; Fig. 1a). The hyperconnectivity was localized predominantly around medial PFC regions (see Table 2 for list of foci and effect sizes). The overall magnitude of the identified hyperconnectivity was robust, as indicated via formal effect size calculation across all areas (Cohen's d = 0.84, p < 0.001; Cohen, 1992; Fig. 1b; region-specific effects are presented in Table 2).
Decreases in prefrontal connectivity in EC-SCZ appear to be modest
Despite significantly increased PFC connectivity in EC-SCZ, there could be a “mixed” motif of increased and decreased rGBC such that reductions are more modest in magnitude (or extent) at illness onset. To test whether other areas exhibited decreased connectivity (which might not have survived the stringent type I error protection in the initial analysis), we first examined group differences using a liberal statistical threshold (Fig. 2a, results shown at Z > 1.6, p < 0.05, uncorrected). Even these statistically relaxed results were not consistent with robust connectivity decrease in EC-SCZ, somewhat in contrast to prior findings in chronic samples (Cole et al., 2011a). Next, we conducted a qualitative analysis without any statistical threshold applied, which provided modest evidence of reduced rGBC around lateral PFC foci—typically associated with chronic SCZ (Cole et al., 2011a). Post hoc analysis revealed a modest effect size of group differences across all areas, showing reduced PFC rGBC in the patient group (Fig. 2b; Cohen's d = −0.29 vs 0.84). Next, we quantified the percentage of PFC voxels associated with increased versus decreased rGBC in EC-SCZ: 80% of PFC voxels showed increased PFC rGBC in EC-SCZ, whereas 20% showed a decrease relative to HCS (p < 0.0001; binomial test for proportions). Collectively, these effects are inconsistent with an evenly mixed profile of hypoconnectivity/hyperconnectivity and instead support a predominant pattern of increased PFC coupling during early illness course, with modest evidence for hypoconnectivity.
Figure 2.

Examination of regions showing prefrontal hypoconnectivity in EC-SCZ at reduced statistical thresholds. a, At lower thresholds (Z > 1.65), there was still no evidence of hypoconnectivity in EC-SCZ patients. b, Threshold-free patterns are shown. Red-yellow areas mark regions were rGBC was increased in EC-SCZ relative to HCS. Green areas mark regions were rGBC was decreased in EC-SCZ relative to HCS. These patterns highlight that there is modest evidence for hypoconnectivity. c, rGBC values are extracted out of all of the regions that show reduction in EC-SCZ (i.e., all green areas). This quantitatively verifies that the magnitude of the effect was modest (Cohen's d = −0.29). d, We quantified the proportions of voxels showing increased (yellow) versus reduced (green) rGBC in EC-SCZ relative to HCS. The overwhelming proportion of voxels (80%) showed increased rGBC in EC-SCZ (binomial proportion test, p < 0.0001). Error bars mark ± 1 SEM. All p-values are 2-tailed. ****p < 0.0001; ***p < 0.001; **p < 0.01; *p < 0.05.
Effects of GSR on identified patterns
There are growing concerns that GSR, a common data-processing step in rs-fcMRI research, could introduce confounds into between-group connectivity comparisons (Saad et al., 2012; Yang et al., 2014; see Materials and Methods), especially if one of the clinical groups exhibits greater GS variability (Yang et al., 2014). Briefly, GSR involves removal of a large signal from each voxel in the time series to increase the statistical and anatomical sensitivity of rs-fMRI. To rule out the possible impact of this step on reported clinical effects, we repeated all analyses without GSR (Fig. 3a–c), which did not alter any of the reported patterns. Without implementing GSR, there was still robust evidence for hyperconnectivity in EC-SCZ compared with HCS (Cohen's d = 0.76, p < 0.002). Again, without GSR, few areas exhibited reduced PFC rGBC (Fig. 3d–g). Consistent with results after GSR, these findings further highlight that EC-SCZ is predominantly associated with increases in PFC connectivity.
Examining specificity of prefrontal effects as a function of location, strength, and distance
Next, we tested the specificity of the identified pattern using three separate analyses. First, we extended our analyses across the entire brain to test whether hyperconnectivity was a dominant profile across the brain (or appeared in other networks) or a feature predominately occurring within PFC networks. We found evidence for a mixed pattern of both hyperconnectivity and hypoconnectivity across other brain regions in EC-SCZ when the GBC analyses were extended to all gray matter voxels (Fig. 4). Furthermore, regions showing hyperconnectivity in the whole-brain GBC analyses did not overlap with those found for the PFC rGBC approach, even when examined at a lower threshold (Fig. 4c; see Table 3 for list of foci showing whole-brain GBC effects). These findings suggest that there may be some PFC-network-specific involvement in initial illness onset. That is, PFC hyperconnectivity may be distinct from connectivity alterations across other whole-brain networks (because hyperconnectivity was not exclusively observed across the whole brain; Fig. 4). Interestingly, the whole-brain elevations in connectivity were colocalized with areas corresponding to the default-mode network (DMN; Fox et al., 2005; Whitfield-Gabrieli et al., 2009), consistent with prior connectivity and task-based studies reporting DMN abnormalities in SCZ (Holt et al., 2011; Whitfield-Gabrieli and Ford, 2012; Anticevic et al., 2012a; Fig. 4c,d). Second, we found that PFC hyperconnectivity was present across a wide range of connection strengths (Fig. 5), confirming the breadth of PFC hyperconnectivity. That is, PFC rGBC occurred across both weak and strong PFC connections. Third, we investigated whether local and long-range PFC connectivity was differentially affected in EC-SCZ. Here we tested whether “local” circuits surrounding the “peak” effects are the areas that are most profoundly hyperconnected to each other. We found that elevated PFC rGBC was present across most distance ranges (both near and far) and was not related to the distance between voxels (Fig. 6). Collectively, these secondary specificity analyses indicate that most of the identified PFC hyperconnectivity was not apparent when analyses were extended across the whole brain. Further, the hyperconnectivity was a motif present across PFC connection strengths and distances, suggesting a rather general functional disturbance in identified PFC areas during early SCZ stages.
Relationship with symptoms and diagnostic classification at baseline
To establish the clinical relevance of PFC hyperconnectivity in EC-SCZ, we quantified its relationship to symptom severity (PANSS total score; see Materials and Methods). We averaged all symptoms (PANSS total score) to circumvent the type I error correction that arises from correlating multiple symptom measures (Anticevic et al., 2014a), given that there was no specific a priori prediction for any one particular symptom cluster. We found that patients with higher PFC rGBC exhibited more severe overall psychopathology (r = 0.23, p < 0.01; Fig. 7b). In contrast, signals in regions showing reduced PFC connectivity at baseline were not significantly correlated with symptoms (r = −0.06, NS). We conducted two exploratory follow-up analyses specifically focused on positive and negative SCZ symptoms. We found that patients with higher PFC rGBC exhibited more severe positive symptoms (r = 0.17, p < 0.05); however, the effect was not significant for negative symptoms (r = 0.08, NS) despite adequate statistical power provided by the large clinical sample size (i.e., 83% achieved power with N = 129 for 2-tailed effects of r > 0.25; Cohen, 1992).
Figure 7.

Relationship between symptoms, diagnostic classification, and PFC rGBC. a, Effects as in Figure 1. b, Significant positive relationship between PFC rGBC across all voxels in a and overall PANSS symptom severity for EC-SCZ patients (N = 129, r = 0.23, p < 0.01). c, Classification accuracy findings showing above-chance results (horizontal line marks chance at 50%): 63% overall accuracy (p < 0.0001), 67% for EC-SCZ (p < 0.0001), and 59% for HCS (p < 0.01). PANSS, Positive and Negative Symptom Scale for SCZ (Kay et al., 1987). All p-values are 2-tailed. ***p < 0.001; **p < 0.01; *p < 0.05.
Next, we tested whether PFC hyperconnectivity enabled diagnostic classification to determine whether the identified pattern can be potentially useful (in conjunction with other information) for diagnosis. To this end, we conducted a multivariate pattern analysis following validated techniques using PFC rGBC values for each subject (Norman et al., 2006; Cole et al., 2011b; Anticevic et al., 2014a). Using PFC rGBC connectivity maps with linear support vector machines and leave-one-subject-out cross-validation, we found that subjects could be classified with 63% accuracy (p < 0.0001; 67% for EC-SCZ, p < 0.0001; 59% for HCS, p < 0.01; Fig. 7c). The 95% confidence intervals for Sensitivity and Specificity were 57–76 and 48–68, respectively. Therefore, although the PFC rGBC result is not sufficient to establish clinical diagnosis, it does provide meaningful predictive value at the individual subject level, which could be combined with other emerging neuroimaging markers (Woodward et al., 2012). As with symptoms, we did not find any predictive value when examining regions showing PFC hypoconnectivity.
Prefrontal hyperconnectivity changes longitudinally and tracks symptoms
A key question in the present study relates to whether the elevated PFC rGBC in EC-SCZ exhibits longitudinal alterations. We repeated scanning in 25 EC-SCZ patients at a 12-month follow-up assessment. We rigorously verified all of the demographic characteristics for this patient subsample in relation to matched controls, the full sample of controls, and the full sample of patients studied at baseline (Table 1). Collectively, there were no demographic differences for this subsample and it is unlikely they could have affected the results. Next, we examined four focused longitudinal questions: (1) do the effects in the regions discovered at baseline (Fig. 1a) also show longitudinal alterations?; (2) is there evidence for longitudinal alterations in other areas when the baseline scans of the 25 patients are compared directly with their follow-up scans?; (3) is there longitudinal change in areas that show PFC hyperconnectivity or hypoconnectivity at baseline (Fig. 2b)?; and (4) if identified, do the longitudinal alterations in PFC rGBC track clinical symptom improvement identified at 12-month follow-up? (see Table 1 for symptom information).
Across all analyses, we directly compared the 25 EC-SCZ at baseline relative to their 12-month follow-up scans. First, we computed a pairwise t test focused explicitly on the signal across regions identified at baseline defined independently from any longitudinal effects (Fig. 8a). That is, we examined longitudinal effects in clusters that showed between-group differences in the two-sample t test maps conducted on the baseline data. Results revealed a significant reduction in PFC rGBC at the 12-month longitudinal follow-up (t(23) = 2.7, p < 0.015, Cohen's d = −0.78, paired t test). Importantly, the subgroup of EC-SCZ patients who were followed longitudinally also exhibited PFC hyperconnectivity at baseline relative to matched HCS (t(139) = 4.96, p < 0.001, Cohen's d = 0.96; Fig. 8b,c). Next, to determine whether any other areas (outside of those discovered at baseline) change longitudinally, we conducted a PFC voxelwise search on those patients who were followed longitudinally. That is, we independently searched for any other regions that showed changes in 25 SCZ patients between their baseline and 12-month follow-up scans across all PFC voxels (i.e., not just the clusters discovered at baseline). Again, we identified increased PFC rGBC in the EC-SCZ group at baseline relative to the 12-month longitudinal follow-up scan (Fig. 8d–f, tested via a voxelwise paired-sample t test, t(23) = −4.45, p < 0.001, Cohen's d = −1.28). Interestingly, we also identified an LPFC area for which patients exhibited reduced PFC rGBC at baseline, but normalization at the 12-month follow-up (Figs. 8d, 9, 10). These results further indicate a robust longitudinal normalization in PFC rGBC 12 months after treatment was started.
We also investigated whether the normalization was present predominantly in regions that were hyperconnected at baseline or if the normalization also extended across areas that showed connectivity reductions at baseline. We tested this question across all regions that showed reduced (vs increased) effects at baseline relative to HCS (Fig. 8g), providing a set of independent regions in which to test longitudinal effects. Consistent with prior analyses, there was again a normalization of both the hyperconnected (Fig. 8h) and hypoconnected areas at the 12-month longitudinal follow-up (Fig. 8i), supporting a bidirectional connectivity change (see next section for a follow-up characterization of this effect).
Lastly, we quantified possible clinical correlates of observed longitudinal neuroimaging effects. Notably, the EC-SCZ (N = 25) sample that was followed longitudinally exhibited clinical improvement across symptom dimensions (Table 1), likely reflecting treatment effects (see Discussion). Given that PFC hyperconnectivity predicted symptoms at baseline (Fig. 7b), it is possible that this reduction in symptoms is directly related to the magnitude of PFC hyperconnectivity normalization. Therefore, we tested whether the identified normalization of PFC connectivity tracks clinical symptom improvement at 12-month follow-up. Here, we focused explicitly on PFC areas identified at baseline (Fig. 8a) because these regions were defined relative to HCS and are therefore statistically orthogonal to possible longitudinal clinical symptom improvement, providing an unbiased test. That is, if we focused on the regions identified longitudinally (Fig. 8b), the analyses would be partially statistically circular by searching for a symptom-related connectivity change across regions that are already guaranteed to show such a longitudinal change. We calculated the magnitude of the drop in connectivity for each subject (i.e., normalization in hyperconnectivity) and the magnitude of the drop in symptoms (i.e., normalization in symptoms). As hypothesized, results revealed a significant relationship between longitudinal rGBC normalization across regions identified at baseline and longitudinal improvement in symptoms (Fig. 8j–m). Critically, these effects were evident only for positive symptoms (r = 0.48, p < 0.01), most notably formal thought disturbance (r = 0.46, p < 0.01). However, there was no such relationship for negative SCZ symptoms (r = −0.09, NS).
Baseline hyperconnectivity predicts longitudinal improvement in connectivity and symptoms
The above analyses indicate that longitudinal normalization in connectivity is significantly related to symptom improvement. However, another compelling hypothesis is that patients with the most substantial PFC hyperconnectivity at baseline may show the largest longitudinal change in either connectivity or symptoms. This question is distinct from the analyses above because it tests whether those patients that had the most severe connectivity alteration during their first episode before treatment were those that also showed the biggest normalization in connectivity and symptoms after treatment. We tested both questions via magnitudes extracted from regions discovered at baseline to circumvent circularity (because those effects were discovered relative to matched controls at baseline and not guaranteed to change longitudinally; Fig. 9a). First, the severity of PFC rGBC hyperconnectivity at baseline was highly significantly related to the magnitude of reduction in connectivity at 12-month follow up (r = 0.88, p < 0.0001, N = 25; Fig. 9b). Second, the severity of PFC rGBC hyperconnectivity at baseline was significantly related to symptom improvement across measures that were presented above in Figure 8 (Fig. 9c–f). These effects indicate that patients with most severe PFC hyperconnectivity at baseline were also those that exhibited most symptom improvement as well as most normalization in PFC rGBC at 12-month follow-up, after treatment was initiated.
Characterizing dissociable normalization of PFC hyperconnectivity versus hypoconnectivity
Results revealed dissociable longitudinal alterations in PFC rGBC for the MPFC and LPFC regions (Fig. 8d). These dissociable patterns may reflect separate neural pathways that interact differentially with subcortical regions in response to pharmacotherapy. That is, antipsychotic medication exerts its primary effects on the dorsal striatum predominantly via D2 dopamine receptor blockage (Howes and Kapur, 2009). Therefore, one possibility is that these normalized patterns along medial and lateral PFC regions reflect each region's differential connectivity with the striatum. To test this hypothesis, we conducted a focused connectivity analysis between anatomically defined dorsal striatum (i.e., caudate nucleus, see Materials and Methods) and the two PFC areas with connectivity that was normalized longitudinally. Results revealed a full dissociation (Fig. 10): we compared MPFC-caudate connectivity at baseline versus 12-month follow-up via a paired t test, which revealed a decrease (t(23) = 3.6, p < 0.002; Cohen's d = 0.72). In contrast, we found an increase in LPFC-caudate connectivity at 12-month follow-up relative to the baseline scan, again tested via a paired t test (t(23) = 3.82, p < 0.001; Cohen's d = −0.77). This dissociation was verified via a repeated-measures ANOVA, which revealed a significant Seed (LPFC vs MPFC) × Follow-up (Baseline vs 12-months.) interaction (F(1,24) = 31.4, p = 9.1 × 10⁻⁶), indicating a differential pattern of normalization between LPFC and MPFC with the caudate nucleus. We also explored the whole-brain pattern of connectivity for the two PFC seeds (Fig. 11). The results of these whole-brain analyses mirrored those of the focused striatal-PFC analyses, revealing that the LPFC and MPFC seeds show differential patterns of longitudinal normalization across widespread networks involving both PFC and sensory areas (Fig. 11). Collectively, these secondary analyses suggest possible system-level mechanisms for the longitudinal change of PFC connectivity in response to pharmacotherapy (see Discussion for detailed treatment).
Understanding elevated PFC network connectivity in schizophrenia via neurobiologically grounded computational modeling
Clinical findings revealed significantly elevated global connectivity in EC-SCZ across PFC networks and some whole-brain networks. To explore potential neurobiological mechanisms underlying such a connectivity increase, we used a validated, parsimonious, biophysically based computational model of resting-state fluctuations in multiple parcellated brain regions (Deco et al., 2013). The computational modeling provides a way to derive simulated BOLD connectivity in response to specific biologically derived parameters manipulations, which can in turn be related to experimental effects (Yang et al., 2014). We tested the hypothesis that parameters affecting the E/I balance may capture empirically observed connectivity effects.
The model architecture generates simulated BOLD signals for each of its nodes (n = 66; Fig. 12a). Nodes are simulated by mean-field dynamics (Wong and Wang, 2006) coupled through structured long-range projections derived from diffusion-weighted imaging in humans (Hagmann et al., 2008). Three key model parameters are the strength of local, recurrent self-coupling (w) within nodes; the strength of long-range, “global” coupling (G) between nodes (Fig. 12a); and the strength of noise (σ) added to each node. G and w are effective parameters that describe the net contribution of excitatory and inhibitory coupling at the local circuit level (Wong and Wang, 2006). The pattern of functional connectivity in the model was found to match human empirical connectivity patterns when the values of w and G set the model in a regime near the edge of instability (Deco et al., 2013). However, global connectivity derived from the model has not been examined previously, nor has it been related to clinical observations. Testing specific connectivity measures within the model architecture is critical for two reasons that complement its clinical relevance: (1) to determine the model's viability in generating a plausible connectivity metric (such as GBC), which can be related to human neuroimaging data across studies; and (2) to explore the dependence of model-derived GBC on key neurobiologically relevant parameters. It is important to show that alterations in functional, signal-bearing parameters are related to clinical observations, but not in the noise parameter (which is expected to attenuate functional connectivity).
Here, we computed the GBC of the simulated BOLD signals averaged across all nodes in the model (global model connectivity, Fig. 12a, see Materials and Methods) using a calculation that was identical to what was done for the neuroimaging data. We characterized model performance as a function of increasing w, G, and σ to the point where the parameters approach their critical, destabilizing values (see the parameter space, Fig. 12d). We found that the model-derived GBC increased as a function of increasing w or G (Fig. 12b,d), mimicking clinical observations. Elevating w and/or G produced an elevated pattern of in silico GBC. This suggests that the empirically observed PFC rGBC increase in EC-SCZ might arise from increased neural coupling at the local and/or long-range scales. Critically, we also found that the model-derived GBC decreased as a function of increasing σ (Fig. 12b). This effect in particular illustrates that elevated GBC is not a “generic” property of any chosen parameter that increases BOLD variability, but rather reflects an increase in key w/G parameters.
Next, we tested whether the specific configuration of the structural connectivity matrix (Hagmann et al., 2008) affected the net pattern of the modeling results. It is important to establish that the predominant effect is an increase in GBC as a function of relevant functional parameters regardless of particular anatomical connectivity. To this end, we repermuted the connectivity matrix randomly (n = 100) and reran all modeling simulations. After discarding four permutations that prematurely destabilized, we recomputed the average GBC as a function of G, w, and σ parameters. Next, we computed the slope of the effect for each of the permutations (either positive slope or negative slope). By chance alone, we would expect 50% of the modeling simulations to show a positive slope and 50% to show a negative slope. However, for both the w and G parameters, regardless of the structural connectivity matrix configuration, we observed a positive slope (binomial test for proportions, p < 0.001 for each test, see Fig. 12b,c). Conversely, for the σ noise parameter, regardless of the structural connectivity matrix configuration, we observed a negative slope (binomial test for proportions, p < 0.001 for each test). This suggests that the results are generic properties of the model and are not necessarily highly sensitive to the particular configuration of structural connectivity patterns in the model (although strengths of anatomical connectivity that constrain the matrix may affect functional patterns, which may occur across SCZ progression).
This noise simulation in particular generates an important clinical prediction—it could be the case that patients exhibit a decrease in the noise parameter, which would be reflected in lower BOLD signal variability. Put differently, a decrease in BOLD signal variability in EC-SCZ relative to HCS would by definition produce an increased correlation (and therefore result in a profile of hyperconnectivity in EC-SCZ). Such a result, however, would not reflect an aberrant increase in shared signal covariance, as predicted by the model (Fig. 13). Therefore, to rule out this scenario, we also verified that the variability of PFC BOLD signals was similar in EC-SCZ and HCS (Fig. 13a–c). Furthermore, results still revealed PFC hyperconnectivity EC-SCZ when using non-normalized covariance to compute PFC rGBC (as opposed to a correlation; Fig. 13d,e). This experimental result, directly motivated by the computational modeling, is consistent with the abnormally increased GBC shown in silico that does not reflect a noise reduction, but more likely reflects an aberrant shared signal increase. Collectively, these modeling simulations and predicted empirical findings further demonstrate that alterations in GBC may have neural bases grounded in computational parameters that likely do not reflect BOLD noise alterations during early illness stages.
Discussion
We identified increased resting-state PFC connectivity in acute medication-free SCZ patients, which positively correlated with symptoms and predicted diagnosis. At the whole-brain level, we observed a more mixed motif of both hyperconnectivity and hypoconnectivity. The PFC hyperconnectivity normalized longitudinally, predicting symptom improvement. We used computational simulations, implicating altered recurrent local and global coupling in clinical findings. Collectively, results highlight the viability of neuroimaging markers for identifying dysconnectivity in non-medicated patients, which relates to longitudinal clinical improvement, providing insights into PFC and global network dynamics during acute stages of SCZ.
Prefrontal and whole-brain functional connectivity during early illness course
The prevailing view of PFC dysfunction in SCZ, based on chronic patient studies, suggests reductions in its function (Glahn et al., 2005; Anticevic et al., 2013a), structure (Thompson et al., 2001; Ellison-Wright et al., 2008; Shepherd et al., 2012; Fitzsimmons et al., 2013), and connectivity (Fornito et al., 2011; Fornito et al., 2012). However, SCZ is a dynamic neurodevelopmental disorder (Weinberger, 1987; Karlsgodt et al., 2008; Uhlhaas and Singer, 2010; Uhlhaas, 2013) that is perhaps associated with progressive structural decline (de Castro-Manglano et al., 2011; Cobia et al., 2012). This neurodevelopmental model suggests that illness stages may differ functionally (Marek et al., 2010; Uhlhaas, 2013).
We identified PFC functional hyperconnectivity in medication-free early-course patients, which is consistent with meta-analyses (Marsman et al., 2013) and experimental evidence (Natsubori et al., 2014) describing increased PFC glutamate concentrations in early SCZ phases. These observations suggest that early SCZ phases may be associated with increased cortical excitability or disinhibition (Krystal et al., 2003), reflecting altered E/I balance and possibly increased glutamatergic tone (Schobel et al., 2013).
This increased connectivity is consistent with pharmacological manipulations used to model SCZ, such as N-methyl-d-aspartate receptor (NMDAR) antagonists, which increase pyramidal cell activity (Moghaddam and Adams, 1998), extracellular glutamate levels (Homayoun and Moghaddam, 2007), cortical metabolism (Lahti et al., 1995; Breier et al., 1997; Vollenweider et al., 1997; Vollenweider et al., 2000; Lahti et al., 2001), and functional connectivity (Pinault, 2008; Driesen et al., 2013a; Driesen et al., 2013b). In addition, animal studies demonstrated that NMDAR antagonism caused elevated “spreading” of hippocampal activation (Schobel et al., 2013). Repeated NMDAR antagonist dosing eventually caused chronic hippocampal atrophy, resembling observations after longer illness periods. Given that hyperconnectivity has been associated with SCZ symptoms and cognitive impairments, aberrant hyperconnectivity is likely pathological, perhaps arising from increased excitability, reduced pyramidal input selectivity, or other sources of aberrant cortical hypersynchrony. One mechanism could involve reductions in inhibitory components of cortical connectivity, which may alter excitation. Such deficits could increase excitability and reduce input selectivity of cortical excitation (i.e., pathologically increased cortical functional connectivity). In addition, functional/homeostatic aspects of hyperexcitability cannot be ruled out, reflecting compensations for reduced inhibitory tone. Furthermore, elevated PFC connectivity could reflect a nonspecific clinical epiphenomenon such as fever, which modulates with symptoms but is indicative of a secondary pathological process. Such abnormal hyperconnectivity could cause a compensatory regulation of cortical circuits, resulting in chronic (and perhaps irreversible) downregulation of structural support, producing functional hypoconnectivity observed during chronic illness in certain areas (Théberge et al., 2007; Stone et al., 2009).
Alternatively, hypoconnectivity may actually precede any emergence of hyperconnectivity. Although hyperconnectivity dominated in magnitude and extent, we observed modest connectivity reductions along the LPFC (there was no hypoconnectivity along MPFC), typically associated with executive and cognitive deficits in SCZ, similar to studies reporting connectivity reductions in chronic patients (Cole et al., 2011a). Therefore, reduced PFC connectivity may predate hyperconnectivity and progress throughout the illness course.
When extended to the whole-brain level (Fig. 4), we found evidence for hyperconnectivity across DMN areas (Whitfield-Gabrieli et al., 2009) with evidence of hypoconnectivity in sensory-motor areas (although brain-wide hypoconnectivity effects were attenuated before GSR, reflecting complex properties of GSR that continue to be resolved; Saad et al., 2012; Yang et al., 2014). Decreases in functional connectivity are not uniformly seen in chronic schizophrenia. In particular, aspects of DMN (Whitfield-Gabrieli et al., 2009) and thalamic functional connectivity (Woodward et al., 2012) may be elevated throughout the illness course. These whole-brain effects are also consistent with long-standing findings of functionally significant temporal lobe abnormalities and sensory processing dysfunction in EC-SCZ (McCarley et al., 2002; Javitt, 2009), suggesting that connectivity alterations extend beyond PFC networks. However, there was little overlap between the PFC-centered and the whole-brain GBC results, indicating that the intra-PFC connectivity is markedly elevated, but that these same PFC areas do not seem to exhibit brain-wide alterations (Fig. 4).
Finally, we found that patients with more severe symptoms (predominantly positive) exhibited higher intra-PFC hyperconnectivity, indicating that elevated PFC connectivity during early/acute illness stages has clinical relevance. This suggests that prevention strategies may focus on correcting alterations in hyperconnectivity, which may restore optimal cortical circuit E/I balance, slow illness progression, and possibly attenuate structural and functional decline (Thompson et al., 2001).
PFC hyperconnectivity normalizes longitudinally and tracks symptom improvement
A key aim of the present study was to establish whether elevated PFC connectivity exhibits longitudinal change, particularly in relation to clinical improvement. Longitudinal analyses revealed two key findings: (1) patients exhibited longitudinal normalization in PFC connectivity, evident for both increases and reductions, and (2) at 12-month follow-up, most patients showed symptom improvement (Table 1), which correlated with normalization in PFC hyperconnectivity. The relationship between PFC connectivity and clinical improvement could reflect a dynamic, system-level neurobiological process amenable to early intervention, consistent with recent studies documenting pharmacological effects on midbrain and associative cortex resting connectivity during early illness course (Lui et al., 2010; Hadley et al., 2014). Studies capturing high-risk prodromal states will help to clarify whether these alterations emerge after illness onset or appear earlier (Cannon et al., 2008). By definition, these longitudinal results cannot be separated from medication effects—in fact, they likely reflect treatment-related improvement. Notably, longitudinal improvement in response to treatment implies a pharmacological effect on cortical connectivity. However, antipsychotic medications exert their primary mechanism of action on subcortical circuits, particularly the striatum (Howes et al., 2012). Follow-up analyses were consistent with possible striatal system-level mechanisms, whereby medication may modulate striatal-thalamic-cortical loops (Haber, 2003; Figs. 10, 11). Regardless of the mechanism, PFC hyperconnectivity normalization may reflect a causal relationship that could be examined in randomized trials designed to test the neural correlates of pharmacotherapeutic efficacy.
Hypothesized neurobiological mechanisms of increased prefrontal connectivity
To better interpret clinical findings, we used biophysically based computational modeling (Deco et al., 2013). We demonstrated an increase in model-derived GBC by elevating local node self-coupling (w) and/or global coupling (G) between nodes, providing a proof-of-principle that in silico connectivity increases can have neural bases. These computational effects provide a conceptual demonstration of how modeling can generate neurobiological constraints for BOLD clinical effects, specifying parameters that may be clinically relevant. Such predictions can be tested via pharmacological neuroimaging in humans (Honey and Bullmore, 2004). For example, NMDAR antagonists, which may alter local and long-range synaptic interactions in vivo in healthy volunteers (Anticevic et al., 2012b), have been shown to induce hyperconnectivity when measured with similar metrics (Driesen et al., 2013a; Anticevic et al., 2014c). Last, modeling simulations illustrate a derivation of a connectivity metric in silico that can also be computed in vivo, providing a key insight: in silico GBC magnitude decreased as a function of noise, an effect not observed clinically (Figs. 12, 13), ruling out a candidate parameter. Such modeling applications can be extended to other systems that may be sensitive to clinical alterations across illness stages; namely, thalamocortical and associative cortex connectivity known to be disrupted in SCZ (Woodward et al., 2012; Anticevic et al., 2014a).
Limitations
The clinical sample included some patients with longer periods of untreated psychosis (see Materials and Methods). Future longitudinal studies that enroll at-risk subjects even earlier and measure the transition from at-risk states to frank psychosis can examine whether these effects exclusively occur during initial phases of illness. Although well powered, longitudinal analyses were based on a smaller patient subsample (N = 25). Follow-ups with larger samples are needed to replicate these findings. In addition, continued rigorous test-retest reliability studies of GBC measures are needed to establish their long-term use for possible clinical risk prediction. Controls were not studied longitudinally due to practical/recruitment considerations, leaving open the possibility that observed findings reflect some aspects of neuromaturation. Similarly, the time window of longitudinal comparisons was brief (12 months). Future studies should widen this longitudinal sampling period. Finally, although compelling, possible longitudinal treatment effects were not observed in a randomized clinical trial, which need to be verified in carefully controlled experimental studies.
Conclusion
This study established elevated PFC connectivity in a medication-free EC-SCZ cohort and found that PFC hyperconnectivity predicted symptoms and diagnostic classification. PFC hyperconnectivity normalized longitudinally, predicting clinical improvement. Computational simulations implicated local circuit and global connectivity elevations as contributing to clinical effects via cortical E/I balance alterations. Clinical effects are highly consistent with pharmacological and animal models of SCZ, but stand in contrast to some chronic illness findings. These results could have neurobiological and therapeutic implications for hypotheses proposing dynamic alterations of PFC functional network integrity from initial to chronic illness stages (Insel, 2010).
Footnotes
This work was supported by the National Natural Science Foundation (Grants 81030027, 81227002, and 81220108013), the National Key Technologies R and D Program (Program 2012BAI01B03), the Program for Changjiang Scholars and Innovative Research Team in University of China (Grant IRT1272), the National Institutes of Health (Grant DP5OD012109-02 to A.A., National Institute on Alcohol Abuse and Alcoholism Grant 2P50AA012870-11 to J.H.K., Grant MH096801 to M.W.C., Grant R01-MH062349 to J.D.M. and X.J.W., and Grant T32GM 007205 to G.J.Y.), the National Alliance for Research on Schizophrenia and Depression (A.A.), the Fulbright Foundation (A.S.), and the Yale Center for Clinical Investigation (A.A.). We thank all of the staff from the Psychiatry Department of the West China Hospital for their assistance with recruitment and Carline Diehl for assistance with this manuscript.
J.H.K. consults for several pharmaceutical and biotechnology companies with compensation less than $10,000 per year. The remaining authors declare no competing financial interests.
References
- Andreasen NC, Pressler M, Nopoulos P, Miller D, Ho BC. Antipsychotic dose equivalents and dose-years: a standardized method for comparing exposure to different drugs. Biol Psychiatry. 2010;67:255–262. doi: 10.1016/j.biopsych.2009.08.040. [DOI] [PMC free article] [PubMed] [Google Scholar]
- Anticevic A, Cole MW, Murray JD, Corlett PR, Wang XJ, Krystal JH. The role of default network deactivation in cognition and disease. Trends Cogn Sci. 2012a;16:584–592. doi: 10.1016/j.tics.2012.10.008. [DOI] [PMC free article] [PubMed] [Google Scholar]
- Anticevic A, Brumbaugh MS, Winkler AM, Lombardo LE, Barrett J, Corlett PR, Kober H, Gruber J, Repovs G, Cole MW, Krystal JH, Pearlson GD, Glahn DC. Global prefrontal and fronto-amygdala dysconnectivity in bipolar I disorder with psychosis history. Biol Psychiatry. 2013;73:565–573. doi: 10.1016/j.biopsych.2012.07.031. [DOI] [PMC free article] [PubMed] [Google Scholar]
- Anticevic A, Gancsos M, Murray JD, Repovs G, Driesen NR, Ennis DJ, Niciu MJ, Morgan PT, Surti TS, Bloch MH, Ramani R, Smith M, Wang XJ, Krystal JH, Corlett PR. NMDA receptor function in large-scale anti-correlated neural systems with implications for cognition and schizophrenia. Proc Natl Acad Sci U S A. 2012b;109:16720–16725. doi: 10.1073/pnas.1208494109. [DOI] [PMC free article] [PubMed] [Google Scholar]
- Anticevic A, Repovs G, Barch DM. Working memory encoding and maintenance deficits in schizophrenia: neural evidence for activation and deactivation abnormalities. Schizophr Bull. 2013a;39:168–178. doi: 10.1093/schbul/sbr107. [DOI] [PMC free article] [PubMed] [Google Scholar]
- Anticevic A, Cole MW, Repovs G, Murray JD, Brumbaugh MS, Winkler AM, Savic A, Krystal JH, Pearlson GD, Glahn DC. Characterizing thalamo-cortical disturbances in schizophrenia and bipolar illness. Cereb Cortex. 2014a;24:3116–3130. doi: 10.1093/cercor/bht165. [DOI] [PMC free article] [PubMed] [Google Scholar]
- Anticevic A, Hu S, Zhang S, Savic A, Billingslea E, Wasylink S, Repovs G, Cole MW, Bednarski S, Krystal JH, Bloch MB, Li CS, Pittenger C. Global resting-state fMRI analysis identifies frontal cortex, striatal, and cerebellar dysconnectivity in obsessive-compulsive disorder. Biol Psychiatry. 2014b;75:595–605. doi: 10.1016/j.biopsych.2013.10.021. [DOI] [PMC free article] [PubMed] [Google Scholar]
- Anticevic A, Corlett PR, Cole MW, Savic A, Gancsos M, Tang Y, Repovs G, Murray JD, Driesen NR, Morgan PT, Ke X, Krystal JH. NMDA receptor antagonist effects on prefrontal cortical connectivity better model early than chronic schizophrenia. Biol Psychiatry. 2014c doi: 10.1016/j.biopsych.2014.07.022. In press. [DOI] [PubMed] [Google Scholar]
- Barch DM, Ceaser A. Cognition in schizophrenia: core psychological and neural mechanisms. Trends Cogn Sci. 2012;16:27–34. doi: 10.1016/j.tics.2011.11.015. [DOI] [PMC free article] [PubMed] [Google Scholar]
- Biswal BB, Mennes M, Zuo XN, Gohel S, Kelly C, Smith SM, Beckmann CF, Adelstein JS, Buckner RL, Colcombe S, Dogonowski AM, Ernst M, Fair D, Hampson M, Hoptman MJ, Hyde JS, Kiviniemi VJ, Kötter R, Li SJ, Lin CP, Lowe MJ, Mackay C, Madden DJ, Madsen KH, Margulies DS, Mayberg HS, McMahon K, Monk CS, Mostofsky SH, Nagel BJ, Pekar JJ, Peltier SJ, Petersen SE, Riedl V, Rombouts SA, Rypma B, Schlaggar BL, Schmidt S, Seidler RD, Siegle GJ, Sorg C, Teng GJ, Veijola J, Villringer A, Walter M, Wang L, Weng XC, Whitfield-Gabrieli S, Williamson P, Windischberger C, Zang YF, Zhang HY, Castellanos FX, Milham MP. Toward discovery science of human brain function. Proc Natl Acad Sci U S A. 2010;107:4734–4739. doi: 10.1073/pnas.0911855107. [DOI] [PMC free article] [PubMed] [Google Scholar]
- Breier A, Malhotra AK, Pinals DA, Weisenfeld NI, Pickar D. Association of ketamine-induced psychosis with focal activation of the prefrontal cortex in healthy volunteers. Am J Psychiatry. 1997;154:805–811. doi: 10.1176/ajp.154.6.805. [DOI] [PubMed] [Google Scholar]
- Button KS, Ioannidis JP, Mokrysz C, Nosek BA, Flint J, Robinson ES, Munafò MR. Power failure: why small sample size undermines the reliability of neuroscience. Nat Rev Neurosci. 2013;14:365–376. doi: 10.1038/nrn3475. [DOI] [PubMed] [Google Scholar]
- Cannon TD, Thompson PM, van Erp TG, Toga AW, Poutanen VP, Huttunen M, Lonnqvist J, Standerskjold-Nordenstam CG, Narr KL, Khaledy M, Zoumalan CI, Dail R, Kaprio J. Cortex mapping reveals regionally specific patterns of genetic and disease-specific gray-matter deficits in twins discordant for schizophrenia. Proc Natl Acad Sci U S A. 2002;99:3228–3233. doi: 10.1073/pnas.052023499. [DOI] [PMC free article] [PubMed] [Google Scholar]
- Cannon TD, Cadenhead K, Cornblatt B, Woods SW, Addington J, Walker E, Seidman LJ, Perkins D, Tsuang M, McGlashan T, Heinssen R. Prediction of psychosis in youth at high clinical risk: a multisite longitudinal study in North America. Arch Gen Psychiatry. 2008;65:28–37. doi: 10.1001/archgenpsychiatry.2007.3. [DOI] [PMC free article] [PubMed] [Google Scholar]
- Carter CS, Perlstein W, Ganguli R, Brar J, Mintun M, Cohen JD. Functional hypofrontality and working memory dysfunction in schizophrenia. Am J Psychiatry. 1998;155:1285–1287. doi: 10.1176/ajp.155.9.1285. [DOI] [PubMed] [Google Scholar]
- Chan RC, Di X, McAlonan GM, Gong QY. Brain anatomical abnormalities in high-risk individuals, first-episode, and chronic schizophrenia: an activation likelihood estimation meta-analysis of illness progression. Schizophr Bull. 2011;37:177–188. doi: 10.1093/schbul/sbp073. [DOI] [PMC free article] [PubMed] [Google Scholar]
- Chang C-C, Lin C-J. LIBSVM: A library for support vector machines. ACM Transactions on Intelligent Systems and Technology. 2011;2 1:27. [Google Scholar]
- Cho RY, Konecky RO, Carter CS. Impairments in frontal cortical gamma synchrony and cognitive control in schizophrenia. Proc Natl Acad Sci U S A. 2006;103:19878–19883. doi: 10.1073/pnas.0609440103. [DOI] [PMC free article] [PubMed] [Google Scholar]
- Cobia DJ, Smith MJ, Wang L, Csernansky JG. Longitudinal progression of frontal and temporal lobe changes in schizophrenia. Schizophr Res. 2012;139:1–6. doi: 10.1016/j.schres.2012.05.002. [DOI] [PMC free article] [PubMed] [Google Scholar]
- Cohen J. A power primer. Psychol Bull. 1992;112:155–159. doi: 10.1037/0033-2909.112.1.155. [DOI] [PubMed] [Google Scholar]
- Cole MW, Pathak S, Schneider W. Identifying the brain's most globally connected regions. Neuroimage. 2010;49:3132–3148. doi: 10.1016/j.neuroimage.2009.11.001. [DOI] [PubMed] [Google Scholar]
- Cole MW, Anticevic A, Repovs G, Barch D. Variable global dysconnectivity and individual differences in schizophrenia. Biol Psychiatry. 2011a;70:43–50. doi: 10.1016/j.biopsych.2011.02.010. [DOI] [PMC free article] [PubMed] [Google Scholar]
- Cole MW, Etzel JA, Zacks JM, Schneider W, Braver TS. Rapid transfer of abstract rules to novel contexts in human lateral prefrontal cortex. Front Hum Neurosci. 2011b;5:142. doi: 10.3389/fnhum.2011.00142. [DOI] [PMC free article] [PubMed] [Google Scholar]
- Cole MW, Yarkoni T, Repovs G, Anticevic A, Braver TS. Global connectivity of prefrontal cortex predicts cognitive control and intelligence. J Neurosci. 2012;32:8988–8999. doi: 10.1523/JNEUROSCI.0536-12.2012. [DOI] [PMC free article] [PubMed] [Google Scholar]
- de Castro-Manglano P, Mechelli A, Soutullo C, Gimenez-Amaya J, Ortuño F, McGuire P. Longitudinal changes in brain structure following the first episode of psychosis. Psychiatry Res. 2011;191:166–173. doi: 10.1016/j.pscychresns.2010.10.010. [DOI] [PubMed] [Google Scholar]
- Deco G, Jirsa VK. Ongoing cortical activity at rest: criticality, multistability, and ghost attractors. J Neurosci. 2012;32:3366–3375. doi: 10.1523/JNEUROSCI.2523-11.2012. [DOI] [PMC free article] [PubMed] [Google Scholar]
- Deco G, Ponce-Alvarez A, Mantini D, Romani GL, Hagmann P, Corbetta M. Resting-state functional connectivity emerges from structurally and dynamically shaped slow linear fluctuations. J Neurosci. 2013;33:11239–11252. doi: 10.1523/JNEUROSCI.1091-13.2013. [DOI] [PMC free article] [PubMed] [Google Scholar]
- Dragovic M, Hammond G. A classification of handedness using the Annett Hand Preference Questionnaire. Br J Psychol. 2007;98:375–387. doi: 10.1348/000712606X146197. [DOI] [PubMed] [Google Scholar]
- Driesen NR, McCarthy G, Bhagwagar Z, Bloch MH, Calhoun V, D'Souza DC, Gueorguieva R, He G, Ramachandran R, Suckow RF, Anticevic A, Morgan PT, Krystal JH. Relationship of resting brain hyperconnectivity and schizophrenia-like symptoms produced by the NMDA receptor antagonist ketamine in humans. Mol Psychiatry. 2013a;18:1199–1204. doi: 10.1038/mp.2012.194. [DOI] [PMC free article] [PubMed] [Google Scholar]
- Driesen NR, McCarthy G, Bhagwagar Z, Bloch MH, Calhoun VD, D'Souza DC, Gueorguieva R, He G, Leung HC, Ramani R, Anticevic A, Suckow RF, Morgan PT, Krystal JH. The impact of NMDA receptor blockade on human working memory-related prefrontal function and connectivity. Neuropsychopharmacology. 2013b;38:2613–2622. doi: 10.1038/npp.2013.170. [DOI] [PMC free article] [PubMed] [Google Scholar]
- Ellison-Wright I, Glahn DC, Laird AR, Thelen SM, Bullmore E. The anatomy of first-episode and chronic schizophrenia: an anatomical likelihood estimation meta-analysis. Am J Psychiatry. 2008;165:1015–1023. doi: 10.1176/appi.ajp.2008.07101562. [DOI] [PMC free article] [PubMed] [Google Scholar]
- Fair DA, Cohen AL, Dosenbach NU, Church JA, Miezin FM, Barch DM, Raichle ME, Petersen SE, Schlaggar BL. The maturing architecture of the brain's default network. Proc Natl Acad Sci U S A. 2008;105:4028–4032. doi: 10.1073/pnas.0800376105. [DOI] [PMC free article] [PubMed] [Google Scholar]
- Fischl B, Salat DH, Busa E, Albert M, Dieterich M, Haselgrove C, van der Kouwe A, Killiany R, Kennedy D, Klaveness S, Montillo A, Makris N, Rosen B, Dale AM. Whole brain segmentation automated labeling of neuroanatomical structures in the human brain. Neuron. 2002;33:341–355. doi: 10.1016/S0896-6273(02)00569-X. [DOI] [PubMed] [Google Scholar]
- Fitzsimmons J, Kubicki M, Shenton ME. Review of functional and anatomical brain connectivity findings in schizophrenia. Curr Opin Psychiatry. 2013;26:172–187. doi: 10.1097/YCO.0b013e32835d9e6a. [DOI] [PubMed] [Google Scholar]
- Fornito A, Yoon J, Zalesky A, Bullmore ET, Carter CS. General and specific functional connectivity disturbances in first-episode schizophrenia during cognitive control performance. Biol Psychiatry. 2011;70:64–72. doi: 10.1016/j.biopsych.2011.02.019. [DOI] [PMC free article] [PubMed] [Google Scholar]
- Fornito A, Zalesky A, Pantelis C, Bullmore ET. Schizophrenia, neuroimaging and connectomics. Neuroimage. 2012;62:2296–2314. doi: 10.1016/j.neuroimage.2011.12.090. [DOI] [PubMed] [Google Scholar]
- Fox MD, Greicius M. Clinical applications of resting state functional connectivity. Front Syst Neurosci. 2010;4:19. doi: 10.3389/fnsys.2010.00019. [DOI] [PMC free article] [PubMed] [Google Scholar]
- Fox MD, Snyder AZ, Vincent JL, Corbetta M, Van Essen DC, Raichle ME. The human brain is intrinsically organized into dynamic, anticorrelated functional networks. Proc Natl Acad Sci U S A. 2005;102:9673–9678. doi: 10.1073/pnas.0504136102. [DOI] [PMC free article] [PubMed] [Google Scholar]
- Friston KJ. Functional and effective connectivity: a review. Brain Connectivity. 2011;1:13–36. doi: 10.1089/brain.2011.0008. [DOI] [PubMed] [Google Scholar]
- Glahn DC, Therman S, Manninen M, Huttunen M, Kaprio J, Lönnqvist J, Cannon TD. Spatial working memory as an endophenotype for schizophrenia. Biol Psychiatry. 2003;53:624–626. doi: 10.1016/S0006-3223(02)01641-4. [DOI] [PubMed] [Google Scholar]
- Glahn DC, Ragland JD, Abramoff A, Barrett J, Laird AR, Bearden CE, Velligan DI. Beyond hypofrontality: a quantitative meta-analysis of functional neuroimaging studies of working memory in schizophrenia. Hum Brain Mapp. 2005;25:60–69. doi: 10.1002/hbm.20138. [DOI] [PMC free article] [PubMed] [Google Scholar]
- Goldman-Rakic PS. Prefrontal cortical dysfunction in schizophrenia: the relevance of working memory. In: Carroll BJ, Barrett JE, editors. Psychopathology and the brain. New York: Raven; 1991. pp. 1–23. [Google Scholar]
- Gonzalez-Burgos G, Lewis DA. NMDA receptor hypofunction, parvalbumin-positive neurons and cortical gamma oscillations in schizophrenia. Schizophr Bull. 2012;38:950–957. doi: 10.1093/schbul/sbs010. [DOI] [PMC free article] [PubMed] [Google Scholar]
- Gotts SJ, Saad ZS, Hang JJ, Wallace GL, Cox RW, Martin A. The perils of global signal regression for group comparisons: a case study of autism spectrum disorders. Front Hum Neurosci. 2013:7. doi: 10.3389/fnhum.2013.00356. [DOI] [PMC free article] [PubMed] [Google Scholar]
- Haber SN. The primate basal ganglia: parallel and integrative networks. J Chem Neuroanat. 2003;26:317–330. doi: 10.1016/j.jchemneu.2003.10.003. [DOI] [PubMed] [Google Scholar]
- Hadley JA, Nenert R, Kraguljac NV, Bolding MS, White DM, Skidmore FM, Visscher KM, Lahti AC. Ventral tegmental area/midbrain functional connectivity and response to antipsychotic medication in schizophrenia. Neuropsychopharmacology. 2014;39:1020–1030. doi: 10.1038/npp.2013.305. [DOI] [PMC free article] [PubMed] [Google Scholar]
- Hagmann P, Cammoun L, Gigandet X, Meuli R, Honey CJ, Wedeen VJ, Sporns O. Mapping the structural core of human cerebral cortex. PLoS Biol. 2008;6:e159. doi: 10.1371/journal.pbio.0060159. [DOI] [PMC free article] [PubMed] [Google Scholar]
- Holt DJ, Lakshmanan B, Freudenreich O, Goff DC, Rauch SL, Kuperberg GR. Dysfunction of a cortical midline network during emotional appraisals in schizophrenia. Schizophr Bull. 2011;37:164–176. doi: 10.1093/schbul/sbp067. [DOI] [PMC free article] [PubMed] [Google Scholar]
- Homayoun H, Moghaddam B. NMDA receptor hypofunction produces opposite effects on prefrontal cortex interneurons and pyramidal neurons. J Neurosci. 2007;27:11496–11500. doi: 10.1523/JNEUROSCI.2213-07.2007. [DOI] [PMC free article] [PubMed] [Google Scholar]
- Honey G, Bullmore E. Human pharmacological MRI. Trends Pharmacol Sci. 2004;25:366–374. doi: 10.1016/j.tips.2004.05.009. [DOI] [PubMed] [Google Scholar]
- Howes OD, Kapur S. The dopamine hypothesis of schizophrenia: version III–the final common pathway. Schizophr Bull. 2009;35:549–562. doi: 10.1093/schbul/sbp006. [DOI] [PMC free article] [PubMed] [Google Scholar]
- Howes OD, Kambeitz J, Kim E, Stahl D, Slifstein M, Abi-Dargham A, Kapur S. The nature of dopamine dysfunction in schizophrenia and what this means for treatment: meta-analysis of imaging studies. Arch Gen Psychiatry. 2012 doi: 10.1001/archgenpsychiatry.2012.169. [DOI] [PMC free article] [PubMed] [Google Scholar]
- Insel TR. Rethinking schizophrenia. Nature. 2010;468:187–193. doi: 10.1038/nature09552. [DOI] [PubMed] [Google Scholar]
- Javitt DC. Sensory processing in schizophrenia: neither simple nor intact. Schizophr Bull. 2009;35:1059–1064. doi: 10.1093/schbul/sbp110. [DOI] [PMC free article] [PubMed] [Google Scholar]
- Karlsgodt KH, Sun D, Jimenez AM, Lutkenhoff ES, Willhite R, van Erp TG, Cannon TD. Developmental disruptions in neural connectivity in the pathophysiology of schizophrenia. Dev Psychopathol. 2008;20:1297–1327. doi: 10.1017/S095457940800062X. [DOI] [PubMed] [Google Scholar]
- Kay SR, Fiszbein A, Opler LA. The positive and negative syndrome scale (PANSS) for schizophrenia. Schizophr Bull. 1987;13:261–276. doi: 10.1093/schbul/13.2.261. [DOI] [PubMed] [Google Scholar]
- Krystal JH, D'Souza DC, Mathalon D, Perry E, Belger A, Hoffman R. NMDA receptor antagonist effects, cortical glutamatergic function, and schizophrenia: toward a paradigm shift in medication development. Psychopharmacology (Berl) 2003;169:215–233. doi: 10.1007/s00213-003-1582-z. [DOI] [PubMed] [Google Scholar]
- Lahti AC, Holcomb HH, Medoff DR, Tamminga CA. Ketamine activates psychosis and alters limbic blood flow in schizophrenia. Neuroreport. 1995;6:869–872. doi: 10.1097/00001756-199504190-00011. [DOI] [PubMed] [Google Scholar]
- Lahti AC, Holcomb HH, Medoff DR, Weiler MA, Tamminga CA, Carpenter WT., Jr Abnormal patterns of regional cerebral blood flow in schizophrenia with primary negative symptoms during an effortful auditory recognition task. Am J Psychiatry. 2001;158:1797–1808. doi: 10.1176/appi.ajp.158.11.1797. [DOI] [PubMed] [Google Scholar]
- Lewis DA, Curley AA, Glausier JR, Volk DW. Cortical parvalbumin interneurons and cognitive dysfunction in schizophrenia. Trends Neurosci. 2012;35:57–67. doi: 10.1016/j.tins.2011.10.004. [DOI] [PMC free article] [PubMed] [Google Scholar]
- Lui S, Li T, Deng W, Jiang L, Wu Q, Tang H, Yue Q, Huang X, Chan RC, Collier DA, Meda SA, Pearlson G, Mechelli A, Sweeney JA, Gong Q. Short-term effects of antipsychotic treatment on cerebral function in drug-naive first-episode schizophrenia revealed by “resting state” functional magnetic resonance imaging. Arch Gen Psychiatry. 2010;67:783–792. doi: 10.1001/archgenpsychiatry.2010.84. [DOI] [PubMed] [Google Scholar]
- Marek GJ, Behl B, Bespalov AY, Gross G, Lee Y, Schoemaker H. Glutamatergic (N-methyl-D-aspartate receptor) hypofrontality in schizophrenia: too little juice or a miswired brain? Mol Pharmacol. 2010;77:317–326. doi: 10.1124/mol.109.059865. [DOI] [PubMed] [Google Scholar]
- Marsman A, van den Heuvel MP, Klomp DW, Kahn RS, Luijten PR, Hulshoff Pol HE. Glutamate in schizophrenia: a focused review and meta-analysis of 1H-MRS studies. Schizophr Bull. 2013;39:120–129. doi: 10.1093/schbul/sbr069. [DOI] [PMC free article] [PubMed] [Google Scholar]
- Mathalon DH, Sullivan EV, Lim KO, Pfefferbaum A. Progressive brain volume changes and the clinical course of schizophrenia in men: a longitudinal magnetic resonance imaging study. Arch Gen Psychiatry. 2001;58:148–157. doi: 10.1001/archpsyc.58.2.148. [DOI] [PubMed] [Google Scholar]
- McCarley RW, Salisbury DF, Hirayasu Y, Yurgelun-Todd DA, Tohen M, Zarate C, Kikinis R, Jolesz FA, Shenton ME. Association between smaller left posterior superior temporal gyrus volume on magnetic resonance imaging and smaller left temporal P300 amplitude in first-episode schizophrenia. Arch Gen Psychiatry. 2002;59:321–331. doi: 10.1001/archpsyc.59.4.321. [DOI] [PubMed] [Google Scholar]
- Moghaddam B, Adams BW. Reversal of phencyclidine effects by a group II metabotropic glutamate receptor agonist in rats. Science. 1998;281:1349–1352. doi: 10.1126/science.281.5381.1349. [DOI] [PubMed] [Google Scholar]
- Murray CJL, Lopez AD Harvard School of Public Health, World Health Organization., World Bank. The global burden of disease: a comprehensive assessment of mortality and disability from diseases, injuries, and risk factors in 1990 and projected to 2020. Cambridge, MA: Published by the Harvard School of Public Health on behalf of the World Health Organization and the World Bank; Distributed by Harvard UP; 1996. [Google Scholar]
- Natsubori T, Inoue H, Abe O, Takano Y, Iwashiro N, Aoki Y, Koike S, Yahata N, Katsura M, Gonoi W, Sasaki H, Takao H, Kasai K, Yamasue H. Reduced frontal glutamate + glutamine and N-acetylaspartate levels in patients with chronic schizophrenia but not in those at clinical high risk for psychosis or with first-episode schizophrenia. Schizophr Bull. 2014;40:1128–1139. doi: 10.1093/schbul/sbt124. [DOI] [PMC free article] [PubMed] [Google Scholar]
- Nichols TE, Holmes AP. Nonparametric permutation tests for functional neuroimaging: a primer with examples. Hum Brain Mapp. 2002;15:1–25. doi: 10.1002/hbm.1058. [DOI] [PMC free article] [PubMed] [Google Scholar]
- Norman KA, Polyn SM, Detre GJ, Haxby JV. Beyond mind-reading: multi-voxel pattern analysis of fMRI data. Trends Cogn Sci. 2006;10:424–430. doi: 10.1016/j.tics.2006.07.005. [DOI] [PubMed] [Google Scholar]
- Palaniyappan L, Simmonite M, White TP, Liddle EB, Liddle PF. Neural primacy of the salience processing system in schizophrenia. Neuron. 2013;79:814–828. doi: 10.1016/j.neuron.2013.06.027. [DOI] [PMC free article] [PubMed] [Google Scholar]
- Pinault D. N-methyl d-aspartate receptor antagonists ketamine and MK-801 induce wake-related aberrant gamma oscillations in the rat neocortex. Biol Psychiatry. 2008;63:730–735. doi: 10.1016/j.biopsych.2007.10.006. [DOI] [PubMed] [Google Scholar]
- Power JD, Barnes KA, Snyder AZ, Schlaggar BL, Petersen SE. Spurious but systematic correlations in functional connectivity MRI networks arise from subject motion. Neuroimage. 2012;59:2142–2154. doi: 10.1016/j.neuroimage.2011.10.018. [DOI] [PMC free article] [PubMed] [Google Scholar]
- Power JD, Barnes KA, Snyder AZ, Schlaggar BL, Petersen SE. Steps toward optimizing motion artifact removal in functional connectivity MRI; a reply to Carp. Neuroimage. 2013;76:439–441. doi: 10.1016/j.neuroimage.2012.03.017. [DOI] [PMC free article] [PubMed] [Google Scholar]
- Reichenberg A, Harvey PD, Bowie CR, Mojtabai R, Rabinowitz J, Heaton RK, Bromet E. Neuropsychological function and dysfunction in schizophrenia and psychotic affective disorders. Schizophr Bull. 2009;35:1022–1029. doi: 10.1093/schbul/sbn044. [DOI] [PMC free article] [PubMed] [Google Scholar]
- Repovs G, Barch DM. Working memory related brain network connectivity in individuals with schizophrenia and their siblings. Front Hum Neurosci. 2012:6. doi: 10.3389/fnhum.2012.00137. [DOI] [PMC free article] [PubMed] [Google Scholar]
- Repovs G, Csernansky JG, Barch DM. Brain network connectivity in individuals with schizophrenia and their siblings. Biol Psychiatry. 2011;69:967–973. doi: 10.1016/j.biopsych.2010.11.009. [DOI] [PMC free article] [PubMed] [Google Scholar]
- Rolls ET, Deco G. A computational neuroscience approach to schizophrenia and its onset. Neurosci Biobehav Rev. 2010 doi: 10.1016/j.neubiorev.2010.09.001. [DOI] [PubMed] [Google Scholar]
- Saad ZS, Gotts SJ, Murphy K, Chen G, Jo HJ, Martin A, Cox RW. Trouble at rest: how correlation patterns and group differences become distorted after global signal regression. Brain Connectivity. 2012;2:25–32. doi: 10.1089/brain.2012.0080. [DOI] [PMC free article] [PubMed] [Google Scholar]
- Schobel SA, Chaudhury NH, Khan UA, Paniagua B, Styner MA, Asllani I, Inbar BP, Corcoran CM, Lieberman JA, Moore H, Small SA. Imaging patients with psychosis and a mouse model establishes a spreading pattern of hippocampal dysfunction and implicates glutamate as a driver. Neuron. 2013;78:81–93. doi: 10.1016/j.neuron.2013.02.011. [DOI] [PMC free article] [PubMed] [Google Scholar]
- Schölvinck ML, Maier A, Ye FQ, Duyn JH, Leopold DA. Neural basis of global resting-state fMRI activity. Proc Natl Acad Sci U S A. 2010;107:10238–10243. doi: 10.1073/pnas.0913110107. [DOI] [PMC free article] [PubMed] [Google Scholar]
- Shepherd AM, Laurens KR, Matheson SL, Carr VJ, Green MJ. Systematic meta-review and quality assessment of the structural brain alterations in schizophrenia. Neurosci Biobehav Rev. 2012;36:1342–1356. doi: 10.1016/j.neubiorev.2011.12.015. [DOI] [PubMed] [Google Scholar]
- Smith SM, Nichols TE. Threshold-free cluster enhancement: addressing problems of smoothing, threshold dependence and localisation in cluster inference. Neuroimage. 2009;44:83–98. doi: 10.1016/j.neuroimage.2008.03.061. [DOI] [PubMed] [Google Scholar]
- Stone JM, Day F, Tsagaraki H, Valli I, McLean MA, Lythgoe DJ, O'Gorman RL, Barker GJ, McGuire PK OASIS. Glutamate dysfunction in people with prodromal symptoms of psychosis: relationship to gray matter volume. Biol Psychiatry. 2009;66:533–539. doi: 10.1016/j.biopsych.2009.05.006. [DOI] [PubMed] [Google Scholar]
- Sun L, Castellanos N, Grützner C, Koethe D, Rivolta D, Wibral M, Kranaster L, Singer W, Leweke MF, Uhlhaas PJ. Evidence for dysregulated high-frequency oscillations during sensory processing in medication-naïve, first episode schizophrenia. Schizophr Res. 2013;150:519–525. doi: 10.1016/j.schres.2013.08.023. [DOI] [PubMed] [Google Scholar]
- Théberge J, Williamson KE, Aoyama N, Drost DJ, Manchanda R, Malla AK, Northcott S, Menon RS, Neufeld RW, Rajakumar N, Pavlosky W, Densmore M, Schaefer B, Williamson PC. Longitudinal grey-matter and glutamatergic losses in first-episode schizophrenia. Br J Psychiatry. 2007;191:325–334. doi: 10.1192/bjp.bp.106.033670. [DOI] [PubMed] [Google Scholar]
- Thompson PM, Vidal C, Giedd JN, Gochman P, Blumenthal J, Nicolson R, Toga AW, Rapoport JL. Mapping adolescent brain change reveals dynamic wave of accelerated gray matter loss in very early-onset schizophrenia. Proc Natl Acad Sci U S A. 2001;98:11650–11655. doi: 10.1073/pnas.201243998. [DOI] [PMC free article] [PubMed] [Google Scholar]
- Uhlhaas PJ. Dysconnectivity, large-scale networks and neuronal dynamics in schizophrenia. Curr Opin Neurobiol. 2013;23:283–290. doi: 10.1016/j.conb.2012.11.004. [DOI] [PubMed] [Google Scholar]
- Uhlhaas PJ, Singer W. Abnormal neural oscillations and synchrony in schizophrenia. Nat Rev Neurosci. 2010;11:100–113. doi: 10.1038/nrn2774. [DOI] [PubMed] [Google Scholar]
- Van Snellenberg JX, Torres IJ, Thornton AE. Functional neuroimaging of working memory in schizophrenia: task performance as a moderating variable. Neuropsychology. 2006;20:497–510. doi: 10.1037/0894-4105.20.5.497. [DOI] [PubMed] [Google Scholar]
- Vollenweider FX, Leenders KL, Scharfetter C, Antonini A, Maguire P, Missimer J, Angst J. Metabolic hyperfrontality and psychopathology in the ketamine model of psychosis using positron emission tomography (PET) and [18F]fluorodeoxyglucose (FDG) Eur Neuropsychopharmacol. 1997;7:9–24. doi: 10.1016/S0924-977X(96)00039-9. [DOI] [PubMed] [Google Scholar]
- Vollenweider FX, Vontobel P, Oye I, Hell D, Leenders KL. Effects of (S)-ketamine on striatal dopamine: a [11C]raclopride PET study of a model psychosis in humans. J Psychiatr Res. 2000;34:35–43. doi: 10.1016/S0022-3956(99)00031-X. [DOI] [PubMed] [Google Scholar]
- Vos T, Flaxman AD, Naghavi M, Lozano R, Michaud C, Ezzati M, Shibuya K, Salomon JA, Abdalla S, Aboyans V, Abraham J, Ackerman I, Aggarwal R, Ahn SY, Ali MK, Alvarado M, Anderson HR, Anderson LM, Andrews KG, Atkinson C, et al. Years lived with disability (YLDs) for 1160 sequelae of 289 diseases and injuries 1990–2010: a systematic analysis for the Global Burden of Disease Study. Lancet. 2012;380:2163–2196. doi: 10.1016/S0140-6736(12)61729-2. [DOI] [PMC free article] [PubMed] [Google Scholar]
- Wang XJ. Probabilistic decision making by slow reverberation in cortical circuits. Neuron. 2002;36:955–968. doi: 10.1016/S0896-6273(02)01092-9. [DOI] [PubMed] [Google Scholar]
- Weinberger DR. Implications of normal brain development for the pathogenesis of schizophrenia. Arch Gen Psychiatry. 1987;44:660–669. doi: 10.1001/archpsyc.1987.01800190080012. [DOI] [PubMed] [Google Scholar]
- Whitfield-Gabrieli S, Ford JM. Default mode network activity and connectivity in psychopathology. Annu Rev Clin Psychol. 2012;8:49–76. doi: 10.1146/annurev-clinpsy-032511-143049. [DOI] [PubMed] [Google Scholar]
- Whitfield-Gabrieli S, Thermenos HW, Milanovic S, Tsuang MT, Faraone SV, McCarley RW, Shenton ME, Green AI, Nieto-Castanon A, LaViolette P, Wojcik J, Gabrieli JD, Seidman LJ. Hyperactivity and hyperconnectivity of the default network in schizophrenia and in first-degree relatives of persons with schizophrenia. Proc Natl Acad Sci U S A. 2009;106:1279–1284. doi: 10.1073/pnas.0809141106. [DOI] [PMC free article] [PubMed] [Google Scholar]
- Wong KF, Wang XJ. A recurrent network mechanism of time integration in perceptual decisions. J Neurosci. 2006;26:1314–1328. doi: 10.1523/JNEUROSCI.3733-05.2006. [DOI] [PMC free article] [PubMed] [Google Scholar]
- Woodward ND, Karbasforoushan H, Heckers S. Thalamocortical dysconnectivity in schizophrenia. Am J Psychiatry. 2012;169:1092–1099. doi: 10.1176/appi.ajp.2012.12010056. [DOI] [PMC free article] [PubMed] [Google Scholar]
- Yang GJ, Murray JD, Repovs G, Cole MW, Savic A, Glasser MF, Pittenger C, Krystal JH, Wang XJ, Pearlson GD, Glahn DC, Anticevic A. Altered global brain signal in schizophrenia. Proc Natl Acad Sci U S A. 2014;111:7438–7443. doi: 10.1073/pnas.1405289111. [DOI] [PMC free article] [PubMed] [Google Scholar]