

Abstract
Aim
Neuroprotection trials for neonatal encephalopathy use moderate or severe disability as an outcome, with the Bayley Scales of Infant Development, Second Edition (Bayley-2) Index scores of <70 as part of the criteria. The Bayley Scales of Infant and Toddler, 3rd Development, Third Edition (Bayley-3) have superseded Bayley-2 and yield higher than expected scores in typically developing and high-risk infants. The aim of this study, therefore, was to compare Bayley-2 scores and Bayley-3 scores in term-born infants surviving neonatal encephalopathy treated with hypothermia.
Method
Sixty-one term-born infants (37 males, 24 females; median gestational age at birth 40wks, range 36–42wks; median birthweight 3280g, range 2295–5050) following neonatal encephalopathy and hypothermia had contemporaneous assessment at 18 months using the Bayley-2 and Bayley-3.
Results
The median Bayley-3 Cognitive Composite score was 7 points higher than the median Bayley-2 Mental Developmental Index (MDI) score and the median Bayley-3 Motor Composite score was 18 points higher than the median Bayley-2 Psychomotor Developmental Index (PDI) score. Ten children had a Bayley-2 MDI of <70; only three children had Bayley-3 combined Cognitive/Language scores of <70. Eleven children had Bayley-2 PDI scores of <70 and four had modified Bayley-3 Motor Composite scores of <70. Applying regression equations to Bayley-3 scores adjusted rates of severe delay to similar proportions found using Bayley-2 scores.
Interpretation
Fewer children were classified with severe delay using the Bayley-3 than the Bayley-2, which prohibits direct comparison of scores. Increased Bayley-3 cut-off thresholds for classifying severe disability are recommended when comparing studies in this clinical group using Bayley-2 scores.
What this paper adds
Bayley-3 scores in term infants with neonatal encephalopathy at 18 months were higher than contemporaneously obtained Bayley-2 scores.
Bayley-3 scores reduced proportions of infants classified with severe disability.
Changes to cut-off thresholds and conversion equations to facilitate test comparison for this cohort are suggested.
Clinical trials of neuroprotection for infants with moderate or severe neonatal encephalopathy have used death and severe disability as composite trial outcomes at 18 months, with the Bayley Scales of Infant Development, Second Edition (Bayley-2)1 Index scores of <70 as part of the criteria for moderate and/or severe disability.2–4 Hypothermia is now a standard treatment for infants with neonatal encephalopathy5 but clinical trials are on-going to refine this treatment and evaluate additional interventions to enhance neural rescue.6–8 The Bayley Scales of Infant and Toddler Development, Third Edition (Bayley-3)9 were published in 2006, following extensive updating and restructuring. It is anticipated that in ongoing neuroprotection studies of neonatal encephalopathy, Bayley-3 scores will replace Bayley-2 scores in the criteria for defining disability and, thereby, the outcome of trials.
Recent studies comparing the Bayley-2 and Bayley-3 report higher than expected scores using the Bayley-3,10–16 leading to the suggestion that the Bayley-3 underestimates developmental delay compared to the Bayley-2. The large study using the National Institute of Child Health and Human Development's Research Network comparing the outcome of extremely preterm infants (gestational age <26wks) at two different time periods (Bayley-2 during 2006–2007 vs Bayley-3 during 2008–2011), concluded that Bayley-3 identified significantly fewer children with developmental delay.14 Two studies have compared Bayley-2 and Bayley-3 cognitive and language development scores in typically developing term and preterm infants from which conversion algorithms have been derived to assist with direct comparison of the scores.13,16 Fewer studies have investigated differences in motor scores between Bayley-2 and Bayley-3, but higher than expected Bayley-3 motor scores have also been found when compared to Bayley-2 equivalent scores.10,12,14,15 As only one study has compared the Bayley-3 with a term control group,11 it is not yet clear whether the Bayley-3 overestimates and or whether the Bayley-2 underestimates performance. However, in order to compare outcomes in neuroprotection trials, it is important to know how the two different editions of the test function in the range of moderate to severe delay. Furthermore, term infants with neonatal encephalopathy have a different spectrum of neurodevelopment with a high risk of severe motor and cognitive disability.17,18 In treatment trials where all infants have a high risk of developmental impairment, it is particularly important to know how assessments function in the range of moderate to severe delay (<70) as disability may not be prevented in all its grades, but may be lessened in severity with improved functional ability. To date, to our knowledge, there has been no comparative study between Bayley-2 and Bayley-3 scores in infants with neonatal encephalopathy.
Our aims in this study were to (1) compare Bayley-2 Index scores with corresponding Bayley-3 Composite scores in a well-defined cohort of infants following neonatal encephalopathy; (2) investigate the effect of a cut-off threshold of <70 on the proportions of infants classified with severe delay at 18 months; and (3) derive conversion equations to enable estimation of Bayley-2 scores from Bayley-3 scores and vice versa.
Method
Study participants were term, newborn infants with neonatal encephalopathy, considered to be hypoxic–ischaemic in origin, born between February 2007 and September 2010 and treated with whole body therapeutic hypothermia in a single neonatal intensive care unit. Infants fulfilled the entry criteria for therapeutic hypothermia as used in the CoolCap4 and TOBY trials2 and had a developmental assessment at a mean (SD) age of 18.4 (0.5) months. Eighteen months was selected as the age for assessment as all large cooling trials have examined the children at this time point.19 Combined Bayley-2 and Bayley-3 assessments at 18 months were completed in the recommended maximum of 90 minutes9 before this investigation. The local research ethics committee approved the study and informed parental consent was obtained for each patient.
Each participant was assessed in a single session by one assessor proficient in the administration of both versions of the assessment. The Bayley-3 Cognitive, Language, and Motor Scales were administered in accordance with Bayley-3 instructions with individual extra items specific to Bayley-2 (Mental and Motor scales) interspersed as judged appropriate for each individual child in order to maximize motivation and minimize fatigue. Many items were common to both versions of the test. Items that were similar but that had differences in administration, were presented in accordance with Bayley-3 instructions. Items were scored according to the instructions of each version of the test. The Bayley-3 individual start, reversal, and discontinue rules and Bayley-2 basal and ceiling scoring criteria were adhered to. English was spoken at home for all participants. Interrater agreement in 10 children from video recordings was 97%. These 10 children were representative of the total cohort both in terms of range of ability, the number of items administered per child and time taken to complete assessment (see Appendix S1, online supporting information). The mean of the two total scores for the 10 children was used in analysis.
For both the Bayley-2 and Bayley-3 the raw score is the number of test items credited as passed. The Bayley-3 has more test items, which the infant may attempt at a given age, than the Bayley-2. Raw scores are used to produce Bayley-2 Mental Developmental Index (MDI) and Psychomotor Developmental Index (PDI) scores. The Bayley-3 generates distinct Cognitive Composite, Language Composite, and Motor Composite scores from raw scores but with an intermediate step involving a scaled score for Cognition, Receptive Language, Expressive Language, Fine Motor, and Gross Motor. Figure1 describes differences in item placement between the two editions of the Scales.
Figure 1.

Summary of differences in item placement between Bayley-2 and Bayley-3 Scales of Infant Development. aTwo new Gross Motor items replace 2 deleted Bayley-2 Gross Motor items. bTwo Bayley-2 Fine Motor items from Mental Scale modified to create four items in Bayley-3 Fine Motor Scale.
Data handling
Seventy-five of 87 (86%) infants with neonatal encephalopathy treated with hypothermia survived to 18 months. Eight (11%) of these were followed up elsewhere. Complete assessment was not possible in three children; one child could not be encouraged to participate and was later diagnosed with an autistic spectrum disorder, complete testing equipment was not available on the day of assessment for another child, and one child was assessed using the mental and cognitive items only because of time restrictions. Three children scored below the scoring threshold on both the Bayley-2 and Bayley-3 scales and were, therefore, not included in this analysis. Five children scored above the basal threshold on the Bayley-3 Cognitive Composite score but scored <50 on the Bayley-2 MDI and four children scored above the basal threshold on the Bayley-3 Motor Composite but scored <50 on the Bayley-2 PDI. Extrapolated index values down to 29 derived from the Bayley-2 standardized population as described by Robinson and Mervis20 were obtained for these children in order to explore fully the relationship in children of the lowest ability. Therefore, complete Bayley-2 and Bayley-3 scores were available for 61 children.
In order to control for differences in item placement between tests, Bayley-2 PDI scores were compared with Bayley-3 Motor Composite scores as well as with a modified Bayley-3 Motor Composite score (mMC). The mMC weighted Bayley-3 Gross and Fine Motor scores in similar proportions to the Bayley-2 PDI. The Bayley-2 MDI was compared with the mean of Bayley-3 Cognitive and Language Composite (CLC) scores as well as with Bayley-3 Cognitive Composite and Language Composite score scores individually. Exact score modifications are described in Appendix S2 (online supporting information). Bayley-2 and Bayley-3 standardized scores of <70 (2SD below normative mean)1,9 were investigated as this is the cut-off threshold used to define severe disability in large neuroprotection trials.2,4
Statistical analysis
Both median and mean Bayley-2 Index and Bayley-3 Scaled Composite scores were calculated for the children scoring above the basal threshold for both test editions. We regard the median as an appropriate measure of location in empirical distributions such as in this investigation, especially as some of the distributions are non-symmetrical.21 However, as the data is only minimally skewed, mean (SD) values are also reported to permit comparisons with previous studies and parametic methods also used to further examine the relationship between scores.
Pearson's r correlation was used to examine the relationship between the Bayley-2 and modified and conventional Bayley-3 standardized scores for all children with complete scores (n=61).
Linear regression analysis using spss software, version 18 (IBM Corporation, New York, NY, USA) was used to determine the regression equation to estimate Bayley-2 scores from Bayley-3 scores and vice versa. Regression coefficients are presented with 95% confidence intervals (CI) of the residuals and the level of significance was p=0.05.
Results
Full clinical details of the 61 children (37 males, 24 females; median gestational age at birth 40wks, range 36–42wks) with complete Bayley-2 and Bayley-3 scores at 18 months are shown in TableI.
Table I.
Clinical characteristics of assessed cohorta
| Characteristic | Median (range) |
|---|---|
| Gestation at birth (wks) | 40 (36–42) |
| Sex M/F, n | 37/24 |
| Birthweight (g) | 3280 (2295–5050) |
| Cord pH | 7.04 (6.67–7.32)b |
| Cord base excess (mmol/L) | −12.65 (−30 to −1.8)b |
| Apgar score at 10min | 7 (0–10)b |
a n=61. b Data missing for one child. M, male; F, female.
In those children scoring above the basal scoring threshold in both test editions, the median Bayley-3 Cognitive Composite score was higher than the Bayley-2 MDI (100 vs 93) as was Bayley-3 Language Composite score (97 vs 93; TableII). Figure2 shows the scatter plot of the relationship between Bayley-2 MDI and Bayley-3 CLC scores for all children (n=61). Combining the separate cognitive and language scores from the Bayley-3 produced the strongest correlation with Bayley-2 (Pearson's r=0.96; TableIII). The relationship was linear (relevant regression equation given in Fig.2) with Bayley-3 scores higher than Bayley-2 scores. Severe disability cut-off thresholds at 70 and at the Bayley-3 score point of intersection with the regression line are indicated. Of the 10 infants with Bayley-2 MDI scores of <70, only three of the 10 had Bayley-3 CLC scores of <70. The point of intersection with the regression line occurs at 85. Using a Bayley-3 cut-off <85 instead of <70, nine of 10 the infants are scored as having severe cognitive/language impairment by both the Bayley-2 and Bayley-3. The relationship between Bayley-3 CLC versus Bayley-2 MDI scores has a slightly different regression line resulting in a slightly higher Bayley-3 CLC of 87 being equivalent to Bayley-2 MDI of 70 (Appendix S3 online supporting information).
Table II.
Bayley-2 Index and Bayley-3 Composite and scaled scores (children scoring above the basal score threshold of each test)
| Bayley-2 and Bayley-3 scores | Median (range) | Mean (SD) |
|---|---|---|
| Bayley-2 Mental Developmental Indexa | 93 (50–121) | 91 (17) |
| Bayley-3 Cognitive Compositea | 100 (65–125) | 102 (12.3) |
| Bayley-3 Language Compositea | 97 (68–135) | 99 (14.3) |
| Bayley-3 Cognitive and Language Compositea | 100 (74–122) | 100 (12) |
| Bayley-2 Psychomotor Developmental Indexb | 85 (59–107) | 85 (12.5) |
| Bayley-3 Motor Compositeb | 103 (76–124) | 101 (12.6) |
| Bayley-3 modified Motor Compositeb | 99 (76–121) | 98 (11.6) |
| Bayley-3 Gross Motor Scaled Scoreb | 9 (4–11) | 9 (2) |
| Bayley-3 Fine Motor Scaled Scoreb | 12 (4–17) | 11 (2.9) |
a n=57; b n=56. BSID, Bayley Scales of Infant Development.
Figure 2.
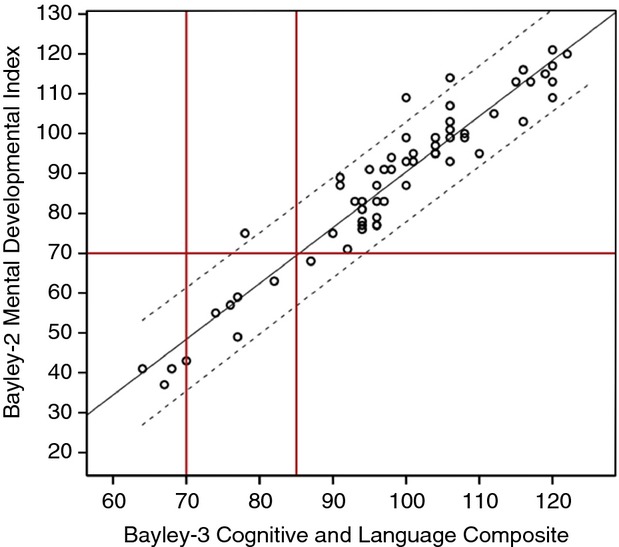
Bayley-2 Mental Developmental Index (MDI) scores versus Bayley-3 combined Cognitive and Language Composite (CLC) score (n=61). Solid line represents line of regression −49.476 + (1.399) × Bayley-3 CLC and the dotted line represents confidence intervals 1SD (6.166) of the residuals. On the y-axis the red line at 70 indicates the cut-off value for Bayley-2 MDI below which infants are classified as having severe developmental delay (−2SD from the normal mean value of 100). On the x-axis both 70 and 85 are marked with red lines. Only 3 children are classified with severe delay using Bayley-3 <70 as a cut-off. Bayley-3 <85 and Bayley-2 <70, classify the same infants (except one) as having severe developmental delay. For more accurate estimation of Bayley-2 MDI from Bayley-3 CLC, conversion equations from regression analysis can be applied.
Table III.
Correlation between Bayley-2 Index and Bayley-3 Composite scores with equations derived from linear regression analysis
| x(n=61) | y | Pearson r | Regression equation | SD residuals |
|---|---|---|---|---|
| Bayley-2 MDI | Bayley-3 CC | 0.86 | 47.093+(0.597)x | 7.444 |
| Bayley-3 CC | Bayley-2 MDI | −35.065+(1.234)x | 10.698 | |
| Bayley-2 MDI | Bayley-3 LC | 0.91 | 34.916+(0.704)x | 6.824 |
| Bayley-3 LC | Bayley-2 MDI | −25.230+(1.1684)x | 8.789 | |
| Bayley-2 MDI | Bayley-3 CLC | 0.96 | 40.848+(0.653)x | 4.211 |
| Bayley-3 CLC | Bayley-2 MDI | −49.472+(1.399)x | 6.166 | |
| Bayley-2 PDI | Bayley-3 MC | 0.87 | 35.410+(0.778)x | 7.665 |
| Bayley-3 MC | Bayley-2 PDI | −15.766+(0.984)x | 8.62 | |
| Bayley-2 PDI | Bayley-3 mMC | 0.93 | 31.246+(0.787)x | 5.55 |
| Bayley-3 mMC | Bayley-2 PDI | −23.280+(1.098)x | 6.554 |
Bayley-2, Bayley Scales of Infant Development, Second Edition; Bayley-3, Bayley Scales of Infant and Toddler Development, Third Edition; CC, Cognitive Composite; CLC, Cognitive and Language Composite; LC, Language Composite; MC, Motor Composite; MDI, Mental Developmental Index; mMC, modified Motor Composite; PDI, Psychomotor Developmental Index; SD, standard deviation.
The median Bayley-3 Motor Composite score was higher than Bayley-2 PDI score (103 vs 85; TableII). The scatter plot in Figure3 shows the relationship between the Bayley-2 PDI score and Bayley-3 mMC. The Bayley-2 PDI had a stronger correlation with the Bayley-3 mMC (Pearson's r=0.93) than conventional Bayley-3 Motor Composite score (TableIII). The relationship was linear (relevant regression equation given in Figure3) with Bayley-3 scores higher than Bayley-2 scores. Severe disability cut-off thresholds at 70 and at the Bayley-3 score point of intersection with the regression line are indicated. Of the 11 infants with Bayley-2 PDI scores <70, only four had a Bayley-3 mMC score of <70. By increasing the Bayley-3 cut-off to 85 (at the point of intersection with Bayley-2 PDI of 70) nine out of 11 infants are scored as having severe motor impairment by both Bayley-2 and Bayley-3. The relationship between the Bayley-3 mMC versus the Bayley-2 PDI again has a slightly different regression line resulting in a marginally higher Bayley-3 mMC of 86 being equivalent to a Bayley-2 PDI of 70 (see Appendix S3).
Figure 3.
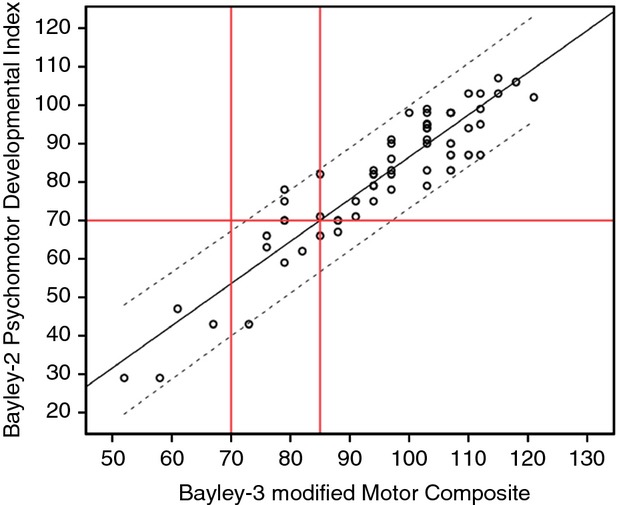
Bayley-2 Psychomotor Developmental Index (PDI) scores versus Bayley-3 modified Motor Composite (mMC) scores (n=61). Solid line represents line of regression −23.28 + (1.098) × Bayley-3 mMC and the dotted line represents confidence intervals 1SD (6.554) of the residuals. On the y-axis a red line at 70 indicates the cut-off value for Bayley-2 PDI below which infants are classified as having severe motor delay (−2SD from the normal mean value of 100). On the x-axis both 70 and 85 are marked with red lines. Only four children are classified with severe delay using Bayley-2 <70 as a cut-off. Bayley-3 <85 and Bayley-2 <70 classify the same infants (except three) as having severe motor delay. For more accurate estimation of Bayley-2 PDI from Bayley-3 mMC, conversion equations from regression analysis can be applied.
Using the relevant equations from regression analysis (TableIII), the resulting estimated Bayley-2 Index and Bayley-3 Composite scores were found to classify infants in similar proportions to the original observed Bayley scores (TableVI).
Table IV.
Proportions of cohort with different score classifications according to observed and estimated Bayley-2 Index and Bayley-3 Composite scores (n=61)
| Disability classifications | Observed scores n (%) | Estimated scoresa n (%) |
|---|---|---|
| Severe (<70) | ||
| Bayley-3 CLC | 3 (5) | 4 (7) |
| Bayley-3 mMC | 4 (7) | 5 (8) |
| Bayley-2 MDI | 10 (16) | 10 (16) |
| Bayley-2 PDI | 11 (18) | 13 (21) |
| Moderate (>70–84) | ||
| Bayley-3 CLC | 7 (11) | 5 (8) |
| Bayley-3 mMC | 9 (14) | 6 (10) |
| Bayley-2 MDI | 14 (23) | 12 (20) |
| Bayley-2 PDI | 22 (36) | 20 (33) |
| None (>85) | ||
| Bayley-3 CLC | 51 (84) | 52 (85) |
| Bayley-3 mMC | 48 (79) | 50 (82) |
| Bayley-2 MDI | 37 (61) | 39 (64) |
| Bayley-2 PDI | 28 (46) | 28 (46) |
Estimated from linear regression equations. Bayley-2, Bayley Scales of Infant Development, Second Edition; Bayley-3, Bayley Scales of Infant and Toddler Development, Third Edition; CLC, Cognitive and Language Composite; mMC, modified Motor Composite; MDI, Mental Developmental Index; PDI, Psychomotor Developmental Index.
Discussion
In term infants surviving neonatal encephalopathy the proportion of infants classified as having severe developmental delay was markedly reduced when Bayley-3 scores replaced Bayley-2 scores. Even when modified Bayley-3 scores were used to accommodate differences in item placement between the two tests, the proportion of infants classified with severe delay was still reduced from 16% to 5% for cognitive/language scores and from 18% to 7% for motor scores using the Bayley-3. Our cohort of cooled infants had lower mortality (14%) than in previous cooling trials.2–4 Also, fewer infants had Bayley-2 scores of <70 (approximately 20% including the three children who scored below the extrapolated score threshold of 29). Good outcomes for hypothermia are not unexpected in a single centre cohort and, therefore, our Bayley-2 developmental outcomes can be considered representative of this clinical group.
Our findings confirm previous work in different populations that the Bayley-3 identifies fewer children with scores of <70 than the Bayley-210,13,14 and prohibits the direct comparison of developmental outcome data using different versions of the Bayley assessment in infants with neonatal encephalopathy treated with hypothermia. Outcome data from neuroprotection interventions assessed with Bayley-3 may have artefactually better results compared with the same intervention in published studies assessed using the Bayley-2.
Including PDI and MDI scores down to 30 extrapolated from the Bayley-2 standardization sample in the regression analysis allowed exploration of scores at the severely delayed end of the spectrum. Bayley-2 score comparisons with modified Bayley-3 scores provided the strongest correlation between scores because modified Bayley-3 scores take account of the differences in item placement between the two tests. Confirmation of this can been seen as applying regression equations restored estimated scores to similar proportions found using observed scores (TableVI). In our cohort of infants following neonatal encephalopathy, modified Bayley-3 scores of <85 classified similar proportions of infants with severe developmental delay as was the case using Bayley-2 scores of <70. This cut-off is slightly higher than the Bayley-3 cognitive/language cut-off of <80 found in preterm infants suggested by Moore et al.13 This may be due to differences in the developmental skill spectrum between the two different clinical cohorts.
The Bayley-3 was administered in strict adherence with its instructions. The order of the Bayley-3 items was not altered. As item order is required to be followed as closely as possible rather than exactly,9 Bayley-2 items were interspersed on an individual basis to maximize motivation and minimize fatigue. This methodology has the advantage of being more counterbalanced than previous study methods that have included assessment on different days, estimating Bayley-3 or Bayley-2 scores or administering relevant Bayley-2 items after Bayley-3.
Higher Bayley-3 scores were not unexpected since comparison of scores in typically developing infants in the standardization sample revealed mean Bayley-3 composite scores to be 7 points higher than Bayley-2 index scores. Inclusion of children with mild impairment (10%) in the Bayley-3 standardization sample, together with the inclusion of proportionately more (16%) Hispanic Americans, have been implicated as the most likely causes of generally higher Bayley-3 scores.10,13,14 Previous cohort studies reporting a higher mean Bayley-3 Cognitive Composite score than mean Bayley-2 MDI scores have found differences ranging from 3 to 18 points,10,12–14,16 probably relating to methodological and cohort differences between studies. We report median scores and found a 7-point difference between the Bayley-3 Cognitive Composite score and the Bayley-2 MDI with higher Bayley-3 scores (TableII). This is similar to a recent study reporting median scores in which a 9-point difference between the Bayley-2 MDI and the Bayley-3 Cognitive Composite score was found.15 The Bayley-2 MDI in our cohort had a slightly stronger correlation with the Bayley-3 Language Composite score than the Cognitive Composite score, as identified in previous studies.10,13 In common with two previous studies,13,16 we found the difference between Bayley-3 cognitive/language scores and the Bayley-2 MDI to be greater at the lower end of ability range – using the regression line where scores correspond (see Fig.2), the Bayley-3 CLC score is 22 points higher than a Bayley-2 MDI score equivalent of 50 compared with only 5 points higher when it corresponds to a Bayley-2 score of 100. This was also true for motor score comparisons but to a lesser degree (see Fig.3). As the focus of this study is on those infants scoring <70, greater discrepancies between test editions at the lower end of ability range are of particular concern because of the large numbers of infants at high risk of severe degrees of cognitive and motor impairment in neuroprotection trials.
Fewer previous studies have made comparisons of Bayley-2 and Bayley-3 motor scores.10,12,15 Two further studies compared motor outcome measured using different test versions in different eras.14,22 Bayley-3 Motor Composite scores were found to be higher than the Bayley-2 PDI with average differences ranging between 6 to 10 points.10,12,14,22 Our cohort had considerably higher Bayley-3 Motor Composite scores compared with the Bayley-2 PDI (see TableII). This is similar in magnitude to the 18-point higher Motor Composite score found in Australian term control infants compared with the Bayley-3 reference population mean of 100 and the 14-point higher median Bayley-3 Motor Composite score compared to Bayley-2 PDI found in a preterm cohort.15
Closer examination of motor subtest scores show our cohort at 18 months to have a mean Bayley-3 Fine Motor Scaled score well above the expected Bayley-3 USA norm-referenced mean of 10, whereas the mean Bayley-3 Gross Motor Scaled score was below the norm mean (TableII). Higher than expected Fine Motor Scaled scores would inflate the Bayley-3 Motor Composite score in relation to the Bayley-2 PDI which contains relatively few fine motor items and may explain the substantial difference between motor scores in our cohort. Higher than average Bayley-3 Fine Motor and lower than average Gross Motor Scaled scores have been found in UK-23 and Australian-based11 samples of typically developing infants. This may suggest cultural differences in gross and fine motor development in typically developing infants and warrants further investigation.
The first investigation of the predictive validity of the Bayley-3 Motor Composite score has recently been performed and found to underestimate later rates of motor impairment at 4 years on the Movement ABC-2 in preterm infants.24 However, there is also evidence to suggest that the Bayley-2 may overestimate impairment, particularly in relation to motor development.22,25,26 A study comparing preterm infant outcome during different eras of Bayley Scales use found Bayley-2 MDI and PDI scores to be lower than when using either previous or later editions.22 A lack of concurrent validity has been found between Bayley-2 PDI and the Peabody Developmental Motor Scale II (PDMS-2)25 but a strong correlation was found between Bayley-3 Motor Composite scores and the PDMS-2.26 Moreover, Bayley-2 motor raw scores in preterm infants showed very stable increases from 6 to 24 months,27 but following correction using Bayley-2 norm data, the resulting Bayley-2 PDI scores were unstable over the same time period. These findings suggest that the Bayley-2 may have underestimated motor performance and of note is that eight out of the 11 children with a Bayley-2 PDI of <70 in our cohort were independently ambulant at 18 months, whereas only three of the six children with Bayley-3 mMC scores of <70 were ambulant at 18 months. The absence of a typically developing control group in our study means we cannot conclude whether Bayley-3 underestimates and/or whether Bayley-2 overestimates developmental ability. Additional study of the long-term outcome of this cohort is required to determine which test version is the better predictor of motor and cognitive outcome.
Our Bayley Scale comparison findings in infants with neonatal encephalopathy add to recent studies that have identified higher scores using Bayley-3 Composite scores compared with Bayley-2 Index scores. In particular, we found that differences were more marked for motor development and for both motor and cognitive development in children of lower ability. We provide regression equations for infants with neonatal encephalopathy treated with hypothermia to convert mental and motor Bayley-2 Index scores to Bayley-3 Cognitive, Language and Motor Composite scores and vice versa if continuous data are required. The Bayley-3 cut-off <70 resulted in fewer children classified with severe delay compared with the Bayley-2. When comparing Bayley-3 Composite scores with Bayley-2 Index scores of <70 in neuroprotection trials for infants with neonatal encephalopathy, we recommend that a Bayley-3 threshold of <85 may be more appropriate as the cut-off for severe disability.
Acknowledgments
We acknowledge Helen Robinson MCSP, Clinical Specialist Paediatric Physiotherapist, Musgrove Park Hospital, Taunton, UK, for scoring filmed Bayley Scales of Infant Development assessments.
Glossary
- Bayley-2
Bayley Scales of Infant Development, Second Edition
- Bayley-3
Bayley Scales of Infant and Toddler Development, Third Edition
- CLC
Cognitive and Language Composite
- MDI
Mental Developmental Index
- mMC
Modified Motor Composite
- PDI
Psychomotor Developmental Index
Supporting Information
Appendix S1: Percentage interscorer agreement of 10 children.
Appendix S2: (a) Summary of Bayley-2 scores and Bayley-3 scores. (b) Formation of modified Bayley-3 scores to account for differences in item placement between Bayley-2 and Bayley-3.
Appendix S3: Scatter plots of relationships between Bayley-3 versus Bayley-2 scores (n=61).
References
- Bayley N. Bayley Scales of Infant Development. 2nd edn. San Antonio, TX: Psychological Corporation; 1993. [Google Scholar]
- Azzopardi DV, Strohm B, Edwards AD, et al. Moderate hypothermia to treat perinatal asphyxial encephalopathy. N Engl J Med. 2009;361:1349–58. doi: 10.1056/NEJMoa0900854. [DOI] [PubMed] [Google Scholar]
- Shankaran S, Laptook AR, Ehrenkranz RA, et al. Whole-body hypothermia for neonates with hypoxic–ischemic encephalopathy. N Engl J Med. 2005;353:1574–84. doi: 10.1056/NEJMcps050929. [DOI] [PubMed] [Google Scholar]
- Gluckman PD, Wyatt JS, Azzopardi D, et al. Selective head cooling with mild systemic hypothermia after neonatal encephalopathy: multicentre randomised trial. Lancet. 2005;365:663–70. doi: 10.1016/S0140-6736(05)17946-X. [DOI] [PubMed] [Google Scholar]
- Higgins RD, Raju T, Edwards AD, et al. Hypothermia and other treatment options for neonatal encephalopathy: an executive summary of the Eunice Kennedy Shriver NICHD Workshop. J Pediatr. 2011;159:851–8. doi: 10.1016/j.jpeds.2011.08.004. [DOI] [PMC free article] [PubMed] [Google Scholar]
- National Institute of Child Health and Human Development (NICHD) Evaluation of Systemic Hypothermia Initiated After 6 Hours of Age in Infants ≥36 Weeks Gestation with Hypoxic–ischemic Encephalopathy: A Bayesian Evaluation. A Protocol for the NICHD Neonatal Research Network. http://www.clinicaltrials.gov/ct2/show/NCT00614744 (accessed 5 July 2013)
- National Institute of Child Health and Human Development (NICHD) Optimizing Hypothermia as Neuroprotection at <6 Hours of Age for Neonatal Hypoxic–ischaemic Encephalopathy http://www.clinicaltrials.gov/ct2/show/NCT01192776 (accessed 5 July 2013)
- Thoresen M. 2011. The CoolXenon Study http://www.controlled-trials.com/ISRCTN75602528 (accessed 5 July 2013)
- Bayley N. Bayley Scales of Infant and Toddler Development. 3rd edn. San Antonio, TX: Harcourt Assessment Inc; 2006. [Google Scholar]
- Acton BV, Biggs WSG, Creighton DE, et al. Overestimating neurodevelopment using the Bayley-III after early complex cardiac surgery. Pediatrics. 2011;128:e794–800. doi: 10.1542/peds.2011-0331. [DOI] [PubMed] [Google Scholar]
- Anderson PJ, De LucaCR, Hutchinson E, Roberts G, Doyle LW Victorian Infant Collaborative G. Underestimation of developmental delay by the New Bayley-III Scale. Arch Pediatr Adolesc Med. 2010;164:352–6. doi: 10.1001/archpediatrics.2010.20. [DOI] [PubMed] [Google Scholar]
- Reuner GFA, Wittke A, Lopprich M, Pietz J. Comparison of the developmental tests Bayley-III and Bayley-II in 7-month old infants born preterm. Eur J Pediatr. 2012;172:393–400. doi: 10.1007/s00431-012-1902-6. [DOI] [PubMed] [Google Scholar]
- Moore T, Johnson S, Haider S, Hennessy E, Marlow N. Relationship between test scores using the second and third editions of the Bayley Scales in extremely preterm children. J Pediatr. 2012;160:553–8. doi: 10.1016/j.jpeds.2011.09.047. [DOI] [PubMed] [Google Scholar]
- Vohr BR, Stephens BE, Higgins RD, et al. Are outcomes of extremely preterm infants improving? Impact of Bayley assessment on outcomes. J Pediatr. 2012;161:222–8. doi: 10.1016/j.jpeds.2012.01.057. [DOI] [PMC free article] [PubMed] [Google Scholar]
- Silveira RC, Filipouski GR, Goldstein DJ, O'Shea T, Procianoy RS. Agreement between Bayley scales second and third edition assessments of very low-birth-weight infants. Arch Pediatr Adolesc Med. 2012;166:1075–6. doi: 10.1001/archpediatrics.2012.732. [DOI] [PubMed] [Google Scholar]
- Lowe JR, Erickson SJ, Schrader R, Duncan AF. Comparison of the Bayley II Mental Developmental Index and the Bayley III Cognitive Scale: are we measuring the same thing? Acta Paediatr. 2012;101:e55–8. doi: 10.1111/j.1651-2227.2011.02517.x. [DOI] [PMC free article] [PubMed] [Google Scholar]
- van Handel M, Swaab H, de Vries L, Jongmans M. Long-term cognitive and behavioral consequences of neonatal encephalopathy following perinatal asphyxia: a review. Eur J Pediatr. 2007;166:645–54. doi: 10.1007/s00431-007-0437-8. [DOI] [PMC free article] [PubMed] [Google Scholar]
- Murray DM, Bala P, O'Connor CM, Ryan CA, Connolly S, Boylan GB. The predictive value of early neurological examination in neonatal hypoxic–ischaemic encephalopathy and neurodevelopmental outcome at 24 months. Dev Med Child Neurol. 2010;52:e55–9. doi: 10.1111/j.1469-8749.2009.03550.x. [DOI] [PubMed] [Google Scholar]
- Edwards AD, Brocklehurst P, Gunn AJ, et al. Neurological outcomes at 18 months of age after moderate hypothermia for perinatal hypoxic ischaemic encephalopathy: synthesis and meta-analysis of trial data. BMJ. 2010;340:c363. doi: 10.1136/bmj.c363. [DOI] [PMC free article] [PubMed] [Google Scholar]
- Robinson BF, Mervis CB. Extrapolated raw scores for the second edition of the Bayley Scales of Infant Development. Am J Ment Retard. 1996;100:666–71. [PubMed] [Google Scholar]
- Hollander M, Wolfe DA. Nonparametric Statistical Methods. 2nd edn. New York: John Wiley; 1999. [Google Scholar]
- Synnes AR, Rogers M, Petrie-Thomas J, Wright S, Butt A. The Bayley Scales of infant and toddler development in extremely low birth weight survivors at 18 months corrected age. Paediatr Child Health. 2010;15:41A–2A. [Google Scholar]
- Bayley N. Bayley Scales of Infant and Toddler Development. 3rd edn. London: Pearson Assessment; 2010. UK and Ireland Supplement Manual. [Google Scholar]
- Spittle AJ, Spencer-Smith MM, Eeles AL, et al. Does the Bayley-III Motor Scale at 2 years predict motor outcome at 4 years in very preterm children? Dev Med Child Neurol. 2013;55:448–52. doi: 10.1111/dmcn.12049. [DOI] [PubMed] [Google Scholar]
- Connolly BH, Dalton L, Bengston Smith J, Lamberth NG, McCay B, Murphy W. Concurrent validity of the Bayley Scales of Infant Development II (BSID-II) Motor Scale and the Peabody Develomental Motor Scale II (PDMS-2) in 12 month old infants. Pediatr Phys Ther. 2006;18:190–6. doi: 10.1097/01.pep.0000226746.57895.57. [DOI] [PubMed] [Google Scholar]
- Connolly B, McClune N, Gatlin R. Concurrent validity of the Bayley-III and the Peabody Developmental Motor Scale-2. Pediatr Phys Ther. 2012;24:345–52. doi: 10.1097/PEP.0b013e318267c5cf. [DOI] [PubMed] [Google Scholar]
- Janssen AJ, Akkermans RP, Steiner K, et al. Unstable longitudinal motor performance in preterm infants from 6 to 24 months on the Bayley Scales of Infant Development–2nd edition. Res Dev Disabil. 2011;32:1902–9. doi: 10.1016/j.ridd.2011.03.026. [DOI] [PubMed] [Google Scholar]
Associated Data
This section collects any data citations, data availability statements, or supplementary materials included in this article.
Supplementary Materials
Appendix S1: Percentage interscorer agreement of 10 children.
Appendix S2: (a) Summary of Bayley-2 scores and Bayley-3 scores. (b) Formation of modified Bayley-3 scores to account for differences in item placement between Bayley-2 and Bayley-3.
Appendix S3: Scatter plots of relationships between Bayley-3 versus Bayley-2 scores (n=61).