Abstract
Purpose
To evaluate the capability of amide proton transfer (APT) MR imaging for detection of prostate cancer that typically shows a higher tumor cell proliferation rate and cellular density leading to an MRI-detectable overall elevated mobile protein level in higher grade tumors.
Materials and Methods
Twelve patients with biopsy-proven prostate cancer were imaged on a 3 Tesla MR imaging system before prostatectomy. APT-MR images were acquired by means of a single-slice single-shot turbo spin echo sequence with a saturation prepulse preparation using 33 different frequency offsets (−8 to 8 ppm, interval 0.5 ppm). For quantification we used the APT ratio (APTR) based on the asymmetry of the magnetization transfer ratio at 3.5 ppm in respect to the water signal. Tumor and peripheral zone benign regions of interest (ROIs) were delineated based on whole mount pathology slides after prostatectomy.
Results
APTR in prostate cancer ROIs was 5.8% 6 3.2%, significantly higher than that in the peripheral zone benign regions (0.3% ± 3.2%, P = 0.002).
Conclusion
APT-MR imaging is feasible in prostate cancer detection and has the potential to discriminate between cancer and noncancer tissues.
Keywords: amide proton transfer, chemical exchange saturation transfer, prostate cancer, mobile protein level, molecular imaging
Magnetic Resonance (MR) imaging can play an important role in the management of prostate cancer. MR imaging techniques, such as dynamic contrast-enhanced MR imaging based on microvasculature and microenvironment (1,2), diffusion-weighted MR imaging based on cellular membrane integrity (3,4), and MR spectroscopic imaging based on metabolites which are cellular/molecular imaging biomarkers (5,6) have shown to be valuable addition to anatomical imaging in prostate cancer detection and tumor staging. Multi-parametric MR imaging enables better prostate cancer detection by incorporating these techniques (7–10). Imaging-based prostate cancer management may be improved by using a new MR imaging method based on endogenous mobile protein level detection, as investigated in this study.
Chemical exchange saturation transfer (CEST) MR imaging has recently emerged as a new molecular imaging technique in which the contrast is determined by a change in water intensity due to chemical exchange with saturated solute protons (11). The CEST-MR imaging technique was first applied to biological tissues by Guivel-Scharen and colleagues (12) who reported that the chemical exchange between la-bile protons of low-concentration solute and water protons provided a sensitivity enhancement scheme that could be used as a new MR imaging contrast mechanism. This imaging technique has been applied to the measurement of pH effect in focal ischemia (13), glycosaminoglycan concentration in knee osteo-arthritis (14), artificial genetically engineered reporter (15), and liver glycogen distribution (16). The CEST approach, using endogenous amide protons (resonance frequency offset at 3.5 ± 0.5 ppm downfield of the water signal) in tissue, was termed amide proton transfer (APT) MR imaging (13). Before the APT-MR imaging method was invented, these mobile proteins were detected using MR spectroscopy with limited spatial resolution (17). APT-MR imaging showed large enhancement in sensitivity (11), thus allowing the detection of micromolar concentrations of mobile proteins in imaging with any existing clinical MR imaging scanners (18).
In this study, APT-MR imaging was used for the localization and characterization of prostate cancer. The applicability of APT-MR imaging on prostate cancer detection is based on the fact that high-grade prostate cancer typically shows a higher tumor cell proliferation rate and cellular density, which leads to overall elevated mobile protein levels (19). For example, one of the over-expressed proteins in prostate cancer is an androgen-regulated six trans-membrane protein, which is found to be a highly mobile protein in the cytosol of live cells (20). Another over-expressed protein in human metastatic prostate cancer cells is Caveolin-1 which mediates molecular transport, cell adhesion, and signal transduction activities (21). APT-MR imaging that is in principle sensitive to the concentration of these endogenous mobile proteins may considerably improve our ability to better localize prostate cancer and predict tumor volume and stage. Specifically, the high tumor cell proliferation rate was found in high-grade cancer, but low-grade prostate cancers (Gleason score components and lower) can be slow-growing (22). APT-MR imaging may be a good discriminator between low-grade and high-grade cancers and detect the difference in cancer aggressiveness in prostate cancer management.
MATERIALS AND METHODS
Study Design and Population
This prospectively designed, single institution study was approved by the local institutional review board and was compliant with the Health Insurance Portability and Accountability Act; informed consent was obtained from each patient. Twelve patients scheduled for prostatectomy were enrolled in the study between February 1, 2009 and November 30, 2009. The mean age of the patients was 58.5 years (range, 47–68 years), and the mean prostate specific antigen level was 14.9 ng/mL, with a median level of 7.0 ng/mL and a range of 4.1–8.7 ng/mL together with three outliers (24, 42, and 70 ng/mL). All patients had biopsy-proven prostate cancer; the median Gleason score was 7 (range, 7–9). The mean interval between biopsy and MR imaging of the prostate was 54 days (range, 25–117 days). The mean interval between MR imaging and prostatectomy was 31 days (range, 5–100 days). Additionally, one prostate cancer patient scheduled for radiation therapy was enrolled for measuring mobile protein levels in seminal vesicles (age, 61 years; prostate specific antigen level, 3.5 ng/mL).
MR Imaging Protocol
All patients were imaged on a 3 Tesla (T) MR system (Achieva, Philips Healthcare, Cleveland, OH) using a 32-channel phased array coil to image the prostate in a natural shape without deformity for co-registration with pathologic slides. Coronal T2-weighted images (TR/TE = 2686/100 ms; In-plane resolution 0.86 × 0.88 mm2, Slice thickness 3 mm; Acquisition time = 2.0 sagittal = min), T2-weighted images (TR/TE = 10163/100 ms; In-plane resolution 0.78 × 1.03 mm2, Slice thickness 3 mm; Acquisition time = 4.4 min), and transverse T2-weighted images (TR/TE = 4339/100 ms; In-plane resolution = 0.73 × 0.91 mm2, Slice thickness = 3 mm; Acquisition = time 3.3 min) were acquired using a turbo spin echo (TSE) sequence for the delineation of prostatic substructure as part of diagnostic imaging and guidance of APTMR imaging slice placement. APT-MR imaging was based on single-slice single-shot TSE with the following parameters: TR/TE = 6100/56 ms; TSE factor 47; Field of view 140 × 140 mm2; Matrix = 80 × 64; Slice thickness 6 =mm; Number of signal averages = 1. The saturation prepulse was composed of a train of sixteen 1800 block° pulses, each with a pulse length of 31 ms and saturation amplitude of 161.3 Hz (3.8 μT), which acts as a continuous pulse without inter-pulse delay. Magnetization transfer spectra with 33 different frequency offsets (−8 to 8 ppm, interval 0.5 ppm) were acquired in three transverse slices at the apex, middle, and base section of the prostate. One image without the saturation prepulse was acquired for the signal normalization. For the patient scheduled for radiation therapy, one transverse slice was acquired covering the seminal vesicles. The acquisition time was 3.56 min per slice.
Image Analysis
The APT-MR imaging analysis was performed using in-house developed software based on the Interactive Data Language (IDL, ITT Visual Information Solutions, Boulder, CO) environment. APT-MR images were automatically registered by implementing cross correlation techniques for subject motion during scans. The magnetization transfer spectra were fitted by a least-square polynomial with the degree of 20. From the fitted coefficients, the calculated magnetization transfer spectrum was interpolated into 1601 offsets with an offset resolution of 0.01 ppm. The frequency offset at the minimum of the interpolated magnetization transfer spectrum was defined as the water resonance frequency (B0) for field inhomogeneity correction. As described previously (18), APT-MR imaging was quantified using the APT ratio (APTR), which is associated with the magnetization transfer ratio (MTR) asymmetry at 3.5 ppm with respect to the water resonance:
where Ssat and S0 are the water signal intensities measured with and without the saturation prepulse, respectively. APTR was defined as:
where is the normalization factor for removing the effect of the direct water saturation and less noise-sensitive than Ssat(−3.5 ppm) (14,23).
Histopathologic Analysis
After surgical resection, the prostate specimen was cut into 2-inch × 3-inch format individual 3-mm sections. Representative tissue slices of 4-μm in thickness from each section were stained with hematoxylin-and-eosin (H&E). The pathologic slides were evaluated by trained and experienced uropathologists who identified tumor extent and location and also measured Gleason score. The pathologic slides were digitized to create electronic images with a correction factor (~1.12) for fixation related shrinkage (24). APT MR imaging was co-registered with pathologic slides using anatomical markers on clinical T2-weighted images, such as prostate natural contour and the presence of cysts and gross fibrous strands with the software package Medical Image Processing, Analysis and Visualization (MIPAV, National Institutes of Health, Bethesda, MD) (25). Regions of interest (ROIs) for the assessment of tumor mobile protein levels were defined within the tumor, as well as the peripheral zone (PZ) with no tumor. Within tumor ROIs, estimates of percent carcinoma and percent benign were given by uropathologists.
Statistical Analysis
A paired Student's t-test was performed in SPSS 16.0 (SPSS, Chicago, IL) to compare the APTR differences between the tumor and noncancerous benign regions. Student's t-test was performed to evaluate the APTR differences between PZ and transition zone (TZ) tumors, and between stage T2 and T3 diseases. Pearson correlation was performed to check the correlation between tumor APTR and percent carcinoma within tumor ROIs. A P value of 0.05 or less was considered to indicate a statistically significant difference.
RESULTS
Histopathologic evaluation revealed 9 cases with peripheral zone tumors and 3 cases with transition zone tumors. The ROIs on a PZ tumor (Fig. 1) and a TZ tumor (Fig. 2) were applied to APT-MR images. APTR was 6.5% ± 3.4% in PZ tumor ROIs, higher than APTR in 3.7% ± 1.1% in TZ tumors (P = 0.06).
Figure 1.
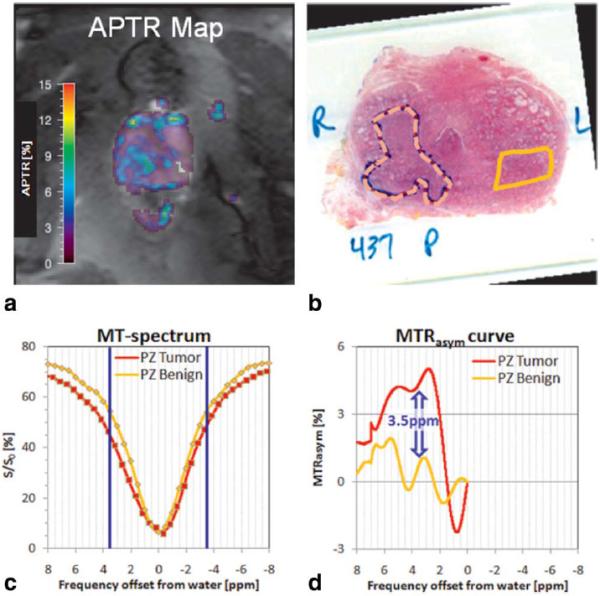
One subject with a tumor in the right PZ (Gleason score: 4 + 3 = 7, pathologic stage: T2c). a: The APTR map shows higher APTR values in the tumor region. b: The pathologic slide shows the tumor region (dashed line) and benign region (solid line) as delineated by uropathologists. c: After co-registering APT-MR images with the pathologic slide, the magnetization transfer spectra of the tumor (red curve) and PZ benign regions (yellow curve) are plotted, in which the blue lines mark MTR at 3.5 and −3.5 ppm. d: Tumor region shows much higher asymmetric MTR at 3.5 ppm and APTR (5.4%) than PZ benign region (APTR = 0.8%), indicating elevated mobile protein levels in prostate cancer.
Figure 2.
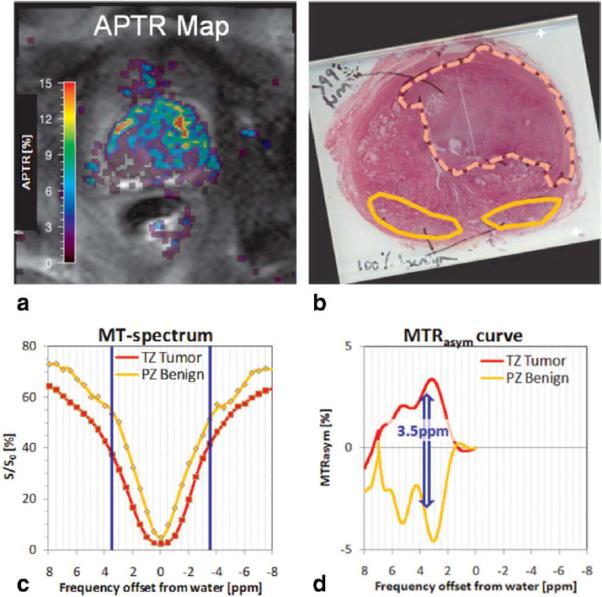
A case with a TZ tumor (Gleason score: 3 + 4 = 7, pathologic stage: T3b). a: The APTR map shows higher APTR values in the TZ tumor region. b: The pathologic slide shows the tumor region (dashed line) and two PZ benign regions (solid line). c: After co-registering APT-MR images with the pathologic slide, the magnetization transfer spectra of the tumor (red curve) and benign regions (yellow curve) are plotted, in which the blue lines mark MTR at 3.5 and −3.5 ppm. d: Tumor region shows much higher asymmetric MTR at 3.5 ppm and APTR (5.0%) than PZ benign region (APTR = −4.1%). [Color figure can be viewed in the online issue, which is available at wileyonlinelibrary.com.]
APTR in both PZ and TZ tumor ROIs was 5.8% ± 3.2%, significantly higher than that in the PZ benign ROIs (0.3% ± 3.2%, difference = 5.5% ± 5.3%, P = 0.002, Fig. 3). Within the tumor ROIs, the percent carcinoma was 74% ± 18% (range, 60–99%), which was not significantly correlated with APTR in tumor ROIs (Pearson correlation coefficient, −0.30; P = 0.35).
Figure 3.
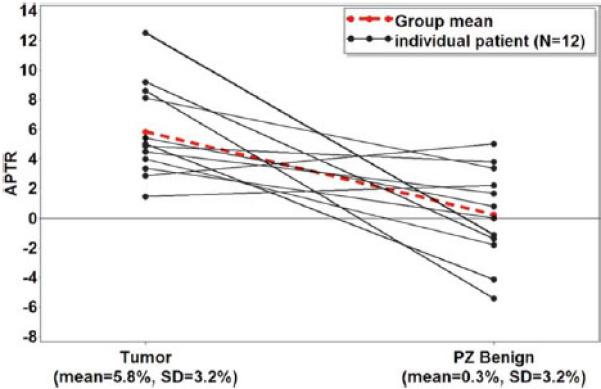
APTR in tumor and PZ benign regions from 12 prostate cancer patients. Tumor regions exhibit significantly higher APTR (5.8% ± 3.2%) than PZ benign regions (0.3% ± 3.2%). The significant difference (5.5% ± 5.3%) indicates that APT-MR imaging is capable of measuring increased mobile protein levels in cancerous regions of the prostate. [Color figure can be viewed in the online issue, which is available at wileyonlinelibrary.com.]
A total of seven ROIs were defined on stage T2 tumors, and five on stage T3 tumors. APTR was 4.5% ± 2.1% in stage T2 tumors, and 7.7% ± 3.6% in stage T3 tumors without significant differences (P = 0.06). Among the tumor ROIs, six were shown with=a Gleason score of 3 + 4 = 7, five Gleason scores of 4 + 3 = 7, and one Gleason score of 4 + 4 = 8. APTR was 6.4% ±2.6% in 3+ 4 = 7 tumors, 6.0% ± 3.7% in 4 + 3 = 7 tumors, and 1.44% in 5 + 4 =8.
An intraprostatic cyst in one case exhibited an elevated APTR (8.4%, Fig. 4). In the case with APT-MR imaging covering the seminal vesicles, no seminal vesicle invasion was found in the radiology report and APTR was 15.1% in the seminal vesicles (Fig. 5).
Figure 4.
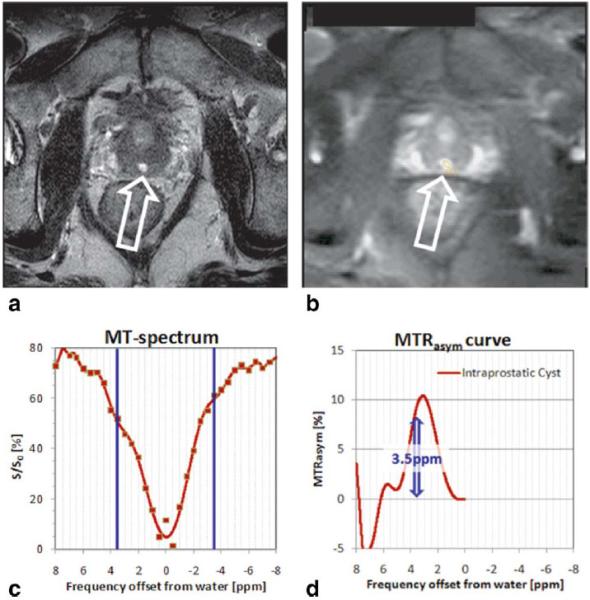
Intraprostatic cyst as shown in T2-weighted image (arrow) (a) and APT-MR image (b) exhibits asymmetric MTR at 3.5 ppm in magnetization transfer spectrum (c,d) with APTR of 8.4%. The MR imaging-detectable mobile protein levels in intraprostatic cysts are higher than the mean APTR in prostate cancer. [Color figure can be viewed in the online issue, which is available at wileyonlinelibrary.com.]
Figure 5.
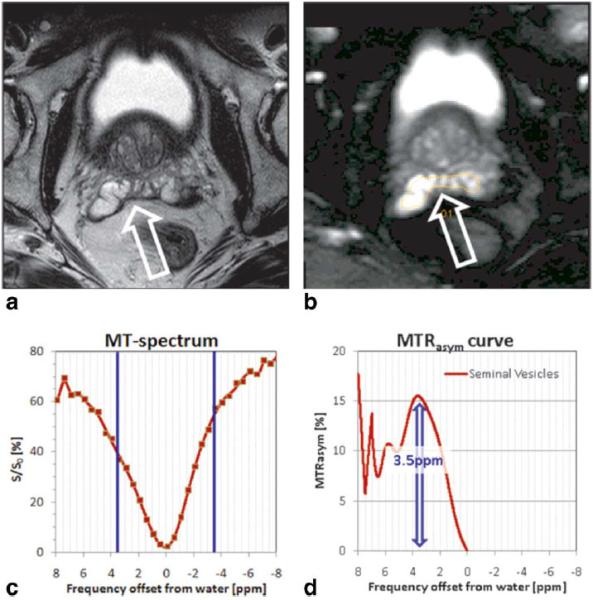
Seminal vesicles as shown in T2-weighted image (arrow) (a) and APT-MR image (b) exhibits asymmetric MTR at 3.5 ppm in magnetization transfer spectrum (c,d) with APTR of 15.1%. The MR imaging-detectable mobile protein levels in seminal vesicles are much higher than the mean APTR in prostate cancer. [Color figure can be viewed in the online issue, which is available at wileyonlinelibrary.com.]
DISCUSSION
APT-MR imaging was first applied to the prostate in this feasibility study and the initial experience from 12 prostate cancer patients reveals increased MR imaging-detectable mobile proteins in cancerous regions of the prostate. The sensitivity and specificity of APT-MR imaging of prostate cancer remains to be evaluated due to the small number of patients to compare it with other MR imaging methods. The study shows that 2 of the 12 cases (16%) have higher APTR for benign tissue relative to tumor tissue and 3 cases have a tumor APTR that is less than 3.5%, which is the average APTR of benign tissues (0.3%) plus one standard deviation (3.2%). Although the difference between tumor and PZ benign is significant, the overlap is very large, making it difficult to use in individual cases. As a comparison, the overlap in MR spectroscopic imaging of the choline plus creatine-tocitrate ratio between cancer and noncancer tissue is less (26) for detection and management of prostate cancer. One encouraging factor is that there are still many sequence opportunities to improve the efficacy of APT-MR imaging for prostate cancer detection. For example, further optimization of the parameters in saturation prepulse, such as pulse shape, power, duration, and saturation bandwidth based on theoretical calculation and numerical simulation, is possible (27) together with the recently available transmit SENSE technique (28). The optimization can also include the acquisition parameters and postprocessing methodology, such as TR (29), number of signal averages, CEST spectral resolution (0.5 ppm in this study), degree of polynomial, interpolation resolution, and whether 3.5 ppm is the best frequency to use for evaluating MTRasym and APTR. Amide protons in mobile protein backbones cannot be directly imaged due to low concentration (13) and short T2 relaxation time in regular sequences (30); however, an ultra-short echo time (UTE) imaging sequence may be used to directly detect the amide protons (31). Improvement of the APT-MR imaging technique may advance the potential of MR imaging of detectable mobile protein levels as an important marker for prostate cancer detection.
APT-MR imaging was shown to provide unique information about the presence of prostate cancer based on increased cellular content of mobile proteins, which is complementary to current MR imaging of the prostate and has several advantages. For example, compared with dynamic contrast-enhanced MR imaging, APT-MR imaging detects endogenous mobile proteins and does not require injection of a contrast agent (1). Based on the assumption that an elevated mobile protein level in prostate cancer is partly caused by higher cellular density, APT-MR imaging may reveal similar features to diffusion-weighted MR imaging, which quantifies the increased cellular density in tumor-bearing areas (3). However diffusion-weighted MR imaging can be nonspecific due to low diffusion in areas of benign hyperplasia (32). APT-MR imaging theoretically can be more specific for detecting not only cellular density, but also tumor cell proliferation rates that lead to overall elevated mobile protein levels. As a hot topic in prostate cancer management, the difference in cancer aggressiveness between low-grade and high-grade cancer based on cell proliferation rate may be detected with APT-MR imaging.
Besides cancerous regions, some benign structures can exhibit higher expressions of mobile proteins than tumor regions, such as intraprostatic cysts and seminal vesicles. However those regions typically are clearly delineated by T2-weighted imaging and can be validated with histopathologic findings, such as dilated acini. This initial experience can serve as a guide for future development of APT-MR imaging to allow tumor localization and prediction of seminal vesicle invasion (33).
APTR and MTRasym(3.5 ppm) are influenced not only by mobile protein levels, but also by pH value, T1 relaxation time, temperature (which affects the exchange rate), and water concentration, among other factors (11). First, pH value can vary with values ranging between 2.1 and 12.9 due to ionic movement to the electrode during galvanotherapy (34), which may be monitored by APT-MR imaging based on the sensitivity to pH effect (13). However, it is known that the intracellular pH is almost the same in the tumor and normal tissue (35); thus, the contribution of the possible pH variation to the measured APT-MR imaging contrast may be minimal. Another factor affecting APT-MR imaging signals is the T1 relaxation time, which is frequently reduced in regions of hemorrhage after biopsy with high signal intensity on T1-weighted MR images (36). The shortening of the T1 relaxation time can reduce APTR and the detectability of mobile protein levels. Therefore, a 3- to 8-week interval between biopsy and MR imaging may be preferable until a systematic investigation of the effect is completed. Our data shows several PZ benign ROIs exhibited negative APTR values, which does not indicate negative mobile protein concentrations. The negative APTR values may result from solid-like macromolecules as seen in the conventional magnetization transfer effect (resonance frequency offset at 2.3 ppm upfield of the water signal) (37) or the nuclear Over-hauser effect from the CH residue in tissue (2.6 ppm upfield of the water signal) (14).
One limitation of this study is that the APT-MR imaging sequence used here is a single-slice approach. Although three slices were acquired at the apex, middle, and base section of the prostate, tumors may be missed or only partially covered leading to misregistration. A fast APT-MR imaging technique using multiple-echo B0 field map (38) is being investigated to image the entire prostate using thinner slices and higher image resolutions for better co-registration with pathology slides and a time-efficient clinical application. Secondly, the APT-MR imaging is acquired with quite a long TE of 56 ms and a long spin echo train. The signal-to-noise ratio of short T2-tissue, such as prostate cancer, is lower than for longer T2-tissue, and short T2-tissue is blurred because of the long echo train, which may lower the reliability of APTR calculations. Further methodology development will address this issue, such as a T1-weighted Fast Low Angle Shot (FLASH) pulse sequence and an ultra-short echo time imaging sequence, which may be an alternative free of the T2 effect (29). Finally, matching histopathology with MR imaging is always a challenge: co-registration of slides with MR images assumes one has the corresponding slice and slide at hand, with the same angulation. Rigid registration was implemented even though the shape of the prostate in vivo may already be different from the shape on the slide, which may induce error in the definition of ROI on MR images. Detailed analysis of the preliminary data is limited due to less accurate co-registration between the in vivo APT-MR images and pathologic slides. In future studies, ex vivo prostate specimen T2-weighted MR imaging (39) can be implemented as an additional step and an elastic registration algorithm will be applied to facilitate a co-registration with the pathologic slides (40).
In conclusion, our data indicate APT-MR imaging is feasible in prostate cancer detection and has the potential to discriminate between cancer and non-cancer tissues. Furthermore, APTR is a quantitative prostate cancer imaging marker that can be spatially resolved and mapped.
ACKNOWLEDGMENT
We thank Dr. Stefan Fischer for the help on APT-MR imaging sequence development, Dr. Sungkyu Lee for helpful discussions on image review, and Melanie Hughes for proofreading.
Contract grant sponsors: the AUA Foundation Research Scholars Program and EUSA Pharma (USA), Inc; OSUMC Imaging Signature Program; Wright Center of Innovation in Biomedical Imaging.
REFERENCES
- 1.Barentsz JO, Engelbrecht M, Jager GJ, et al. Fast dynamic gadolinium-enhanced MR imaging of urinary bladder and prostate cancer. J Magn Reson Imaging. 1999;10:295–304. doi: 10.1002/(sici)1522-2586(199909)10:3<295::aid-jmri10>3.0.co;2-z. [DOI] [PubMed] [Google Scholar]
- 2.Kim JK, Hong SS, Choi YJ, et al. Wash-in rate on the basis of dynamic contrast-enhanced MRI: usefulness for prostate cancer detection and localization. J Magn Reson Imaging. 2005;22:639–646. doi: 10.1002/jmri.20431. [DOI] [PubMed] [Google Scholar]
- 3.Wang XZ, Wang B, Gao ZQ, et al. Diffusion-weighted imaging of prostate cancer: correlation between apparent diffusion coefficient values and tumor proliferation. J Magn Reson Imaging. 2009;29:1360–1366. doi: 10.1002/jmri.21797. [DOI] [PubMed] [Google Scholar]
- 4.Tamada T, Sone T, Jo Y, et al. Apparent diffusion coefficient values in peripheral and transition zones of the prostate: comparison between normal and malignant prostatic tissues and correlation with histologic grade. J Magn Reson Imaging. 2008;28:720–726. doi: 10.1002/jmri.21503. [DOI] [PubMed] [Google Scholar]
- 5.Near J, Romagnoli C, Curtis AT, et al. High-field MRSI of the prostate using a transmit/receive endorectal coil and gradient modulated adiabatic localization. J Magn Reson Imaging. 2009;30:335–343. doi: 10.1002/jmri.21841. [DOI] [PubMed] [Google Scholar]
- 6.Chen AP, Cunningham CH, Ozturk-Isik E, et al. High-speed 3T MR spectroscopic imaging of prostate with flyback echo-planar encoding. J Magn Reson Imaging. 2007;25:1288–1292. doi: 10.1002/jmri.20916. [DOI] [PubMed] [Google Scholar]
- 7.Kurhanewicz J, Swanson MG, Nelson SJ, Vigneron DB. Combined magnetic resonance imaging and spectroscopic imaging approach to molecular imaging of prostate cancer. J Magn Reson Imaging. 2002;16:451–463. doi: 10.1002/jmri.10172. [DOI] [PMC free article] [PubMed] [Google Scholar]
- 8.van Dorsten FA, van der Graaf M, Engelbrecht MR, et al. Combined quantitative dynamic contrast-enhanced MR imaging and (1)H MR spectroscopic imaging of human prostate cancer. J Magn Reson Imaging. 2004;20:279–287. doi: 10.1002/jmri.20113. [DOI] [PubMed] [Google Scholar]
- 9.Kozlowski P, Chang SD, Jones EC, Berean KW, Chen H, Goldenberg SL. Combined diffusion-weighted and dynamic contrast-enhanced MRI for prostate cancer diagnosis--correlation with biopsy and histopathology. J Magn Reson Imaging. 2006;24:108–113. doi: 10.1002/jmri.20626. [DOI] [PubMed] [Google Scholar]
- 10.Langer DL, van der Kwast TH, Evans AJ, Trachtenberg J, Wilson BC, Haider MA. Prostate cancer detection with multi-parametric MRI: logistic regression analysis of quantitative T2, diffusion-weighted imaging, and dynamic contrast-enhanced MRI. J Magn Reson Imaging. 2009;30:327–334. doi: 10.1002/jmri.21824. [DOI] [PubMed] [Google Scholar]
- 11.Goffeney N, Bulte JW, Duyn J, Bryant LH, Jr, van Zijl PC. Sensitive NMR detection of cationic-polymer-based gene delivery systems using saturation transfer via proton exchange. J Am Chem Soc. 2001;123:8628–8629. doi: 10.1021/ja0158455. [DOI] [PubMed] [Google Scholar]
- 12.Guivel-Scharen V, Sinnwell T, Wolff SD, Balaban RS. Detection of proton chemical exchange between metabolites and water in biological tissues. J Magn Reson. 1998;133:36–45. doi: 10.1006/jmre.1998.1440. [DOI] [PubMed] [Google Scholar]
- 13.Zhou J, Payen JF, Wilson DA, Traystman RJ, van Zijl PC. Using the amide proton signals of intracellular proteins and peptides to detect pH effects in MRI. Nat Med. 2003;9:1085–1090. doi: 10.1038/nm907. [DOI] [PubMed] [Google Scholar]
- 14.Ling W, Regatte RR, Navon G, Jerschow A. Assessment of glycosaminoglycan concentration in vivo by chemical exchange-dependent saturation transfer (gagCEST). Proc Natl Acad Sci U S A. 2008;105:2266–2270. doi: 10.1073/pnas.0707666105. [DOI] [PMC free article] [PubMed] [Google Scholar]
- 15.Gilad AA, McMahon MT, Walczak P, et al. Artificial reporter gene providing MRI contrast based on proton exchange. Nat Biotechnol. 2007;25:217–219. doi: 10.1038/nbt1277. [DOI] [PubMed] [Google Scholar]
- 16.van Zijl PC, Jones CK, Ren J, Malloy CR, Sherry AD. MRI detection of glycogen in vivo by using chemical exchange saturation transfer imaging (glycoCEST). Proc Natl Acad Sci U S A. 2007;104:4359–4364. doi: 10.1073/pnas.0700281104. [DOI] [PMC free article] [PubMed] [Google Scholar]
- 17.Mori S, Eleff SM, Pilatus U, Mori N, van Zijl PC. Proton NMR spectroscopy of solvent-saturable resonances: a new approach to study pH effects in situ. Magn Reson Med. 1998;40:36–42. doi: 10.1002/mrm.1910400105. [DOI] [PubMed] [Google Scholar]
- 18.Zhou J, Blakeley JO, Hua J, et al. Practical data acquisition method for human brain tumor amide proton transfer (APT) imaging. Magn Reson Med. 2008;60:842–849. doi: 10.1002/mrm.21712. [DOI] [PMC free article] [PubMed] [Google Scholar]
- 19.Cavalcanti FB, Alves VA, Pereira J, Kanamura CT, Wakamatsu A, Saldanha LB. Proliferative lesions of prostate: a multivariate approach to differential diagnosis. Pathol Oncol Res. 2005;11:103–107. doi: 10.1007/BF02893376. [DOI] [PubMed] [Google Scholar]
- 20.Korkmaz CG, Korkmaz KS, Kurys P, et al. Molecular cloning and characterization of STAMP2, an androgen-regulated six trans-membrane protein that is overexpressed in prostate cancer. Oncogene. 2005;24:4934–4945. doi: 10.1038/sj.onc.1208677. [DOI] [PubMed] [Google Scholar]
- 21.Yang G, Truong LD, Wheeler TM, Thompson TC. Caveolin-1 expression in clinically confined human prostate cancer: a novel prognostic marker. Cancer Res. 1999;59:5719–5723. [PubMed] [Google Scholar]
- 22.Verhagen PC, Tilanus MG, de Weger RA, van Moorselaar RJ, van den Tweel JG, Boon TA. Prognostic factors in localised prostate cancer with emphasis on the application of molecular techniques. Eur Urol. 2002;41:363–371. doi: 10.1016/s0302-2838(02)00048-9. [DOI] [PubMed] [Google Scholar]
- 23.Sun PZ, Zhou J, Huang J, van Zijl P. Simplified quantitative description of amide proton transfer (APT) imaging during acute ischemia. Magn Reson Med. 2007;57:405–410. doi: 10.1002/mrm.21151. [DOI] [PubMed] [Google Scholar]
- 24.Yoon GS, Wang W, Osunkoya AO, Lane Z, Partin AW, Epstein JI. Residual tumor potentially left behind after local ablation therapy in prostate adenocarcinoma. J Urol. 2008;179:2203–2206. doi: 10.1016/j.juro.2008.01.114. [DOI] [PMC free article] [PubMed] [Google Scholar]
- 25.McAuliffe MJ, Lalonde FM, McGarry D, Gandler W, Csaky K, Trus BL. Medical image processing, analysis & visualization In clinical research. IEEE Computer-based Medical Systems (CBMS) 2001:381–386. [Google Scholar]
- 26.Scheenen TW, Heijmink SW, Roell SA, et al. Three-dimensional proton MR spectroscopy of human prostate at 3 T without endorectal coil: feasibility. Radiology. 2007;245:507–516. doi: 10.1148/radiol.2451061444. [DOI] [PubMed] [Google Scholar]
- 27.Sun PZ. Simultaneous determination of labile proton concentration and exchange rate utilizing optimal RF power: radio frequency power (RFP) dependence of chemical exchange saturation transfer (CEST) MRI. J Magn Reson. 2009;202:155–161. doi: 10.1016/j.jmr.2009.10.012. [DOI] [PMC free article] [PubMed] [Google Scholar]
- 28.Katscher U, Bornert P, Leussler C, van den Brink JS. Transmit SENSE. Magn Reson Med. 2003;49:144–150. doi: 10.1002/mrm.10353. [DOI] [PubMed] [Google Scholar]
- 29.Liu G, Ali MM, Yoo B, Griswold MA, Tkach JA, Pagel MD. PARACEST MRI with improved temporal resolution. Magn Reson Med. 2009;61:399–408. doi: 10.1002/mrm.21863. [DOI] [PMC free article] [PubMed] [Google Scholar]
- 30.Chen W, Hu J. Mapping brain metabolites using a double echo-filter metabolite imaging (DEFMI) technique. J Magn Reson. 1999;140:363–370. doi: 10.1006/jmre.1999.1842. [DOI] [PubMed] [Google Scholar]
- 31.Blamire AM. The technology of MRI--the next 10 years? Br J Radiol. 2008;81:601–617. doi: 10.1259/bjr/96872829. [DOI] [PubMed] [Google Scholar]
- 32.Turkbey B, Pinto PA, Choyke PL. Imaging techniques for prostate cancer: implications for focal therapy. Nat Rev Urol. 2009;6:191–203. doi: 10.1038/nrurol.2009.27. [DOI] [PMC free article] [PubMed] [Google Scholar]
- 33.Wang L, Hricak H, Kattan MW, Chen HN, Scardino PT, Kuroiwa K. Prediction of organ-confined prostate cancer: incremental value of MR imaging and MR spectroscopic imaging to staging nomograms. Radiology. 2006;238:597–603. doi: 10.1148/radiol.2382041905. [DOI] [PubMed] [Google Scholar]
- 34.Vogl TJ, Mayer HP, Zangos S, Selby JB, Jr, Ackermann H, Mayer FB. Prostate cancer: MR imaging-guided galvanotherapy--technical development and first clinical results. Radiology. 2007;245:895–902. doi: 10.1148/radiol.2453061623. [DOI] [PubMed] [Google Scholar]
- 35.Griffiths JR. Are cancer cells acidic? Br J Cancer. 1991;64:425–427. doi: 10.1038/bjc.1991.326. [DOI] [PMC free article] [PubMed] [Google Scholar]
- 36.Tamada T, Sone T, Jo Y, et al. Prostate cancer: relationships between postbiopsy hemorrhage and tumor detectability at MR diagnosis. Radiology. 2008;248:531–539. doi: 10.1148/radiol.2482070157. [DOI] [PubMed] [Google Scholar]
- 37.Hua J, Jones CK, Blakeley J, Smith SA, van Zijl PC, Zhou J. Quantitative description of the asymmetry in magnetization transfer effects around the water resonance in the human brain. Magn Reson Med. 2007;58:786–793. doi: 10.1002/mrm.21387. [DOI] [PMC free article] [PubMed] [Google Scholar]
- 38.Windischberger C, Robinson S, Rauscher A, Barth M, Moser E. Robust field map generation using a triple-echo acquisition. J Magn Reson Imaging. 2004;20:730–734. doi: 10.1002/jmri.20158. [DOI] [PubMed] [Google Scholar]
- 39.Shah V, Pohida T, Turkbey B, et al. A method for correlating in vivo prostate magnetic resonance imaging and histopathology using individualized magnetic resonance-based molds. Rev Sci Instrum. 2009;80:104301. doi: 10.1063/1.3242697. [DOI] [PMC free article] [PubMed] [Google Scholar]
- 40.Cheung MR, Krishnan K. Interactive deformation registration of endorectal prostate MRI using ITK thin plate splines. Acad Radiol. 2009;16:351–357. doi: 10.1016/j.acra.2008.09.011. [DOI] [PubMed] [Google Scholar]


