Abstract
Purpose
To assess the association between RT-induced changes in computed tomography (CT)-defined lung tissue density and pulmonary function tests (PFTs).
Methods and Materials
Patients receiving incidental partial lung irradiation were prospectively assessed for global (PFTs) and regional (CT and SPECT [single photon emission computed tomography] scans) lung function pre- and serially post-RT. The percent reductions in PFTs and the average changes in lung density were compared (Pearson correlations) in the overall group and subgroups based on various clinical factors. Comparisons were also made between the CT- and SPECT-based computations using U test.
Results
From 1991–2004, 343 patients were enrolled. Of these, 111 patients had a total of 203 concurrent post-RT evaluations of changes in lung density and PFTs available for analyses, and 81 patients had a total of 141 concurrent post-RT SPECT images as well. The average increases in lung density were related to the percent reductions in PFTs, albeit with modest correlation coefficients (r) (range, 0.20 ~ 0.43). The analyses also indicate that the association between lung density and PFT changes is essentially equivalent to the corresponding association with SPECT-defined lung perfusion.
Conclusion
There is a weak quantitative association between the degree of increase in lung density as defined by CT and percent reduction in PFTs.
Keywords: Radiation induced lung injury, Lung density, Computed tomography, Pulmonary function tests, Single photon emission computed tomography defined lung perfusion
INTRODUCTION
Radiation-induced lung injury is common in patients receiving thoracic radiotherapy (RT) 1–3. The study of RT-induced lung injury is complicated by the multiple endpoints frequently considered (e.g., radiologic vs. symptomatic vs. functional) 4. Interpretation of the literature can be challenging since the reported frequency of injury is highly dependent on the endpoint considered 5–8, which may be impacted by potentially confounding clinical factors 9–12, and the association between the different endpoints is not entirely clear.
In 1991, we initiated a prospective clinical study to serially monitor RT-induced changes in regional lung density with computed tomography (CT), regional perfusion with single photon emission computed tomography (SPECT), pulmonary function tests (PFTs), and symptoms. We have previously reported on the association between changes in pulmonary symptoms and dosimetric predictors (i.e., V30 and mean lung dose) 1, the degree of changes in PFTs 4, 6-minute walk test (6MWT) 13, lung density 5, and perfusion 6. We have also tried to relate changes in PFTs to the extent of regional perfusion changes 14. We herein assess the association between quantitative changes in lung density and changes in PFTs. We hypothesize that patients who demonstrate greater changes in lung density will also manifest larger declines in PFTs.
METHODS
Since 1991, we initiated an Institutional Review Board approved prospective clinical trial to better understand RT-induced lung injury. Written informed consent was obtained. As part of this study, patients underwent pre-RT and serially (typically at 6-month intervals) post-RT PFTs, thoracic CT (to assess regional lung density), SPECT (to assess regional perfusion), and assessment of symptoms as previously described 4, 5, 15. The protocol called for CT and PFT assessment to be done at the same day. However, this was not always possible due to scheduling/logistical issues. Patients with post-RT anatomic changes that would confound the analysis were excluded, including those with radiographic evidence of tumor progression and/or pleural effusions. Patients with alternative reasons for declines in PFTs (i.e., COPD flair) were similarly excluded. Only patients with evaluations of changes in both lung density and PFTs assessed within 1 week of each other were studied.
Radiotherapy treatment technique
A CT scan was acquired for each patient in the treatment position, typically in an immobilization device. Patients with lung cancer typically underwent three-dimensional (3D) treatment planning. Patients planned using two-dimensional (2D) simulation techniques had their images imported into the treatment planning system (PLUNC: Plan University of North Carolina, Chapel Hill, NC). For all patients, the pre-RT CT dataset was used to calculate the 3D dose distribution utilizing tissue density inhomogeneity corrections. The lungs were segmented on the CT images automatically by the PLUNC using a thresholding method at a CT number between −300 and −400 Hounsfield units (HU) 5, and edited manually based on visual inspection. All computations of changes in lung density and perfusion described below were conducted within these CT-defined lungs. The intra-thoracic gross tumor was excluded from the lung. All doses refer to physical doses, without adjustments for fraction size.
The radiation technique for patients enrolled onto this protocol has previously been described 16. Patients with lung cancer generally received opposed anterior/posterior fields to 40–45 Gy; off-cord obliques boost to ≈ 66 Gy; all given in 2 Gy daily fractions. 15 patients received a hyperfractionated concurrent boost: 1.25 Gy BID to a clinical target volume and 1.6 Gy BID to gross disease (6-hour minimum inter-fraction interval) to 73.6 Gy. Patients with breast cancer received tangents to 46–50 Gy in 2 Gy daily fractions. Patients with lymphoma received anterior/posterior fields to ≈ 20–40 Gy in 1.5–1.8 Gy daily fractions.
PFTs
The PFTs included forced expiratory volume in 1 second (FEV1) and diffusion capacity for carbon monoxide (DLCO) 15. DLCO was corrected for hemoglobin 15, unless otherwise noted. The analysis was repeated using uncorrected DLCO to include data from patients without hemoglobin measurements. All values were considered as percentage of predicted (based on sex, height, and weight). Declines in PFTs were described as percent reduction from the pre-RT value, i.e., Percent Reduction in PFT = (1 − post/pre) * 100
CT
Each patient’s post-RT CT scans were manually registered to the pre-RT CT scan, based primarily on the lung volumes, using PLUNC. Registrations were performed in three dimensions. Post-RT scans were performed on a CT unit within radiation oncology department in the treatment position.
The absolute change in CT density (ΔCT), within each region of lung receiving a similar RT dose (d) was computed; with doses bin of 5 Gy intervals (e.g., 0–5, 5.1–10, etc.). Mean density change (i.e., volume-weighted) post-RT in the entire lung for each post-RT CT (relative to pre-RT CT) was computed. Mathematically,
where Vd is the volume of lung irradiated to dose d, and ΔCTd is the absolute change in CT number at dose d. This similar approach has been used to pool data regarding changes in regional perfusion assessed by SPECT 14.
SPECT
We have previously related the SPECT perfusion changes to PFTs declines 14. We herein include SPECT data to assess if the association between average changes in perfusion throughout the lung and PFT declines is “better or worse” than the association between changes in CT density and PFT declines.
SPECT images were registered with the planning CT and, hence, the 3D dose distribution. The percent SPECT counts in each dose bin (e.g., 0–5 Gy, 5.1–10 Gy) was used to generate a “dose SPECT-count histogram” (or dose-function histogram, DFH). Each patient’s pre- and post-RT DFHs were quantitatively compared to derive the patient-specific dose response curve (DRC) at each time point, demonstrating changes in regional perfusion vs. regional dose 11, 15. Assuming no RT-induced change in “low”-dose regions, the number of SPECT counts at all sites was normalized to the number of counts in areas receiving ≤ 5.0 Gy (0–5 Gy dose bin) 14. The percent change in perfusion throughout the lung was calculated as:
where Vd is the volume of lung irradiated to dose d, and Rd is the percent reduction in regional perfusion at dose d.
Data analysis
Many patients underwent only one post-RT assessment while others underwent repeated assessments. The overall group analysis described below was performed twice.
First, all data were considered including repeated post-RT measures at different time points from the same patient. Second, only one representative post-RT assessment was considered per patient. For this, several methods were used:
Considering data only at a specific post-RT follow-up interval, as used in a prior analysis 6;
Considering the average of post-RT data from a single patient; and
Considering the maximum change post-RT, i.e. trough in post-RT PFTs or peak in post-RT lung density changes.
The analysis was initially conducted on the entire patient population. Due to the potential impact of possible confounding clinical factors on lung function, analyses were repeated in subgroups based on the smoking history, tumor type (lung vs. non-lung), and the presence or absence of RT-associated pulmonary symptoms (≥ grade 2, i.e. requiring steroids, or worse). Further, since prior analysis demonstrated that patients with large central tumors and adjacent hypoperfusion (based on pre-RT SPECT scan) have a ≈ 50% probability of experiencing improvements in PFTs post RT 17, analysis was repeated excluding these patients. Since there may be surgery- or chemotherapy-associated changes in lung density, the analysis was repeated in subgroups based on pre-RT surgery or chemotherapy 9, 18–20. Last, the analysis was repeated using recognized PFT cut-offs (FEV1 < 2L, ≥ 2L; DLCO < 60%, ≥ 60% predicted) 21, since pre-RT PFTs might be considered for clinical decisions in routine treatments.
To assess if the association between mean perfusion changes and PFTs is “better or worse” than the association between CT density changes and PFTs, we identified a subset of patients with both pre- and post-RT SPECT and CT images. The results for the CT- and SPECT-based computations described above were compared.
Statistics
For each analysis, the average changes in lung density were related to the percent reductions in PFTs using the Pearson correlation. A comparison was made between correlation coefficients (r) using U test after Fisher’s z′ transformation.
RESULTS
343 patients were enrolled between 1991 and 2004. Of these, 111 patients were evaluable with a total of 203 concurrent post-RT evaluations of changes in both CT density and PFTs for analyses (table 1). The remainder of enrolled patients was unevaluable for a variety of reasons indcluding progressive tumor/death (n = 83), non-malignant pulmonary events (e.g., COPD flair, n = 35), post-RT surgery (e.g., pneumonectomy, n = 3), logistic/technical issues (n = 80), lost follow-up (n = 17), and/or other reasons (n = 14). Amongst patients with evaluable PFT data, hemoglobin values were available in 191 instances (94.1%). The association between average increases in lung density and percent reductions in DLCO and FEV1 for the overall group are shown in Table 2 and Figure 1. Significant correlations, albeit with modest correlation coefficients (r), were noted. Similar results were found for corrected DLCO (data not shown).
Table 1.
Patient Characteristics
| Characteristics (n = 111) | N |
|---|---|
| Sex | |
| Male | 52 (47%) |
| Female | 59 (53%) |
| Median age in years (range) | 62 (22–87) |
| Tumor type | |
| Lung cancer | 91 (82%) |
| Breast cancer | 13 (12%) |
| Lymphoma | 3 (3%) |
| Others* | 4 (3%) |
| Smoking history | 92 (83%) |
| Median pack years (range) | 40 (0–150) |
| Location of tumor (lung cancer) | |
| Central | 59 (53%) |
| Peripheral | 32 (29%) |
| COPD | 23 (21%) |
| Thoracic surgery prior to RT | 33 (30%) |
| Chemotherapy† | 55 (50%) |
| Mean lung dose (Gy) | 16.8 (4.2–35.5) |
| Symptomatic radiation pneumonitis§ | |
| Grade 0–1 | 84 (76%) |
| Grade 2–3 | 27 (24%) |
Kidney, melanoma, esophagus, thymus.
A modified version of the Common Toxicity Criteria of the National Cancer Institute was used 20, 30.
Most are platinum-based regimens received by lung cancer patients prior to RT.
Abbreviations: COPD = Chronic obstructive pulmonary disease; RT = radiation therapy.
Table 2.
Correlation between the average increases in lung density and reductions in PFTs for the overall group
| No. of tests | r | p-value | ||
|---|---|---|---|---|
| Overall – all data considered 3 to 24 months post-RT |
CT vs. DLCO | 203 | 0.26 | <0.001 |
| CT vs. FEV1 | 203 | 0.34 | <0.001 | |
| 6-month follow-up interval | CT vs. DLCO | 72 | 0.29 | 0.015 |
| CT vs. FEV1 | 72 | 0.35 | 0.003 | |
| Averaged data over all follow-up intervals | CT vs. DLCO | 111 | 0.23 | 0.016 |
| CT vs. FEV1 | 111 | 0.36 | <0.001 | |
| At the time of maximum PFT decline | CT vs. DLCO | 111 | 0.20 | 0.034 |
| CT vs. FEV1 | 111 | 0.30 | 0.001 | |
| At the time of maximum density increase | CT vs. DLCO | 111 | 0.17 | 0.070 |
| CT vs. FEV1 | 111 | 0.37 | <0.001 |
Abbreviations: DLCO = diffusion capacity for carbon monoxide; FEV1 = forced expiratory volume in 1 second; PFT = pulmonary function tests
Figure 1.
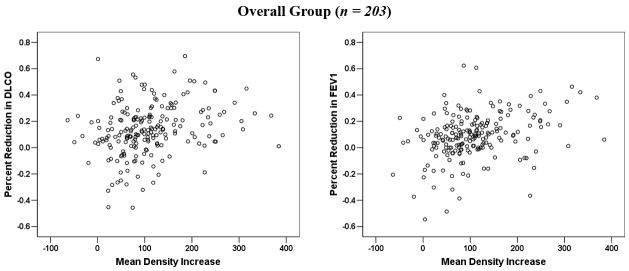
Comparison between the average changes in lung density and percent reductions in PFTs for all observations (n = 203).
In 62 patients, >1 post-RT measurement was performed. Multisampling in a single patient may introduce bias. The data were therefore reanalyzed considering a single post-RT value per patient. When analysis was restricted to the 72 patients with evaluable data at approximately 6 months post-RT, or the post-RT data from the 62 patients with repeated measures was averaged, or the maximum change was considered, the findings were largely similar (see Figure 2 (a–d) and Table 2).
Figure 2.
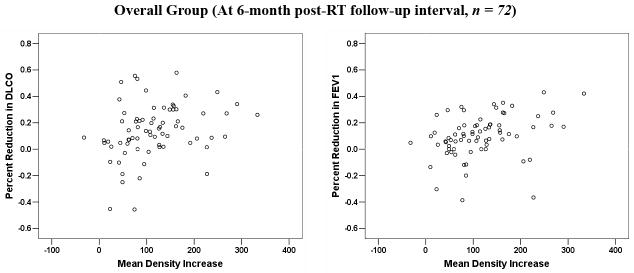
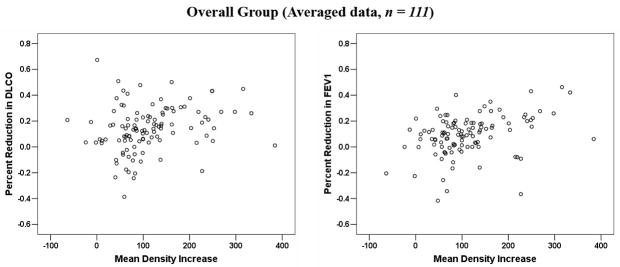
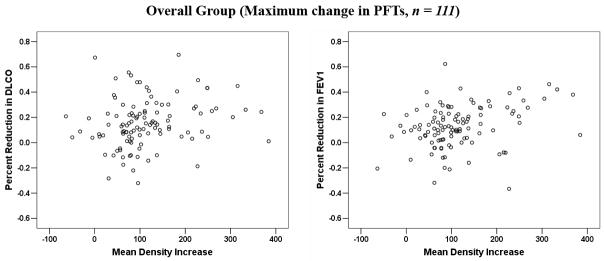
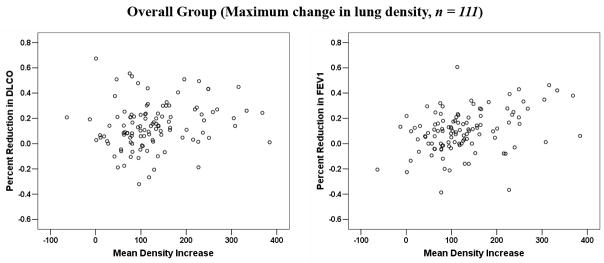
Comparison between the average changes in lung density and percent reductions in PFTs: (a) for patients at 6-month post-RT follow-up interval; (b) for all patients, with the results averaged for the 62 patients with > 1 assessments; (c) for all patients, with the maximum change in PFTs post-RT considered for the 62 patients with > 1 assessment; (d) for all patients, with the maximum change in lung density post-RT considered for the 62 patients with > 1 assessment.
The corresponding data for patients in various subgroups are shown in Table 3. Patients without smoking history, with non-lung cancer malignancies, and with pulmonary symptoms, make up only a small fraction of the population. When these patients were excluded from the analysis, the overall results did not change. The results in other subgroups based on the presence or absence of a central tumor and adjacent hypoperfusion, the use of surgery or chemotherapy, and pre-RT PFTs did not appear to markedly influence the results. However, the data are somewhat erratic in some of the smaller subgroups.
Table 3.
Correlation between the average increases in lung density and reductions in PFTs for the subgroups.
| Factors | Subgroups | No. of tests | r | p-value | |
|---|---|---|---|---|---|
| CT vs. DLCO | Smoking | smoker | 177 | 0.30 | <0.001 |
| non-smoker | 26 | −0.26 | 0.201 | ||
| Tumor type | lung | 172 | 0.31 | <0.001 | |
| non-lung | 31 | −0.11 | 0.556 | ||
| Pulmonary symptom | no symptom | 162 | 0.24 | 0.002 | |
| with symptom | 41 | 0.37 | 0.018 | ||
| Location of tumor | central | 105 | 0.28 | 0.004 | |
| peripheral | 67 | 0.37 | 0.002 | ||
| Surgery | surgery | 91 | 0.17 | 0.100 | |
| no surgery | 112 | 0.32 | 0.001 | ||
| Chemotherapy | chemotherapy | 101 | 0.34 | <0.001 | |
| no chemotherapy | 102 | 0.17 | 0.085 | ||
| Pre-RT DLCO | < 60% | 66 | 0.25 | 0.042 | |
| ≥ 60% | 137 | 0.24 | 0.004 | ||
| CT vs. FEV1 | Smoking | smoker | 177 | 0.36 | <0.001 |
| non-smoker | 26 | 0.18 | 0.378 | ||
| Tumor type | lung | 172 | 0.34 | <0.001 | |
| non-lung | 31 | 0.29 | 0.110 | ||
| Pulmonary symptom | no symptom | 162 | 0.35 | <0.001 | |
| with symptom | 41 | 0.21 | 0.199 | ||
| Location of tumor | central | 105 | 0.32 | 0.001 | |
| peripheral | 67 | 0.36 | 0.003 | ||
| Surgery | surgery | 91 | 0.43 | <0.001 | |
| no surgery | 112 | 0.29 | 0.002 | ||
| Chemotherapy | chemotherapy | 101 | 0.39 | <0.001 | |
| no chemotherapy | 102 | 0.29 | 0.004 | ||
| Pre-RT FEV1 | < 2 L | 105 | 0.26 | 0.008 | |
| ≥ 2 L | 98 | 0.41 | < 0.001 |
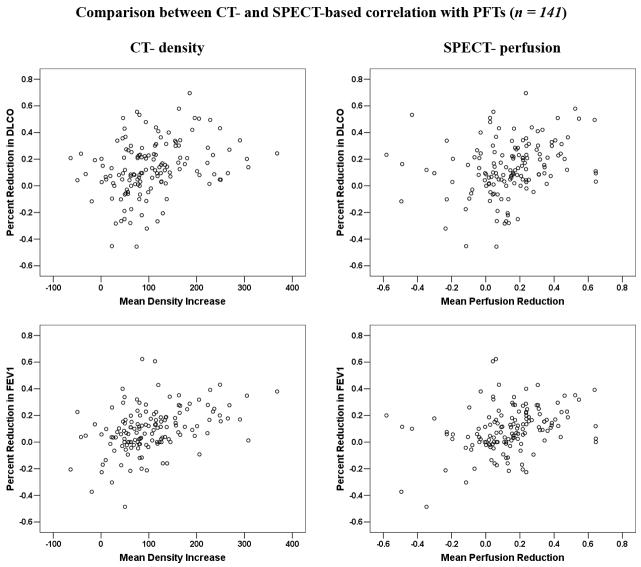
In the entire population, 81 patients had a total of 141 concurrent post-RT SPECT and CT images. Only one post-RT assessment was made in 38 patients and multiple measures in the other 43. The association between the percent reduction in PFTs and the average increase in lung density, or SPECT perfusion reduction for this subgroup are shown in Table 4 and Figure 3. Significant correlations were revealed for both CT- and SPECT- based computations. The correlation coefficients (r) were modest, but appeared slightly higher for the association between changes in PFTs and CT density, than that for corresponding association with changes in SPECT perfusion. However, the difference is statistically insignificant (p = 0.25, 0.25, and 0.23 for DLCO, corrected DLCO, and FEV1, respectively).
Table 4.
Comparisons between CT-defined lung density-based and SPECT lung perfusion-based correlations with the changes in PFTs
| Methods | No. of tests | r | p-value | p-value* | |
|---|---|---|---|---|---|
| DLCO | SPECT-based | 141 | 0.26 | 0.002 | 0.25 |
| CT-based | 141 | 0.34 | <0.001 | ||
| FEV1 | SPECT-based | 141 | 0.33 | <0.001 | 0.23 |
| CT-based | 141 | 0.41 | <0.001 |
Comparisons between correlation coefficients for CT- and SPECT-based comparisons
Abbreviations: SPECT = single photon emission computed tomography; CT = computed tomography; other abbreviations as in Table 2.
Figure 3.
Comparison between the average increases of CT-based lung density, the average decreases of SPECT-based lung perfusion, and their associations with percent reductions in PFTs for patients with concurrent PFTs, CT, and SPECT scans.
DISCUSSION
RT-induced pulmonary injury is common after thoracic irradiation. The reported incidence of such injury varies widely, and is primarily dependent on the chosen endpoint. Among those patients receiving RT for thoracic malignancies, approximately 5–30% develop symptomatic radiation pneumonitis (RP), 50–100% develop radiologic evidence of regional injury, and 50–90% experience declines in pulmonary function 4, 22–25.
Several studies have successfully related 3D dose-volume histogram (DVH)-based metrics (e.g., the percent lung volume receiving ≥20–30Gy) to the rates of symptomatic radiation pneumonitis 1–3, 23. More recent studies, some using a larger number of beam orientations, have implicated the lung volume receiving 5–13 Gy 22, 26, 27. Such volume-based metrics are commonly used to evaluate treatment plans and they are considered to be “physiologically logical” since the lung’s functional subunits are structured in parallel with each other (i.e., each region of the lung may function relatively independently). Therefore, it’s reasonable to postulate that percent changes in global lung function (i.e., assessed by PFTs) would correlate with the average changes in regional lung function assessed by SPECT or CT. Our group, and investigators at the Netherlands Cancer Institute (NKI), have used SPECT lung perfusion scans to relate changes in regional dose. In independent analyses, from both institutions, DRCs from many patients were summed to generate population-based DRCs 11, 12. Studies from Duke University 16 and NKI 28 have attempted to quantitatively relate post-RT declines in PFTs to the sum of regional reductions in perfusion and/or ventilation (either actual reductions or predicted reductions based on population DRCs). Overall, statistically significant correlations existed between the sum of regional injuries and reductions in PFTs 14, 16, 28. However, the correlations were only fair, suggesting that changes in perfusion/ventilation alone are not sufficient to accurately predict the changes in PFTs. A study from M.D. Anderson Cancer Center suggested that there may be an association between grade ≥ 2 pulmonary symptoms and a DLCO loss of > 30% 29.
An alternative method to assess RT-induced regional lung injury is tissue density assessed with conventional CT. Quantitative analyses of changes in lung density have been reported previously by Duke 5, NKI 30, Princess Margaret Hospital (PMH) 20, and others 10, 24, 31. The current study attempted to relate changes in individual patient’s lung density with changes in the PFTs.
The association between changes in lung density and PFT values
The current analysis suggests that there is a quantitative association between the degree of increase in lung density as defined by CT and declines in PFTs. This was true in the overall group as well as in most of the subgroups considered. However, the correlations are weak. This suggests that other factors beyond regional tissue density impact on PFTs. This might also suggest that CT density and PFTs may not be ideal measures of regional and global lung function, respectively. Further, there likely are additional clinical factors that confound changes noted on CT and with PFTs.
One of the reasons that we have included SPECT in our studies is our belief that SPECT imaging provides a more physiologic assessment of lung function than does CT. However, we have observed that the average of SPECT perfusion changes appears not to be better correlated with PFT changes than the average of CT density changes 14.
Handling of repeated assessments
Several measures were taken to consider the potential bias introduced by multiple data points from a single patient. Restriction of our analyses to data at 6 months post-RT modestly improved our correlation coefficients. When multiple assessments from a single patient were averaged, and combined with data from patients with single assessment to form a new dataset, the correlations were still significant for all comparisons. As described, alternative methods to address these multiple data points were also considered, and in all cases, the correlation coefficients were modest.
Potential confounding clinical factors
Previous studies have shown that global lung function is affected by factors unrelated to subsequent RT (e.g., smoking history, pre-RT surgery, etc.) 9, 17–20, 31. For example, we observed that patients with SPECT perfusion defects adjacent to a central mediastinal mass might have improved PFTs following RT 17. Such phenomena may limit our ability to relate increases in lung density and PFTs declines. In the current analysis, results were essentially similar in all subgroups. Interestingly, the correlation coefficients appeared to increase when the data from patients with centrally located tumor (i.e. those more likely to have regional dysfunction due to mass-effect from the tumor) were excluded from the analyses. This suggests that it is logical to consider these patients independently as they appear to potentially confound the analysis.
The data were similar in the groups with and without chemotherapy. In the current analysis, most lung cancer patients received platinum-based chemotherapy prior to RT. There are data to suggest that certain chemotherapeutics can increase the probability of pulmonary fibrosis, and therefore might increase lung density 19, 20. Rosen et al. 19 noted a complex interaction between chemotherapy and radiation fractionation. Higher rates of CT-defined pulmonary fibrosis were seen in patients treated with BID vs. QD fractionation (when given with cisplatin and etoposide [PE] chemotherapy). However, BID radiation plus cisplatin, ifosfamide, and etoposide (PIE) chemotherapy (different doses and schedules than the PE treated patients) had a relatively low rate of fibrosis. Chemotherapy can also affect PFTs, the extent of which has not been firmly established 9, 18, 31, 32. Generally, the impact of chemotherapy on RT-induced changes in lung density and PFTs might depend on the regimens used and the timing of chemoradiation 32. Due to the increasing use of chemotherapy in patients with tumors in and around the thorax, more work is necessary to better understand the interactions between chemotherapy and RT-induced lung injury.
The results did not change much when the analysis was repeated using recognized PFTs cut-offs. A prior analysis from our institution 33 and an additional study from RTOG 34, did not implicate pre-RT PFT values as predictors for subsequent development of pulmonary toxicity. Thus, the importance of pre-RT PFT’s remains uncertain.
Implications of the current study
The association between the average increase in lung density and PFTs reductions does not prove a “cause and effect”. Nevertheless, the association does support the general hypothesis that percent changes in global lung function may represent the average changes in regional lung function (i.e., that the lung is structured in “parallel”). The latter may be related to radiologic changes such as reductions in regional perfusion or an increase in CT density.
Limitations of this study
This study has several limitations. First, differences in the acquisition of pre-RT CT scans and post-RT follow-up scans may impact the accuracy of CT and SPECT registration 35. Planning CT scans were performed in the treatment position with or without immobilization devices while follow-up CT and SPECT scans were obtained without such devices. Thus, small deviations in CT registration may have caused errors in the computation of both the dose and volume of the lung, and therefore affect the certainty of CT density and perfusion changes. However, since the RT fields used in these cases were generally large, modest registration inaccuracies are not likely to markedly alter the results. Further, all post-RT CT scans were performed on a flat table top, and all SPECT and CT scans were performed in the approximate treatment position.
Second, we did not consider the potential impact of respiratory motion, fibrotic retraction, and other pathophysiological changes 24, 36. These factors might introduce healthy lung tissue into the originally-irradiated volume resulting in computation errors in dose and volume, lung density differences, and perfusion changes.
Third, the timing/frequency of follow-up CT and SPECT and PFT was quite variable, despite attempts to perform them at similar intervals after RT. In practice, it was logistically challenging to study these patients. Many patients developed progressive disease and became unevaluable. Even evaluable patients had concurrent medical and social/logistical factors making it difficult to obtain the necessary tests in this relatively-ill patient population.
Future research and conclusions
The correlations between the average increases in lung density and PFTs declines are weak. Thus, ability to predict percent changes in PFTs based on anticipated changes in average regional lung density (or perfusion) appears limited. Future studies will consider assessments of regional injury based on both density and perfusion, and include biological/functional information into our models 37, 38. In addition, dose-volume relations, and additional clinical variables (e.g., prior-RT lung function, Performance Status, co-existing diseases, etc.) should also be considered. On all accounts, more accurate models are needed to predict the risk of clinically relevant RT-induced lung injury. Development of predictive models might allow radiation oncologists to better optimize RT treatment planning and the therapeutic ratio.
Acknowledgments
Thanks to Robert Clough, Phil Antoine, and Andrea Tisch for assisting with data collection, and the UNC at Chapel Hill for PLUNC treatment planning software; Supported by Grant R29-CA69579, from the NCI.
Footnotes
Meeting presentation: Submitted to the 50th Annual Meeting of the American Society for Therapeutic Radiology and Oncology (ASTRO), Boston, MA, September, 2008
CONFLICTS OF INTEREST NOTIFICATION
Dr. Marks has received honoraria from Varian Medical Systems, and grant support from the NIH, Lance Armstrong Foundation, and Department of Defense.
Publisher's Disclaimer: This is a PDF file of an unedited manuscript that has been accepted for publication. As a service to our customers we are providing this early version of the manuscript. The manuscript will undergo copyediting, typesetting, and review of the resulting proof before it is published in its final citable form. Please note that during the production process errors may be discovered which could affect the content, and all legal disclaimers that apply to the journal pertain.
References
- 1.Hernando ML, Marks LB, Bentel GC, et al. Radiation-induced pulmonary toxicity: a dose-volume histogram analysis in 201 patients with lung cancer. Int J Radiat Oncol Biol Phys. 2001;51:650–659. doi: 10.1016/s0360-3016(01)01685-6. [DOI] [PubMed] [Google Scholar]
- 2.Kwa SL, Lebesque JV, Theuws JC, et al. Radiation pneumonitis as a function of mean lung dose: an analysis of pooled data of 540 patients. Int J Radiat Oncol Biol Phys. 1998;42:1–9. doi: 10.1016/s0360-3016(98)00196-5. [DOI] [PubMed] [Google Scholar]
- 3.Graham MV, Purdy JA, Emami B, et al. Clinical dose-volume histogram analysis for pneumonitis after 3D treatment for non-small cell lung cancer (NSCLC) Int J Radiat Oncol Biol Phys. 1999;45:323–329. doi: 10.1016/s0360-3016(99)00183-2. [DOI] [PubMed] [Google Scholar]
- 4.Marks LB, Fan M, Clough R, et al. Radiation-induced pulmonary injury: symptomatic versus subclinical endpoints. Int J Radiat Biol. 2000;76:469–475. doi: 10.1080/095530000138466. [DOI] [PubMed] [Google Scholar]
- 5.Levinson B, Marks LB, Munley MT, et al. Regional dose response to pulmonary irradiation using a manual method. Radiother Oncol. 1998;48:53–60. doi: 10.1016/s0167-8140(98)00057-7. [DOI] [PubMed] [Google Scholar]
- 6.Woel RT, Munley MT, Hollis D, et al. The time course of radiation therapy-induced reductions in regional perfusion: a prospective study with >5 years of follow-up. Int J Radiat Oncol Biol Phys. 2002;52:58–67. doi: 10.1016/s0360-3016(01)01809-0. [DOI] [PubMed] [Google Scholar]
- 7.Monson JM, Stark P, Reilly JJ, et al. Clinical radiation pneumonitis and radiographic changes after thoracic radiation therapy for lung carcinoma. Cancer. 1998;82:842–850. [PubMed] [Google Scholar]
- 8.Boersma LJ, Damen EMF, de Boer RW, et al. Estimation of overall pulmonary function after irradiation using dose-effect relations for local functional injury. Radiotherapy and Oncology. 1995;36:15–23. doi: 10.1016/0167-8140(95)01580-a. [DOI] [PubMed] [Google Scholar]
- 9.Mao J, Kocak Z, Zhou S, et al. The impact of induction chemotherapy and the associated tumor response on subsequent radiation-related changes in lung function and tumor response. Int J Radiat Oncol Biol Phys. 2007;67:1360–1369. doi: 10.1016/j.ijrobp.2006.11.003. [DOI] [PMC free article] [PubMed] [Google Scholar]
- 10.Wennberg B, Gagliardi G, Sundbom L, et al. Early response of lung in breast cancer irradiation: radiologic density changes measured by CT and symptomatic radiation pneumonitis. Int J Radiat Oncol Biol Phys. 2002;52:1196–1206. doi: 10.1016/s0360-3016(01)02770-5. [DOI] [PubMed] [Google Scholar]
- 11.Garipagaoglu M, Munley MT, Hollis D, et al. The effect of patient-specific factors on radiation-induced regional lung injury. Int J Radiat Oncol Biol Phys. 1999;45:331–338. doi: 10.1016/s0360-3016(99)00201-1. [DOI] [PubMed] [Google Scholar]
- 12.Theuws JC, Kwa SL, Wagenaar AC, et al. Dose-effect relations for early local pulmonary injury after irradiation for malignant lymphoma and breast cancer. Radiother Oncol. 1998;48:33–43. doi: 10.1016/s0167-8140(98)00019-x. [DOI] [PubMed] [Google Scholar]
- 13.Mao J, Zhang J, Zhou S, et al. Updated assessment of the six-minute walk test as predictor of acute radiation-induced pneumonitis. Int J Radiat Oncol Biol Phys. 2007;67:759–767. doi: 10.1016/j.ijrobp.2006.10.001. [DOI] [PubMed] [Google Scholar]
- 14.Fan M, Marks LB, Lind P, et al. Relating radiation-induced regional lung injury to changes in pulmonary function tests. Int J Radiat Oncol Biol Phys. 2001;51:311–317. doi: 10.1016/s0360-3016(01)01619-4. [DOI] [PubMed] [Google Scholar]
- 15.Marks LB, Munley MT, Bentel GC, et al. Physical and biological predictors of changes in whole-lung function following thoracic irradiation. Int J Radiat Oncol Biol Phys. 1997;39:563–570. doi: 10.1016/s0360-3016(97)00343-x. [DOI] [PubMed] [Google Scholar]
- 16.Fan M, Marks LB, Hollis D, et al. Can we predict radiation-induced changes in pulmonary function based on the sum of predicted regional dysfunction? J Clin Oncol. 2001;19:543–550. doi: 10.1200/JCO.2001.19.2.543. [DOI] [PubMed] [Google Scholar]
- 17.Marks LB, Hollis D, Munley M, et al. The role of lung perfusion imaging in predicting the direction of radiation-induced changes in pulmonary function tests. Cancer. 2000;88:2135–2141. [PubMed] [Google Scholar]
- 18.Krengli M, Sacco M, Loi G, et al. Pulmonary Changes after Radiotherapy for Conservative Treatment of Breast Cancer: A Prospective Study . Int J Radiat Oncol Biol Phys. 2007 doi: 10.1016/j.ijrobp.2007.08.050. [DOI] [PubMed] [Google Scholar]
- 19.Rosen II, Fischer TA, Antolak JA, et al. Correlation between lung fibrosis and radiation therapy dose after concurrent radiation therapy and chemotherapy for limited small cell lung cancer. Radiology. 2001;221:614–622. doi: 10.1148/radiol.2213992043. [DOI] [PubMed] [Google Scholar]
- 20.Mah K, Keane TJ, Van Dyk J, et al. Quantitative effect of combined chemotherapy and fractionated radiotherapy on the incidence of radiation-induced lung damage: a prospective clinical study. Int J Radiat Oncol Biol Phys. 1994;28:563–574. doi: 10.1016/0360-3016(94)90180-5. [DOI] [PubMed] [Google Scholar]
- 21.Videtic GM, Stitt LW, Ash RB, et al. Impaired diffusion capacity predicts for decreased treatment tolerance and survival in limited stage small cell lung cancer patients treated with concurrent chemoradiation. Lung Cancer. 2004;43:159–166. doi: 10.1016/j.lungcan.2003.08.026. [DOI] [PubMed] [Google Scholar]
- 22.Allen AM, Czerminska M, Janne PA, et al. Fatal pneumonitis associated with intensity-modulated radiation therapy for mesothelioma. Int J Radiat Oncol Biol Phys. 2006;65:640–645. doi: 10.1016/j.ijrobp.2006.03.012. [DOI] [PubMed] [Google Scholar]
- 23.Kong F-M, Hayman JA, Griffith KA, et al. Final toxicity results of a radiation-dose escalation study in patients with non-small-cell lung cancer (NSCLC): Predictors for radiation pneumonitis and fibrosis. International Journal of Radiation Oncology*Biology*Physics. 2006;65:1075–1086. doi: 10.1016/j.ijrobp.2006.01.051. [DOI] [PubMed] [Google Scholar]
- 24.Kahan Z, Csenki M, Varga Z, et al. The risk of early and late lung sequelae after conformal radiotherapy in breast cancer patients. Int J Radiat Oncol Biol Phys. 2007;68:673–681. doi: 10.1016/j.ijrobp.2006.12.016. [DOI] [PubMed] [Google Scholar]
- 25.Yom SS, Liao Z, Liu HH, et al. Initial evaluation of treatment-related pneumonitis in advanced-stage non-small-cell lung cancer patients treated with concurrent chemotherapy and intensity-modulated radiotherapy. Int J Radiat Oncol Biol Phys. 2007;68:94–102. doi: 10.1016/j.ijrobp.2006.12.031. [DOI] [PubMed] [Google Scholar]
- 26.Wang SL, Liao Z, Vaporciyan AA, et al. Investigation of clinical and dosimetric factors associated with postoperative pulmonary complications in esophageal cancer patients treated with concurrent chemoradiotherapy followed by surgery. Int J Radiat Oncol Biol Phys. 2006;64:692–699. doi: 10.1016/j.ijrobp.2005.08.002. [DOI] [PubMed] [Google Scholar]
- 27.Uno T, Isobe K, Kawakami H, et al. Dose-volume factors predicting radiation pneumonitis in patients receiving salvage radiotherapy for postlobectomy locoregional recurrent non-small-cell lung cancer. Int J Clin Oncol. 2006;11:55–59. doi: 10.1007/s10147-005-0542-5. [DOI] [PubMed] [Google Scholar]
- 28.Theuws JC, Kwa SL, Wagenaar AC, et al. Prediction of overall pulmonary function loss in relation to the 3-D dose distribution for patients with breast cancer and malignant lymphoma. Radiother Oncol. 1998;49:233–243. doi: 10.1016/s0167-8140(98)00117-0. [DOI] [PubMed] [Google Scholar]
- 29.Gopal R, Tucker SL, Komaki R, et al. The relationship between local dose and loss of function for irradiated lung. Int J Radiat Oncol Biol Phys. 2003;56:106–113. doi: 10.1016/s0360-3016(03)00094-4. [DOI] [PubMed] [Google Scholar]
- 30.Boersma LJ, Damen EM, de Boer RW, et al. Dose-effect relations for local functional and structural changes of the lung after irradiation for malignant lymphoma. Radiother Oncol. 1994;32:201–209. doi: 10.1016/0167-8140(94)90019-1. [DOI] [PubMed] [Google Scholar]
- 31.Jaen J, Vazquez G, Alonso E, et al. Changes in pulmonary function after incidental lung irradiation for breast cancer: A prospective study. International Journal of Radiation Oncology*Biology*Physics. 2006;65:1381–1388. doi: 10.1016/j.ijrobp.2006.03.008. [DOI] [PubMed] [Google Scholar]
- 32.Gopal R, Starkschall G, Tucker SL, et al. Effects of radiotherapy and chemotherapy on lung function in patients with non-small-cell lung cancer. Int J Radiat Oncol Biol Phys. 2003;56:114–120. doi: 10.1016/s0360-3016(03)00077-4. [DOI] [PubMed] [Google Scholar]
- 33.Lind PA, Marks LB, Jamieson TA, et al. Predictors for pneumonitis during locoregional radiotherapy in high-risk patients with breast carcinoma treated with high-dose chemotherapy and stem-cell rescue. Cancer. 2002;94:2821–2829. doi: 10.1002/cncr.10573. [DOI] [PubMed] [Google Scholar]
- 34.Hartsell WF, Scott CB, Dundas GS, et al. Can serum markers be used to predict acute and late toxicity in patients with lung cancer? Analysis of RTOG 91-03. Am J Clin Oncol. 2007;30:368–376. doi: 10.1097/01.coc.0000260950.44761.74. [DOI] [PubMed] [Google Scholar]
- 35.Boisserie G. [Contribution of registered and/or fused images to radiotherapy] Cancer Radiother. 2005;9:204–222. doi: 10.1016/j.canrad.2005.03.003. [DOI] [PubMed] [Google Scholar]
- 36.Vogel WV, van Dalen JA, Wiering B, et al. Evaluation of image registration in PET/CT of the liver and recommendations for optimized imaging. J Nucl Med. 2007;48:910–919. doi: 10.2967/jnumed.107.041517. [DOI] [PubMed] [Google Scholar]
- 37.Anscher MS, Kong FM, Andrews K, et al. Plasma transforming growth factor beta1 as a predictor of radiation pneumonitis. Int J Radiat Oncol Biol Phys. 1998;41:1029–1035. doi: 10.1016/s0360-3016(98)00154-0. [DOI] [PubMed] [Google Scholar]
- 38.Kong FM, Frey KA, Quint LE, et al. A pilot study of [18F]fluorodeoxyglucose positron emission tomography scans during and after radiation-based therapy in patients with non small-cell lung cancer. J Clin Oncol. 2007;25:3116–3123. doi: 10.1200/JCO.2006.10.3747. [DOI] [PubMed] [Google Scholar]


