

Abstract
Background and Purpose
Reducing the burden of stroke is a priority for the Veterans Affairs (VA) Health System, reflected by the creation of the VA Stroke Quality Enhancement Research Initiative (QUERI). To inform the initiative's strategic planning, we estimated the relative population-level impact and efficiency of distinct approaches to improving stroke care in the United States Veteran population to inform policy and practice.
Methods
A System Dynamics stroke model of the Veteran population was constructed to evaluate the relative impact of 15 intervention scenarios including both broad and targeted primary and secondary prevention and acute care/rehabilitation on cumulative (20-year) outcomes including quality-adjusted life years (QALYs) gained, strokes prevented, stroke fatalities prevented and the number-needed-to-treat (NNT) per QALY gained.
Results
At the population level, a broad hypertension control effort yielded the largest increase in QALYs (35,517), followed by targeted prevention addressing hypertension and anticoagulation among Veterans with prior cardiovascular disease (27,856) and hypertension control among diabetics (23,100). Adjusting QALYs gained by the number of Veterans needed to treat, thrombolytic therapy with tissue plasminogen activator was most efficient, needing 3.1 Veterans to be treated per QALY gained. This was followed by rehabilitation (3.9) and targeted prevention addressing hypertension and anticoagulation among those with prior cardiovascular disease (5.1). Probabilistic sensitivity analysis showed that the ranking of interventions was robust to uncertainty in input parameter values.
Conclusions
Prevention strategies tend to have larger population impacts, though interventions targeting specific high-risk groups tend to be more efficient in terms of NNT per QALY gained.
Keywords: strategic planning, comparative effectiveness, simulation model, special populations, Veterans
Introduction
Stroke, a major cause of mortality and disability, occurs in more than 610,000 people and accounts for $38.6 billion in direct and indirect medical costs annually in the United States.1 Opportunity for improvement in stroke prevention and stroke care is broadly acknowledged.1,2 Significant stroke burden and opportunity for improvement also exists in the Veterans Affairs (VA) health system. The VA Stroke Quality Enhancement Research Initiative (QUERI) was created to translate evidence into system-wide practice to reduce stroke risk, improve patient care, and to help Veterans reach the best possible outcomes post stroke.3
In order to prioritize their efforts, the Stroke QUERI executive committee recognized the need for quantitative impact estimates of investment alternatives in research and implementation to reduce stroke burden. Given the Stroke QUERI's extensive charge, including primary prevention, acute care and rehabilitation, secondary prevention, and the need to accommodate a wide range of stakeholder involvement, the executive committee sought a systematic, analytical approach to strategic planning.
In close collaboration with stroke experts and QUERI decision-makers, we built and analyzed a population-level System Dynamics stroke model for Veterans to estimate the relative impact of 15 intervention scenarios for supporting decision-making. Given the need to guide research and practice to improve stroke outcomes VA-wide, the project was intended to focus on classes of interventions of particular importance to VA leadership. Through literature review and engagement of a diverse team of stroke experts, we sought to ground simulated intervention scenarios in current practice in VA facilities, and plausible changes based on understanding the VA context. We examined the comparative impact of proposed intervention approaches on population-level health outcomes, as well as their relative efficiency. Additionally, we evaluated the robustness of results given potential data uncertainties.
Methods
Decision Model Overview
To better understand trade-offs between alternate stroke care improvement targets, we built a population-level System Dynamics (SD) stroke model for the United States VA enrollee population. Throughout the process of model development, we engaged with experts both within VA and more broadly to integrate their understanding of stroke and stroke care. Vensim DSS 5.114 was used for model construction, parameterization, calibration and evaluation. We initiated the model in 2010 with a population of 4.14 million VA users, defined as Veteran enrollees who utilized VA primary care service in the past 12 months. This subpopulation of enrollees, considered reachable by VA-based intervention, comprised 48% of all Veteran enrollees (based on 2007 data from Veterans Administration Desert Pacific Healthcare Network/VISN 22 databases). The model introduced a fraction of the VA enrollee non-user population each year, who become VA users following an incident transient ischemic attack (TIA) or stroke.
Accounting for heterogeneous stroke or TIA risk, the model stratified VA users into 11 mutually exclusive stocks (depicted as solid rectangles in Figure 1) representing individuals with similar natural history and response to treatment (e.g., history of recent diagnosed TIA). Veteran users without prior TIA or stroke were segmented by stroke risk factors: age (<45, 45-64, 65-75, >75), hypertension and systolic blood pressure (<140 mmHg, 140 mmHg-159 mmHg, >160 mmHg), atrial fibrillation (AF), diabetes mellitus type 2, smoking, and cardiovascular disease (CVD). The post-TIA population was disaggregated by diagnosis (diagnosed versus undiagnosed) and time since last TIA event; the post-stroke population was categorized by time since most recent stroke and functional independence via modified Rankin Scale (mRS).
Figure 1.
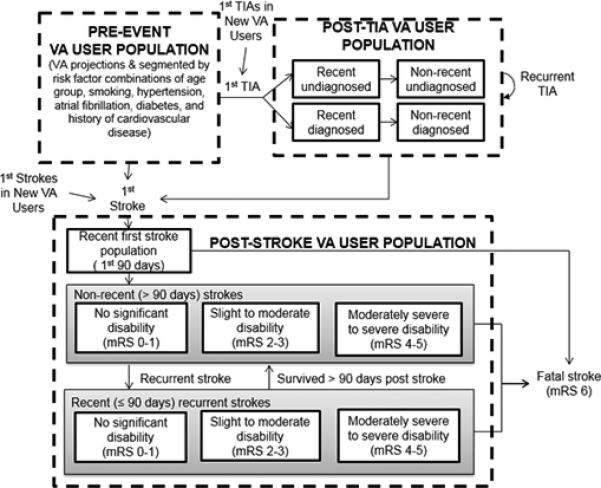
Depicted in the diagram are the stocks (solid rectangles) and flows (arrows), which capture the states and changes in health status of the Veteran enrollee population over time. The dashed rectangles show the descriptive segmentation of the Veteran population based on history of TIA or stroke. The flows in the model manipulate the transitions between stocks which shift individuals between states over time and ultimately affect modeled outcome variables. “VA users without prior TIA or stroke” are not tracked as a stock, but rather a flow into indicated stocks.
The SD model simulated the transitions between health states (stocks) via flows over time. Typical of SD models, movements among health states were governed by processes with multiple influences, nonlinearity, accumulation, delay, and feedback.5 Input parameters (omitted from Figure 1 for simplification) include time delays, constants, rates, and time series inputs. More information on model assumptions can be found at http://vastrokemodel.weebly.com.
Data Sources
The projections of VA user demographics were based on The Veteran Population Projection Model (VetPop)6 and Decision Support Services (DSS) Veteran enrollee data. Current levels of care in the VA were largely based on a study conducted by the Veterans Health Administration (VHA) Office of Quality and Performance (OQP) and Stroke QUERI during FY 2007.7 A Framingham-based risk calculator was used to determine relative stroke rates as the pre-event population changed with time either based on exogenous factors or through intervention.8 To achieve this, the pre-event population was stratified into 256 risk groups reflecting relevant combinations of key stroke risk factors; the prevalence of each risk factor and risk factor combination was based on VISN 22 data but cross-checked against national single-factor prevalence estimates.6,8,9 The risk calculator used was selected as the best match to available risk data and specific prevention interventions considered in the model. The distribution of post-stroke functional status was estimated based on VA Functional Status Outcomes Database (FSOD) data10-12, though estimates from the literature were used in sensitivity analysis.13 Age-specific non-stroke death rates were derived from the U.S. Census Life Tables. In the absence of data, literature review with VA source preference14-16 was conducted to inform assumptions. For example, while national sources were compared, the initial prevalence of TIA and stroke were estimated from a study on large administrative VA medical databases.14
Intervention Scenarios
We worked with Stroke QUERI decision makers and additional stakeholders to develop 15 distinct intervention scenarios representing the policy decision space; each improving current practice denoted as “current levels of care” (Figure 2). Scenarios were organized into 3 categories: primary prevention, secondary prevention, and acute care/rehabilitation. Each intervention scenario was defined based on evidence concerning specific interventions within the categories, current VA levels of care (what proportion of eligible individuals are receiving the intervention), projected level of care with plausible effort, and expected intervention effectiveness.
Figure 2.

15 stroke intervention scenarios are defined, with each including a target subpopulation, current and projected level of care and estimated effectiveness of the intervention.
Footnote:*Calibrated within the model; †Baseline (the comparator, “current level of care”); ‡ Workgroup consensus. SBP: Systolic Blood Pressure (measured in mmHg); DM: Diabetes Mellitus; HTN: Hypertension; AF: Atrial Fibrillation; TIA: Transient Ischemic Attack; ED: Emergency Department; tPA: Tissue plasminogen activator; TTR: Time in Therapeutic Range; RRR: Relative Risk Reduction; CEA: Carotid Endarterectomy; mRS: Modified Rankin Scale
Sensitivity Analysis, Model Calibration, and Uncertainty Analysis
Given the breadth of the model and gaps in VA data, it was important to conduct a rigorous sensitivity analysis to identify key uncertain parameters, model calibration to estimate these parameter values given additional data, and uncertainty analysis to assess robustness of findings given existing uncertainty. 29 To reduce the number of parameters that needed to be estimated, we applied the Morris method30 to identify the subset of parameters to which either model outputs or calibration criteria (i.e., the calculated difference between additional data points and their simulated equivalent) were most sensitive (i.e., contributed the most to variability in each). Next, those parameters to which calibration criteria were most sensitive were estimated (i.e., “calibrated”) using generalized likelihood uncertainty estimation.31 Calibration was performed to produce more than 400,000 replications of the model. We selected the 1,000 best- fitting parameter sets to serve as alternate baselines for uncertainty analysis. Finally, we conducted multivariate probabilistic sensitivity analysis to account for uncertainty in the 15 intervention scenarios’ effect sizes as well as in additional non-calibrated model inputs parameter values to which model outputs were sensitive. In total, 10,000 distinct model replications were simulated to represent uncertainty in model input parameter values.
Outcomes
Each intervention was simulated sequentially in each replication of the model, and results were calculated by taking the difference in cumulative quality-adjusted life years (QALYs), incident strokes, and stroke fatalities during a 20-year time period. While these results inform relative population-level impacts of each intervention, they do not capture differences in resources required to achieve these impacts. A clinically and operationally-relevant surrogate for actual resource utilization and efficiency, we calculated the number-needed-to-treat (NNT) to achieve a 1-unit change in QALY during a 20-year period. A discount rate of 3% was applied to all outcomes.
Because the simulated outcomes were highly skewed, we reported the median of each outcome across the 10,000 replications, with 95% uncertainty bounds for each intervention. Uncertainty bounds were derived from the cumulative distribution function of each output prediction, re-scaling based on the likelihood estimates of the 1,000 best-fitting baselines. In addition, we applied Mann-Whitney U test32 (two-tailed), a non-parametric test, to assess the statistical significance of differences in NNT per QALY gained across all possible pairs of intervention scenarios across replications. We tested a set of null hypotheses that there is no difference between each pair of intervention scenarios.
RESULTS
The Morris method30 reduced the complexity of the model calibration by identifying 36 parameters (out of 60) to which calibration criteria or model outputs were most sensitive. It is worth noting that the most influential parameter across all the outputs is the stroke rate per thousand in the pre-event VA user population per year. Further data collection and rigorous estimates of it could dramatically reduce uncertainty in projected stroke outcomes.
Table 1 presents simulated outputs across the 15 intervention scenarios in a descending order with respect to QALYs gained over 20 years. Improving hypertension control for all VA users from baseline (73%) to a plausibly achievable level (between 87% and 95%) yielded the largest benefits in 20-year QALYs gained, strokes prevented, and stroke fatalities prevented. Carotid endarterectomy (CEA) for individuals with prior stroke had the lowest improvement in QALYs. Because of the small number of eligible individuals relative to other interventions, thrombolytic therapy with tissue plasminogen activator (tPA) for acute stroke had a relatively small impact at the population level but was the most efficient strategy in terms of NNT per QALY gained (3.1). Increasing eligible strokes receiving rehabilitation service from baseline (30%) to 60% ranked second in terms of NNT per QALY gained (3.9). At current tPA administration levels, system-wide effort to increase the fraction of individuals arriving at the hospital within 60 minutes of stroke symptom onset was the least efficient strategy evaluated.
Table 1.
Median and 95% Uncertainty Bounds for key Stroke Outcomes for each Stroke Intervention Scenario Compared to “Current Level of Care” over 20 Years
| QALYs Gained | Strokes Prevented | Stroke Fatalities Prevented | NNT Per QALY Gained | |
|---|---|---|---|---|
| Hypertension control for all VA usersPP | 35,517 (27,302, 48,540) | 20,940 (15,637, 29,413) | 2,440 (1,547, 3,919) | 11.8 (9, 14.2) |
| Hypertension control and anticoagulation for those with prior CVDPP | 27,856 (19,493, 40,131) | 16,479 (11,290, 24,368) | 1,911 (1,123, 3,208) | 5.1 (3.6, 7) |
| Hypertension control for diabeticsPP | 23,100 (16,990, 32,481) | 13,688 (9,756, 19,805) | 1,585 (9,86, 2,609) | 9.2 (7.1, 11) |
| RehabilitationTR/R | 18,974 (12,845, 27,872) | 210 (−71, 664) | 73 (15, 164) | 3.9 (3, 4.8) |
| Management of recently diagnosed TIASP | 10,838 (6,391, 17,304) | 6,382 (4,043, 9,665) | 727 (405, 1,243) | 6.0 (4.5, 7.5) |
| Anticoagulation for all with AFPP | 9,568 (2,553, 18,205) | 5,643 (1,521, 11,096) | 642 (163, 1,422) | 8.1 (6.2, 9.7) |
| Comprehensive post-stroke managementSP | 6,315 (2,970, 10,985) | 10,283 (6,095, 15,879) | 1,340 (743, 2,246) | 17.0 (12.3, 26.4) |
| Dysphagia screeningTR/R | 2,574 (1,239, 4,994) | −119 (−207, −63) | 645 (344, 1,150) | 67.8 (45.1, 110.4) |
| Hypertension control for VA users with SBP>160PP | 2351 (1,762, 3,221) | 1,385 (997, 1,963) | 161 (100, 260) | 5.7 (3.7, 7.7) |
| DVT ProphylaxisTR/R | 2,001 (565, 4,690) | −94 (−193, −28) | 509 (151, 1,078) | 16.3 (10.8, 26.5) |
| Thrombolytic therapyTR/R | 1,180 (405, 2,213) | 0 (−11, 27) | 31 (10, 65) | 3.1 (1.1, 4.4) |
| CEA for post-TIASP | 748 (194, 1,434) | 449 (116, 801) | 51 (13, 106) | 9.4 (7.4, 11.4) |
| Timely to hospital within 60 minutes of symptoms onsetTR/R | 733 (342, 1,270) | 0 (−6, 16) | 19 (9, 37) | 122.3 (84.4, 158.3) |
| Accuracy/timeliness of TIA diagnosisSP | 723 (190, 2,555) | 440 (121, 1,545) | 51 (14, 207) | 9.0 (7.3, 11.3) |
| CEA for post strokeSP | 344 (87, 747) | 655 (170, 1,222) | 84 (22, 170) | 35.6 (28.2, 55.5) |
A 3% discount rate is used in all calculations.
PP: Primary Prevention; SP: Secondary Prevention; TR/R: Treatment/Rehabilitation; NNT: numbers-needed-to-treat; QALY: quality-adjusted life years; CVD: Cardiovascular Disease; TIA: Transient Ischemic Attack; AF: Atrial Fibrillation; SBP: Systolic Blood Pressure (measured in mmHg); DVT: Deep Vein Thrombosis; tPA: Tissue plasminogen activator; CEA: Carotid Endarterectomy
A box plot illustrating the expected NNT per QALY gained and estimated uncertainty, grouped by intervention category, is shown in Figure 3. Within each category, interventions are ordered from lowest NNT per QALY to highest. Though hypertension control for all VA users yields the greatest population-level benefit among primary prevention interventions, it is the least efficient in this category. More efficient were: targeted primary prevention focusing on specific high risk groups including VA users with severe hypertension, diabetes, prior CVD, or AF, as well as targeted hypertension and anticoagulation treatment for VA users with prior CVD and AF. Among secondary prevention interventions, the top 3 efficient interventions regarding NNT per QALY gained are management of recently diagnosed TIA (6.0), accurate and timely TIA diagnosis (9.0), and CEA post-TIA (9.4). Comparing intervention impacts across replications, the Mann-Whitney U test revealed that all pairs of these 15 interventions were statistically significantly different from each other in terms of NNT per QALY gained at a significance level of P< 0.001.
Figure 3.
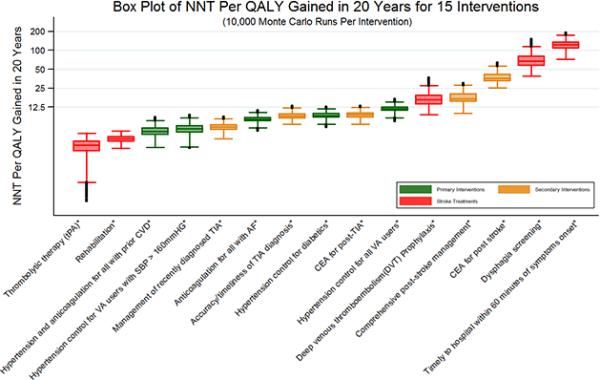
The median number-needed-to-treat (NNT) per quality-adjusted life year (QALY) gained across 10,000 replications of the model is indicated by the line inside each box. The box spans the first to third quartiles, and the whiskers include the maximum and minimum values of NNT per QALY gained, excluding outliers. Outliers are depicted by solid circles. The vertical axis is on a logarithmic scale.
Footnote:*P-value < 0.001 when Mann–Whitney U test is applied to examine whether NNT per QALY gained for each intervention is significantly different from each other intervention. NNT: numbers-needed-to-treat; QALY: quality-adjusted life year
DISCUSSION
In this paper, we describe a computer model of stroke incidence and outcomes in the VA population and present analyses offering the Stroke QUERI a systematic foundation for understanding the impact of implementing alternate strategies for stroke prevention and treatment under consideration. From this project, we learned that several interventions have both large cumulative benefits to the Veteran population and are also relatively efficient in terms of NNT per QALY gained, including targeting individuals with a history of CVD for treatment of hypertension and AF and rehabilitation after acute stroke. This finding is being used by the Stroke QUERI to focus research and implementation efforts.
This study also revealed that broad-based prevention, such as improving hypertension management for all Veterans, was powerful in terms of cumulative benefits to the population, though not always as efficient as other intervention approaches since larger numbers of individuals must be treated for each unit of benefit. For example, considering QALY gains in Table 1, targeted prevention focused on hypertension and anticoagulation for individuals with AF amongst the subset of VA users with prior CVD achieves 78% of the gains that improving hypertension control for all users achieves. Echoing the guidelines for primary prevention of stroke33, our study suggested that more efficient primary prevention should target high risk subgroups of veterans either with more severe condition (e.g. severe hypertension with SBP>160 mmHg) or with elevated risk in the presence of multiple stroke risk factors (e.g. prior history of CVD and hypertension).
A crucial feature of this exercise is that it was performed to address the VA decision context and results may differ in non-VA populations. For example, the efficacy of tPA will be dependent on local context, such as the proportion of people with stroke arriving soon after symptom onset and baseline rates of tPA use. Results also depend on the framing of key questions, for example if acute interventions were consolidated under a stroke unit.
This work is based on available data; as such, one limitation is that several of the model inputs are uncertain. However, guided by sensitivity analysis, we identified where uncertainty in inputs most affected outputs and focused our literature review, data analysis, and consultation with the Stroke QUERI advisory committee on those inputs. We addressed remaining uncertainties through rigorous probabilistic sensitivity analysis and demonstrated that the strategic conclusions presented here are robust to these uncertainties.
A second limitation is that costs are not included directly, due to the complexity of cost estimation in this broad model and the variability in costs across facilities; instead we used the surrogate of NNT as an indicator of efficiency. This allows general comparisons of similar interventions (e.g., lifetime medication and clinical management for prevention) but is less relevant in comparing across the three broad intervention categories. We found the NNT analysis a useful reference point for Stroke QUERI discussion of the relative cost, feasibility, and sustainability of specific interventions; NNT provided decision makers a way to visualize the number of people who would need to receive the intervention in order to achieve one QALY.
A third limitation is that the benefits of prevention are underestimated in this study. For instance, hypertension control not only reduces the risk of stroke, but also lowers the risk of myocardial infarction, heart failure and chronic kidney disease whose benefits are not explicitly included in our results given the focus on stroke. Accounting for this secondary effect would only reinforce the estimated cumulative benefits of prevention.
The SD Stroke model presented here serves as a tool for policy makers to focus research on crucial points of uncertainty in order to improve decision making.34 This framework has been used by the VA Stroke QUERI in discussions about how to move forward in strategic planning and goal development to improve the quality of stroke care in the VA system.35 In response to results of the model, the Stroke QUERI has expanded its allocation of research and implementation on prevention, including new efforts to improve secondary prevention among Veterans post TIA or stroke, and improved integration with other QUERIs addressing hypertension in high-risk individuals. The model has potential to be applied to other contexts, particularly other managed health systems; the structure of the model can be adapted, accounting for local data, resources, and constraints. Further, it provides an example of how modeling can be applied to address clinical and public health policy problems to promote positive action.
Acknowledgments
All authors supported project development and the framing of this manuscript. DBM and KHL secured funding for the project, JBH and KHL developed the simulation model with substantial input from all coauthors; CAB, JBH, YT, and KHL led data collection and analysis to inform model parameters; YT, KHL, and CAB conducted model analysis. DBM, YT, and KHL, and DBM led manuscript preparation, and all authors edited the final version.
Source of Funding
The research was supported by the Department of Veterans Affairs, Veterans Health Administration (VHA), Health Sevices Research and Development Service Quality Enhancement Research Initiative (RRP 07-295), award number KL2RR025746 from the National Center for Research Resources, award number K23NS058571 from the National Institutes of Health/National Institute of Neurological Disorders and Stroke, and the Singapore Ministry of Health's National Medical Research Council under its STaR Award Grant. The authors take sole responsibility for the scientific validity and accuracy of the methodology, results, statistical analyses, and conclusions presented.
Footnotes
Disclosures
None.
References
- 1.Go AS, Mozaffarian D, Roger VL, Benjamin EJ, Berry JD, Borden WB, et al. Heart disease and stroke statistics--2013 update: a report from the American Heart Association. Circulation. 2013;127:e6–e245. doi: 10.1161/CIR.0b013e31828124ad. [DOI] [PMC free article] [PubMed] [Google Scholar]
- 2.Schwamm LH, Pancioli A, Acker JE, 3rd, Goldstein LB, Zorowitz RD, Shephard TJ, et al. Recommendations for the establishment of stroke systems of care: recommendations from the American Stroke Association's Task Force on the Development of Stroke Systems. Stroke. 2005;36:690–703. doi: 10.1161/01.STR.0000158165.42884.4F. [DOI] [PubMed] [Google Scholar]
- 3. [September 1, 2013];Stroke QUERI Fact Sheet. Stroke QUERI web site. http://www.queri.research.va.gov/about/factsheets/stroke_factsheet.pdf.
- 4.Ventana Systems, Inc . Vensim DSS software: Version 5.11. Ventana Systems, Inc; Harvard, MA: 2012. [Google Scholar]
- 5.Homer JB, Hirsch GB. System dynamics modeling for public health: Background and opportunities. Am J Public Health. 2006;96:452–458. doi: 10.2105/AJPH.2005.062059. [DOI] [PMC free article] [PubMed] [Google Scholar]
- 6. [November 30, 2012];Veteran Population Projection Model 2011. Overview U. S. Department of Veterans Affairs web site. http://www.va.gov/VETDATA/docs/Demographics/New_Vetpop_Model/VetPop2011_ExSum_Final_123112.pdf.
- 7.Bravata D, Ordin D, Vogel W, Williams L. The Quality of VA Inpatient Ischemic Stroke Care, FY2007: Final National and Medical Center Results of the VHA Office of Quality and Performance (OQP) Special Study. Department of Veterans Affairs; Washington, DC: 2009. [Google Scholar]
- 8.D'Agostino RB, Wolf PA, Belanger AJ, Kannel WB. Stroke risk profile: Adjustment for antihypertensive medication: The Framingham study. Stroke. 1994;25:40–43. doi: 10.1161/01.str.25.1.40. [DOI] [PubMed] [Google Scholar]
- 9.Ekundayo OJ, Vassar SD, Williams LS, Bravata DM, Cheng EM. Using Administrative Databases to Calculate Framingham Scores Within a Large Health Care Organization. Stroke. 2011;42:1982–1987. doi: 10.1161/STROKEAHA.110.603340. [DOI] [PMC free article] [PubMed] [Google Scholar]
- 10.Reker DM, Reid K, Duncan PW, Marshall C, Cowper D, Stansbury J, et al. Development of an integrated stroke outcomes database within Veterans Health Administration. J Rehabil Res Dev. 2005;42:77–91. doi: 10.1682/jrrd.2003.11.0164. [DOI] [PubMed] [Google Scholar]
- 11.Kwon S, Hartzema AG, Duncan PW, Lai SM. Disability measures in stroke - Relationship among the Barthel Index, the Functional Independence Measure, and the Modified Rankin Scale. Stroke. 2004;35:918–923. doi: 10.1161/01.STR.0000119385.56094.32. [DOI] [PubMed] [Google Scholar]
- 12.Vogel WB, Rittman M, Bradshaw P, Nissen D, Anderson L, Bates B, et al. Outcomes from stroke rehabilitation in Veterans Affairs rehabilitation units: Detecting and correcting for selection bias. J Rehabil Res Dev. 2002;39:367–383. [PubMed] [Google Scholar]
- 13.Goldstein LB, Amarenco P, Zivin J, Messig M, Altafullah I, Callahan A, et al. Statin Treatment and Stroke Outcome in the Stroke Prevention by Aggressive Reduction in Cholesterol Levels (SPARCL) Trial. Stroke. 2009;40:3526–3531. doi: 10.1161/STROKEAHA.109.557330. [DOI] [PubMed] [Google Scholar]
- 14.Cornell J, Pugh J, Williams J, Kazis L, Lee AFS, Parchman ML, et al. Multimorbidity clusters:Clustering binary data from multimorbidity clusters: Clustering binary data from a large administrative medical database. Applied Multivariate Research. 12:163–182. [Google Scholar]
- 15.Shen YJ, Findley PA, Maney M, Pogach L, Crystal S, Rajan M, et al. Department of Veterans Affairs-Medicare dual beneficiaries with stroke: Where do they get care? J Rehabil Res Dev. 2008;45:43–51. doi: 10.1682/jrrd.2006.07.0081. [DOI] [PubMed] [Google Scholar]
- 16.Chumbler NR, Jia HG, Phipps MS, Li X, Ordin D, Vogel WB, et al. Does Inpatient Quality of Care Differ by Age Among US Veterans with Ischemic Stroke? J Stroke Cerebrovasc Dis. 2012;21:844–851. doi: 10.1016/j.jstrokecerebrovasdis.2011.04.019. [DOI] [PubMed] [Google Scholar]
- 17.Chobanian AV, Bakris GL, Black HR, Cushman WC, Green LA, Izzo JL, Jr., et al. The Seventh Report of the Joint National Committee on Prevention, Detection, Evaluation, and Treatment of High Blood Pressure: the JNC 7 report. JAMA. 2003;289:2560–2572. doi: 10.1001/jama.289.19.2560. [DOI] [PubMed] [Google Scholar]
- 18.Go AS, Hylek EM, Chang Y, Phillips KA, Henault LE, Capra AM, et al. Anticoagulation therapy for stroke prevention in atrial fibrillation: how well do randomized trials translate into clinical practice? JAMA. 2003;290:2685–2692. doi: 10.1001/jama.290.20.2685. [DOI] [PubMed] [Google Scholar]
- 19.Gage BF, Waterman AD, Shannon W, Boechler M, Rich MW, Radford MJ. Validation of clinical classification schemes for predicting stroke: results from the National Registry of Atrial Fibrillation. JAMA. 2001;285:2864–2870. doi: 10.1001/jama.285.22.2864. [DOI] [PubMed] [Google Scholar]
- 20.Rothwell PM, Giles MF, Chandratheva A, Marquardt L, Geraghty O, Redgrave JN, et al. Effect of urgent treatment of transient ischaemic attack and minor stroke on early recurrent stroke (EXPRESS study): a prospective population-based sequential comparison. Lancet. 2007;370:1432–1442. doi: 10.1016/S0140-6736(07)61448-2. [DOI] [PubMed] [Google Scholar]
- 21.Rothwell PM, Eliasziw M, Gutnikov SA, Fox AJ, Taylor DW, Mayberg MR, et al. Analysis of pooled data from the randomised controlled trials of endarterectomy for symptomatic carotid stenosis. Lancet. 2003;361:107–116. doi: 10.1016/s0140-6736(03)12228-3. [DOI] [PubMed] [Google Scholar]
- 22.Chandratheva A, Lasserson DS, Geraghty OC, Rothwell PM, Oxford Vascular Study Population-based study of behavior immediately after transient ischemic attack and minor stroke in 1000 consecutive patients: lessons for public education. Stroke. 2010;41:1108–1114. doi: 10.1161/STROKEAHA.109.576611. [DOI] [PubMed] [Google Scholar]
- 23.Howard VJ, Lackland DT, Lichtman JH, McClure LA, Howard G, Wagner L, et al. Care seeking after stroke symptoms. Ann Neurol. 2008;63:466–472. doi: 10.1002/ana.21357. [DOI] [PMC free article] [PubMed] [Google Scholar]
- 24.Adams HP, Jr., del Zoppo G, Alberts MJ, Bhatt DL, Brass L, Furlan A, et al. Guidelines for the early management of adults with ischemic stroke. Stroke. 2007;38:1655–1711. doi: 10.1161/STROKEAHA.107.181486. [DOI] [PubMed] [Google Scholar]
- 25.Arling G, Reeves M, Ross J, Williams LS, Keyhani S, Chumbler N, et al. Estimating and reporting on the quality of inpatient stroke care by Veterans Health Administration Medical Centers. Circ Cardiovasc Qual Outcomes. 2012;5:44–51. doi: 10.1161/CIRCOUTCOMES.111.961474. [DOI] [PMC free article] [PubMed] [Google Scholar]
- 26.Kamphuisen PW, Agnelli G, Sebastianelli M. Prevention of venous thromboembolism after acute ischemic stroke. J Thromb Haemost. 2005;3:1187–1194. doi: 10.1111/j.1538-7836.2005.01443.x. [DOI] [PubMed] [Google Scholar]
- 27.Singh S, Hamdy S. Dysphagia in stroke patients. Postgrad Med J. 2006;82:383–391. doi: 10.1136/pgmj.2005.043281. [DOI] [PMC free article] [PubMed] [Google Scholar]
- 28.Langhorne P, Duncan P. Does the organization of postacute stroke care really matter? Stroke. 2001;32:268–274. doi: 10.1161/01.str.32.1.268. [DOI] [PubMed] [Google Scholar]
- 29.Briggs AH, Weinstein MC, Fenwick EAL, Karnon J, Sculpher MJ, Paltiel AD. Model parameter estimation and uncertainty analysis: a report of the ISPOR-SMDM Modeling Good Research Practices Task Force Working Group–6. Med Decis Making. 2012;32:722–732. doi: 10.1177/0272989X12458348. [DOI] [PubMed] [Google Scholar]
- 30.Morris MD. Factorial Sampling Plans for Preliminary Computational Experiments. Technometrics. 1991;33:161–174. [Google Scholar]
- 31.Beven K, Binley A. The Future of Distributed Models - Model Calibration and Uncertainty Prediction. Hydrol. Process. 1992;6:279–298. [Google Scholar]
- 32.Wackerly DD, Mendenhall W, Scheaffer RL. Mathematical Statistics with Applications. 7th Ed. Duxbury Press; Boston, MA: 2007. pp. 758–764. [Google Scholar]
- 33.Goldstein LB, Bushnell CD, Adams RJ, Appel LJ, Braun LT, Chaturvedi S, et al. Guidelines for the Primary Prevention of Stroke: A Guideline for Healthcare Professionals From the American Heart Association/American Stroke Association. Stroke. 2011;42:517–84. doi: 10.1161/STR.0b013e3181fcb238. [DOI] [PubMed] [Google Scholar]
- 34.Matchar DB, Samsa GP. Linking health policy modeling with health policy formation and implementation. In: Chapman GB, Sonnenberg FA, editors. Decision making in health care: Theory, psychology, and applications. 1st Ed. Cambridge University Press; Cambridge, UK: 2003. pp. 145–157. [Google Scholar]
- 35.Stroke QUERI strategic plan and goal development [November 30, 2012];Stroke Quality Enhancement Research Initiative web site. http://www.hsrd.research.va.gov/for_researchers/cyber_seminars/archives/qir-101210.pdf.