

Abstract
This contribution describes a continuous process for the production of solid lipid nanoparticles (SLN) as drug-carrier systems via hot-melt extrusion (HME). Presently, HME technology has not been used for the manufacturing of SLN. Generally, SLN are prepared as a batch process, which is time consuming and may result in variability of end-product quality attributes. In this study, using Quality by Design (QbD) principles, we were able to achieve continuous production of SLN by combining two processes: HME technology for melt-emulsification and high-pressure homogenization (HPH) for size reduction. Fenofibrate (FBT), a poorly water-soluble model drug, was incorporated into SLN using HME-HPH methods. The developed novel platform demonstrated better process control and size reduction compared to the conventional process of hot homogenization (batch process). Varying the process parameters enabled the production of SLN below 200 nm. The dissolution profile of the FBT SLN prepared by the novel HME-HPH method was faster than that of the crude FBT and a micronized marketed FBT formulation. At the end of a 5-h in vitro dissolution study, a SLN formulation released 92–93% of drug, whereas drug release was approximately 65 and 45% for the marketed micronized formulation and crude drug, respectively. Also, pharmacokinetic study results demonstrated a statistical increase in Cmax, Tmax, and AUC0–24 h in the rate of drug absorption from SLN formulations as compared to the crude drug and marketed micronized formulation. In summary, the present study demonstrated the potential use of hot-melt extrusion technology for continuous and large-scale production of SLN.
Electronic supplementary material
The online version of this article (doi:10.1208/s12248-014-9674-8) contains supplementary material, which is available to authorized users.
KEY WORDS: fenofibrate, high-pressure homogenizer, hot-melt extrusion, solid lipid nanoparticles
INTRODUCTION
Quality by Design (QbD) is a holistic, systematic, risk-based proactive approach aimed at final product quality. This approach begins with predefined objectives to ensure predictable product quality. The main purpose of QbD is to identify and control critical parameters which affect product quality [1–3]. QbD has been promoted by the United States Food and Drug Administration (US FDA) as a way to enhance pharmaceutical development through design efforts from product conceptualization to commercialization [4, 5]. Formulation of drugs, which are poorly water soluble, is the most challenging problem with respect to their biopharmaceutic quality, because slow and erratic dissolution prevents these compounds from being rapidly and completely absorbed from the gastrointestinal tract [6]. Several nanosized formulations were developed recently to overcome these problems [7]. In these nanosized formulations, solid lipid nanoparticles (SLN) are one of the potential drug-delivery systems and have been reported for controlled drug delivery, bioavailability enhancement by modification of dissolution rate and/or by improving tissue distribution, and targeting of drugs by using various application routes. SLN are mainly formulated by non-solvent or solvent-based techniques. The solvent-based technique utilizes organic solvents to dissolve the solid lipid; the solvent is then evaporated from the emulsion to obtain SLN. In the non-solvent technique, the solid lipid is liquefied over its melting point and is subsequently converted to nanoemulsions through common techniques such as high-pressure homogenization, in which cooling further results in SLN [8].
For more than two decades, fibrates played an important role in the treatment of hyperlipidemia. Fenofibrate (FBT) is one of the most commonly used fibrate worldwide. FBT is a pro-drug of fenofibric acid, approved to treat hypertriglyceridemia because it reduces low-density lipoprotein (LDL), and very-low-density lipoprotein (VLDL) while increasing the level of high-density lipoprotein (HDL) [9, 10]. It belongs to BCS II, which means that it is lipophilic with a logP value of 5.6 [9, 11] and practically insoluble in water [12]. The major drawback of FBT is its low bioavailability when taken under fasting conditions. Thus, there is a need to develop a new formulation/process in order to increase the FBT dissolution rate and improve its oral bioavailability.
High-pressure homogenization (HPH) has emerged as a reliable and powerful technique for the preparation of SLN [13]. Hot and cold homogenizations have been explored for the feasibility in scaling-up. However, these methods for SLN preparation needs a preparatory step that involves drug incorporation into the bulk lipid which in-turn involves multistep processes such as the melting of lipid, dispersion, or dissolution of drugs in melted lipid, preparation of aqueous dispersions, and, finally, size reduction, which makes this as a batch process. The pharmaceutical industry prefers a continuous process over a batch process as the continuous process is economical, it decreases the cost of production by less need of space, labor, and resources, as well as provides high efficacy and more desired product quality. On the other hand, batch processes require careful and complex procedures and controls to prevent variations in the final product. During the manufacturing of SLN, emulsion preparation is often an essential step. Emulsion preparation is a batch process, while size reduction by high-pressure homogenization is a continuous process. Thus, the development of a continuous emulsion preparation process is an essential aspect to allow a fully continuous SLN production line. Therefore, new approaches are essential to both increase the quality of the product and to reduce the production time.
Hot-melt extrusion (HME) is an innovative technology for the production of a variety of dosage forms. HME technology may offer several advantages over conventional pharmaceutical manufacturing processes. Shorter and more efficient times to the final product, environmental advantages due to elimination of solvents in processing, and increased efficiency of drug delivery to the patient make HME an exciting challenge for the pharma scientists and executives. Thus, HME has emerged as an alternative “platform technology” to other traditional techniques for pharmaceutical dosage forms, such as tablets, capsules, films, and implants for drug delivery via oral, transdermal, and transmucosal routes. HME technology is a potential continuous process of pumping raw materials at high temperatures and pressures resulting in a product of uniform shape and density [14–17]. To date, several research articles have been published describing the use of HME as a novel technique of choice to deal with day-to-day formulation challenges of new active pharmaceutical ingredients (API). To the best of our knowledge, HME has not been reported in the literature for the manufacturing of SLN, and this study utilizes HME technology for the manufacturing of drug-loaded SLN. The purpose of this current work was to develop a continuous process for SLN production using hot-melt extrusion for preparing a pre-emulsion and high-pressure homogenization for further size reduction using the poorly water-soluble drug FBT as a model drug. In the present work, we will propose an improved method, i.e., HME-HPH method for the continuous production of FBT SLN, using Quality by Design (QbD) principles and a design of experiment (DOE) approach. We have used a Plackett-Burman design in our present study to prepare FBT SLN.
MATERIALS AND METHODS
Materials
Fenofibrate was purchased from Ria International (East Hanover, NJ, USA). Dynasan® 114 (trimyristin) and Imwitor® 900K (Glyceryl stearate) were offered from Sasol Germany GmbH (Witten, Germany). Stearic acid, Compritol® 888 ATO (Glyceryl dibehenate EP), and Precirol® ATO 5 (Glycerol distearate (type I) EP) were kind gifts from Gattefosse (USA). Cremophor EL and Tween 80 were purchased from Sigma-Aldrich (St. Louis, MO, USA). Lofibra® (200 mg micronized FBT capsule) was a commercial product produced by Global Pharmaceuticals (Chalfont, PA, USA). HPLC-grade acetonitrile was obtained from Fisher Scientific (USA). DI water was used throughout the study. All other chemicals were of analytical grade.
Experimental Set Up
A schematic illustration of SLN formation by HME-HPH system is shown in Fig. 1. Briefly, it consists of two parts, a hot-melt extruder and a high-pressure homogenizer. An extruder typically consists of a motor, which acts as a drive unit, a feeding hopper, an extrusion barrel, a rotating screw, and an extrusion die. An electronic control unit is connected to the extruder which controls the screw speed, temperature, pressure, and feed rate. Generally, one or two rotating screws are used inside a stationary cylindrical barrel. Here, we are using two rotating screws inside the stationary cylindrical barrel. For this study, we are using two different types of screw configuration, i.e., standard configuration and modified configuration (Fig. 2). An extruder barrel consists of 8 zones. The first zone is used for the drug-lipid physical mixture feeding, and either zone 3 or zone 4 was used for the addition of surfactant aqueous solution. The first part that is the extruder is connected to the second part high-pressure homogenizer via a connector which is insulated to prevent the loss of heat.
Fig. 1.
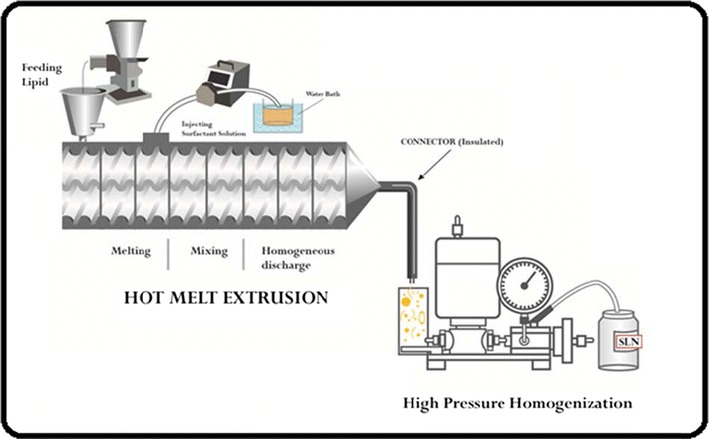
Schematic representation of continuous preparation of SLN using hot-melt extrusion connected to high-pressure homogenizer [8]
Fig. 2.

Screw configuration and mixing zones used in the preparation of SLN by HME [8]
Preparation of Fenofibrate SLN
Solubility Studies
Solubility studies were performed to identify suitable lipids for the development of the FBT SLN. The lipid used in the system should have high solubilization capacity for the drug, ensuring the solubilization of the drug in the resultant dispersion. The screening of lipids was performed by evaluating the solubility of FBT (10–25% w/w with respect to lipid mass) in different lipids such as stearic acid, Compritol® 888 ATO, Precirol® ATO 5, Dynasan 114, and Imwitor® 900K. A measured 10–25 mg of FBT was added into each vial containing 100 mg of selected excipient. Then, the mixture was heated at 90°C in a water bath to facilitate the solubilization, and the melting of drug and lipid were physically observed to confirm the presence or absence of insoluble drug crystals.
Preliminary Study
Preliminary study was conducted to identify process variables to be used for the preparation of FBT SLN. In the preliminary study, formulation variables for SLN such as drug concentration, lipid concentration, surfactant concentration, different lipid, and different surfactant were optimized to obtain SLN with a particle size below 200 nm with a maximum entrapment efficiency. Further, process variables such as screw configuration, barrel temperature, zone of liquid addition, and screw speed were optimized. Ishikawa diagram (also known as fish-bone diagrams or cause-and-effect diagrams) was constructed to identify the potential risks, and corresponding causes were created to identify quality attributes for the better performance of developed FBT SLN by HME-HPH technique (see supplementary data Fig. 1). Particle size, polydispersibility index, zeta potential, and entrapment efficiency were found to be critical quality attributes of the FBT SLN. Factors responsible for these quality attributes were identified as critical process parameters. Plackett-Burman screening experimental design was commonly used to identify these CPP that influence product critical quality attributes.
Formulation of FBT SLN
SLN were prepared by mixing a lipid and aqueous phase containing surfactant inside the extruder barrel at temperatures 10–15°C above the melting point of the lipid which results in the formation of an emulsion. The selected lipids (Compritol® 888 ATO/Precirol® ATO 5) and FBT geometric mixture were fed into the co-rotating twin-screw extruder (11 mm Process 11, Thermo-Fisher Scientific Karlsruhe, Germany) using a volumetric feeder. Different concentrations of a surfactant Cremophor EL (Sigma-Aldrich, USA)/Pluronic® F-68 (BASF, USA) aqueous solution, equivalent to the extrusion temperature, was injected into the extruder barrel either zone 3 or zone 4 through an injection port using a peristaltic pump. The barrel temperature for zone 2 was either 150 or 120°C; zone 3 and the rest of the zones including the die temperature were kept at 90°C. Screw speed for all of the formulations was either 160 or 240 rpm. The hot pre-emulsion that resulted from hot-melt extrusion was passed through an insulated tube connecting to the HME die and sample holder of the high-pressure homogenizer (Avestin Emulsiflex C5, Canada) for size reduction. The HPH was performed at 85°C and 1000 bar pressure with two repeated cycles to reduce the particle size of pre-emulsion resulting from melt extrusion. The HPH parameters were constant for all of the batches. Further, the size-reduced emulsion was cooled at room temperature to obtain SLN. The melt extrusion was performed by varying the formulation parameters such as drug concentration (DC), surfactant concentration (SC), lipid concentration (LC), surfactant (ST), and lipid (LT) and by varying process parameters such as screw speed (SS), barrel temperature (BT), and zone of liquid addition (ZA).
Design of Experiment
A set of Plackett-Burman (PB) screening design was adopted to study the effect of critical process parameters on FBT SLN performance and characteristics. PB design is one of the most commonly used designs of the experiment. They are the resolution three designs, so they can be used when only main effects are of interest to be investigated. PB designs involve a large number of variables and relatively fewer runs. A total of 12 experimental trials with a PB design were constructed using design expert stat-ease software version 9. Multilinear regression analysis and one-way ANOVA were performed to test the significance of the model and the factor coefficients. The experimental runs (formulations) were prepared in triplicate. The dependent variables were average particle size (Y1), polydispersibility index (Y2), zeta potential (Y3), and entrapment efficiency (Y4). The linear equation of the model is as follows:
| 1 |
where Y is the response, b0 is the constant, and b1, b2,…, bn is the coefficient of factor X1, X2,…, Xn (representing the effect of each factor ordered within −1, +1).
HPLC Analysis of Fenofibrate In Vitro
A Waters HPLC-UV system (Waters Corp, Milford, MA, USA) and UV detector were set at a wavelength of 286 nm. The separation of fenofibrate was performed on a Symmetry Shield RP 18 (5 μm) 4.6 × 250 mm column at 35°C, eluted with acetonitrile and phosphoric acid in water (pH = 2.8) at a ratio of 85:15 (v/v). The mobile phase flow rate was maintained at 1.0 ml/min. Fenofibrate retention time was 7 min under these conditions. Injection volume was 20 μl. All of the HPLC data was analyzed using Empower V. software (Milford, MA, USA). The calibration curve was linear with a correlation coefficient of 0.9998 over the range of 0.5–50 μg/ml. The within-day and between-day coefficients of variations did not exceed 3%. The limit of detection (LOD) value for fenofibrate was 15 ng/ml, and the limit of quantitation (LOQ) value was 50 ng/ml, respectively. The accuracy of the method was verified with recovery values of 98–102%.
CHARACTERIZATION OF FBT SLN
Micromeritics Measurement
The mean particle size and polydispersity index (PDI) of the developed SLN were determined by using Zetasizer Nano ZS (Malvern, USA). Dynamic light scattering technique was used to measure particle size. This technique measures the diffusion of particles moving under Brownian motion and converts this to size and a size distribution using the Stokes-Einstein relationship. The mean value of three repeated measurements for each sample was reported as the final measurement. SLN sample was diluted with sufficient water, a diluted sample was directly placed into a cuvette, and mean particle size and polydispersibility index were measured [18–20]. Zeta potential measurement was carried out with the same instrument Zetasizer Nano ZS. All results are an average of three measurements, which are calculated based on an average of 10 runs. Zeta potential is defined as a measure of degree of repulsion between charged particles. These repulsive forces prevent the particle aggregation and are therefore an indicator of physical stability of the formulation. According to the literature, dispersion with the zeta potential of more than ±20 mV is physically stable [21]. The parameters for Zetasizer were set as scattering angle 173°, refractive index 1.33, viscosity 0.89 cP, and temperature 25°C.
Encapsulation Efficiency Measurement
For the determination of the percentage entrapment efficiency, the SLN were first separated from the aqueous suspension medium by ultrafiltration-centrifugation using centrifugal filters (Amicon Ultra—0.5 with a 50-kDa cut-off, Millipore, USA) at 12,000 RPM for 20 min at room temperature. The percent entrapment efficiency was determined in triplicate indirectly by determining the amount of free FBT in the aqueous phase of the dispersion. The analysis of FBT was performed and amount of free FBT in aqueous phase was measured by validated HPLC method at a wavelength of 288 nm. The separation of FBT was performed on a 250 × 4.6 mm BDS hypersil C18 column at 40°C, eluted with water and acetonitrile (25:75; pH adjusted to 2.6 with o-phosphoric acid) at a flow rate of 1.0 ml/min. The FBT entrapment efficiency (EE) of SLN was calculated from the amount of drug determined by the HPLC analysis using the following equations:
Quantification of Drug Release In Vitro
Dissolution tests for the crude FBT and the marketed micronized FBT formulation (200 mg) were performed with a dissolution apparatus using the paddle method. The accurately weighed amount of crude FBT (200 mg filled in gelatin capsules) and marketed FBT formulation were placed in a 900-ml phosphate buffer with a pH of 7.4 containing 0.3% sodium lauryl sulfate (SDS) at 37°C and 75 rpm. An aliquot of 1.5 ml of release media was withdrawn at intervals of 5, 10, 15, 30, 45, 60, 90, 120, 180, 240, and 300 min, and then replaced by 1.5 ml of fresh dissolution fluid. Each sample was passed through a 0.45-μm syringe filter and determined by HPLC (see “HPLC Analysis of Fenofibrate In Vitro”). The drug release from SLN formulations was performed by using the dialysis bag technique. This is the most exclusively used method reported in the literature to estimate drug release from the SLN. We are using dialysis bag method as previously used for studying drug-release kinetics of nanoparticulate systems by Luo et al. [22] with some modifications. Phosphate buffer with a pH of 7.4 containing 0.3% SDS was used as the release medium. The dialysis bag retains nanoparticles and allows the free drug into the dissolution media with a cut-off of 10–14 kDa. The bags were soaked in double-distilled water for 12 h before use. Two milliliters of SLN dispersion was poured into the bag with the two ends fixed by clamps and immersed in 50 ml of preheated release medium in conical flask. The conical flasks were placed into a reciprocal shaking water bath manufactured by Precision (Cat. No. 51221080) at 37°C at a rate and 150 rpm. At fixed time intervals (same time points which used for the dissolution of crude FBT and marketed formulation), the medium in the conical flask was removed and filtered for analysis, and fresh dissolution medium was then added to maintain a sink condition. The amount of drug in the filtrate was analyzed by HPLC method as described above. Measurements for all three crude FBT, marketed formulation, and SLN formulation were performed in triplicate and averages are reported here.
Comparison Between the SLN Prepared by Conventional Method and Novel HME-HPH Method
From PB design, three optimized formulations PB 7, PB 8, and PB 9 were selected and prepared by a conventional method as described earlier by Wang et al. [23]. Briefly, in conventional method, lipid and drug were heated up to a temperature of 10–15°C above the melting point of lipid and drug. Surfactants were dissolved in a beaker with water, and then added into melted drug and lipid drop by drop over 70–80°C of water bath. The obtained pre-emulsion was passed through a high-pressure homogenizer. These three formulations were compared for characteristics such as particle size (PS), PDI and zeta potential (ZP) when prepared by conventional and by novel HME-HPH techniques.
In Vivo Pharmacokinetic Study
All animal care and experimental studies were approved by the Institutional Animal Care and Use Committee (IACUC) with protocol no. 14-013. Jugular vein-cannulated male Wistar rats (body weight 250 ± 10 g, Harlan laboratories, IN, USA) were housed in cages for a minimum of at least 3 days prior to beginning of the study and had free access to food and water. Rats were randomly divided into three groups of six animals each. The rats were fasted for 12 h prior to the experiments, and after 2 h of dosing of formulations, they were given access to food. The oral dose of FBT was 12.5 mg/animal; thus, 0.5 ml of formulation was administered to each rat. The crude FBT drug was suspended in 0.1% SLS aqueous solution, and the commercial micronized FBT formulation was diluted 1:10 with saline prior to administration by gavage. The SLN formulation was administered undiluted. Serial blood samples (200 μl) were taken from the cannulated jugular vein, pre-dose and at time points of 0.5, 1, 2, 4, 6, 8, 10, and 24 h post-dosing. The whole blood was collected into heparin-coated tubes and centrifuged at 4°C at 12,000 rpm for 5 min to obtain plasma. The plasma samples were kept frozen at −80°C until analysis.
Plasma Processing and HPLC Analysis
Fenofibric acid was determined by an HPLC-UV method as described above. The sample preparation of the plasma samples was based on the procedure described by Hanafy et al. [6] with a little modification. An aliquot of 100 μl plasma and 400 μl methanol was transferred to Eppendorf tubes and vortexed for 1 min, followed by centrifugation at 12,000 rpm for 10 min at 4°C. An aliquot of 20 μl supernatant was injected into the HPLC system and the fenofibric acid was detected. The standard calibration curve was prepared in plasma similarly as described above. The standard curve was obtained, with a correlation coefficient of 0.9998 over the concentration range from 0.11 to 123.68 μg/ml. The recovery by the described procedure was more than 92% in the investigated concentration range.
Data and Statistical Analysis
The pharmacokinetic parameters were calculated based on a non-compartmental model. The area under the concentration time curve from time zero to time t (AUC0–t) was calculated using trapezoidal method. Peak concentration (Cmax) and time of peak concentration (Tmax) were obtained directly from the concentration time profiles. Differences between batches were analyzed by one-way analysis of variance (ANOVA) followed by Tukey test. A P < 0.05 was considered statistically significant. All values were reported as mean of four findings.
Stability Study
The stability of the developed SLN formulation was conducted for 6 months as per International Conference on Harmonization (ICH) Q1A (R2) guidelines [24]. The optimized formulation (PB 9 design) was selected for the stability study. Briefly, samples were stored in the sealed amber-colored glass vials at 4°C and at 25°C. After 1, 3, and 6 months, the samples were characterized with respect to particle size, ZP, PDI, and EE.
RESULTS AND DISCUSSION
Solubility of FBT in Lipids
The assessment of solubility of drug in the lipid material is the first step in the selection of lipids for the formulation of SLN dispersions as solubility of the drug in the lipid is one of the most important factors for determining entrapment efficiency (EE) of the SLN. Four lipids with different physicochemical properties were selected, and results from the solubility studies are shown in supplementary data Table 1. Among five lipids, FBT was not completely soluble in stearic acid, Dynasan® 116 and Imwitor® 900K, whereas no drug crystals were observed when FBT was heated together with Precirol® ATO 5 for all three concentrations tested (10–20 mg). Also, when FBT was heated with Compritol® ATO 888, no drug crystals were observed for all four concentrations tested (10–25 mg). This study indicated that EE of FBT in Compritol® ATO 888 and Precirol® ATO 5 might be more than stearic acid,Dynasan® 116 and Imwitor® 900K. Thus, Compritol® ATO 888 and Precirol® ATO 5 were selected for the preparation of SLN.
Formulation of FBT SLN
From the preliminary studies, formulation parameters such as DC, SC, LC, ST, and LT were found to have significant effects on characteristics of the SLN. Also, process parameters such as screw configuration, BT, ZA, and SS were found to have substantial effects. A modified screw configuration was selected to prepare all SLN formulations. To study the effect of formulation and process parameters, PB design approach was used. Experimental factors and their levels are given in Table I and the experimental design is shown in Table II.
Table I.
Experimental Factors and Their Levels
| Factor | Factor significance | Unit | Level (−1) | Level (+1) |
|---|---|---|---|---|
| X1 | Drug concentration | % w/w | 0.5 | 1 |
| X2 | Lipid concentration | % w/w | 6 | 8 |
| X3 | Surfactant concentration | % w/w | 1.5 | 3 |
| X4 | Surfactant | – | Cremophor EL | Tween 80 |
| X5 | Screw speed | RPM | 160 | 240 |
| X6 | Barrel temperature | °C | 120 | 150 |
| X7 | Zone of liquid addition | – | 3 | 4 |
| X8 | Lipid | – | Compritol® ATO 888 | Precirol® ATO 5 |
Table II.
Experimental Design
| PB | X1 | X2 | X3 | X4 | X5 | X6 | X7 | X8 |
|---|---|---|---|---|---|---|---|---|
| 1 | 1 | 6 | 3 | Tween 80 | 160 | 150 | 4 | Precirol |
| 2 | 0.5 | 6 | 1.5 | Tween 80 | 160 | 150 | 4 | Compritol |
| 3 | 1 | 8 | 3 | Cremophor EL | 160 | 120 | 4 | Compritol |
| 4 | 0.5 | 8 | 3 | Tween 80 | 160 | 120 | 3 | Precirol |
| 5 | 1 | 6 | 3 | Tween 80 | 240 | 120 | 3 | Compritol |
| 6 | 0.5 | 8 | 1.5 | Tween 80 | 240 | 120 | 4 | Precirol |
| 7 | 0.5 | 6 | 1.5 | Cremophor EL | 160 | 120 | 3 | Compritol |
| 8 | 0.5 | 6 | 3 | Cremophor EL | 240 | 150 | 3 | Precirol |
| 9 | 0.5 | 8 | 3 | Cremophor EL | 240 | 150 | 4 | Compritol |
| 10 | 1 | 8 | 1.5 | Cremophor EL | 160 | 150 | 3 | Precirol |
| 11 | 1 | 6 | 1.5 | Cremophor EL | 240 | 120 | 4 | Precirol |
| 12 | 1 | 8 | 1.5 | Tween 80 | 240 | 150 | 3 | Compritol |
PB Plackett-Burman
Experimental Design
PB designs are screening designs that involve a large number of factors, which result in relatively fewer experiments. A total of 12 experimental trials involving eight variables were performed, and as shown in Table III, the selected response variables exhibited a wide variation suggesting that the independent variables had a significant effect on the response parameters chosen. Observed and predicted values for all four responses are shown in supplementary data Table 2.
| 2 |
| 3 |
| 4 |
| 5 |
Table III.
Statistical Analysis of Particle Size (Y1), Polydispersibility Index (Y2), Zeta Potential (Y3), and Entrapment Efficiency (Y4) Results
| Parameters | Particle size (Y1) | Polydispersibility index (Y2) | Zeta potential (Y3) | Entrapment efficiency (Y4) | ||||
|---|---|---|---|---|---|---|---|---|
| Coefficient | P value | Coefficient | P value | Coefficient | P value | Coefficient | P value | |
| Constant b 0 | 355 | 0.007 | 0.46 | 0.042 | 31.25 | 0.047 | 61.0 | 0.0002 |
| DC (A) | 43.3 | 0.056 | −0.01 | 0.829 | 0.02 | 0.981 | 0.30 | 0.230 |
| LC (B) | 48.3 | 0.039 | 0.08 | 0.019 | −2.35 | 0.045 | 3.67 | 0.0003 |
| SC (C) | −58.8 | 0.020 | −0.07 | 0.032 | 3.33 | 0.018 | −0.08 | 0.705 |
| ST (D) | 48.1 | 0.040 | 0.06 | 0.056 | −0.70 | 0.396 | −7.64 | ˂0.0001 |
| SS (E) | −2.75 | 0.908 | 3.752E-017 | 1.0000 | 1.70 | 0.0957 | 2.79 | 0.0008 |
| BT (F) | −62.8 | 0.0155 | −0.01 | 0.7400 | 0.77 | 0.357 | −0.61 | 0.0552 |
| ZA (G) | 8.58 | 0.721 | 0.16 | 0.5263 | 0.21 | 0.789 | −1.18 | 0.0095 |
| LT (H) | 97.6 | 0.0025 | 0.06 | 0.0690 | −4.02 | 0.0108 | −5.64 | ˂0.0001 |
DC drug concentration, LC lipid concentration, SC surfactant concentration, ST surfactant, SS screw speed, BT barrel temperature, ZA zone of liquid addition, LT lipid
The coefficients in Eqs. (2)–(5) represent the respective quantitative effect of the independent variables (X1, X2, X3, X4, X5, X6, X7, and X8) on the response variables (Y1, Y2, Y3, and Y4).
The effect of selected independent variables on EE, PS, PDI, and ZP is graphically represented in Figs. 3 and 4 and supplementary data Figs. 2 and 3, respectively.
Fig. 3.

Contour plot of EE vs lipid concentration, surfactant concentration, zone of liquid addition, screw speed, and barrel temperature (red color indicates the higher EE, yellow indicates less EE, and blue color indicates lowest EE)
Fig. 4.

Contour plot of PS vs lipid concentration, surfactant concentration, and barrel temperature (dark blue color indicates the smaller PS and light blue color indicates larger PS)
Effect of Drug Concentration
The drug concentration was varied at two levels, viz., 0.5 and 1 g. As shown in Eqs. (2, 4, and 5), drug concentration had positive coefficients for PS, ZP, and EE, but the P value for the drug concentration was found to be more than 0.05 indicating that the drug concentration had insignificant effects on all four responses: PS, PDI, ZP, as well as EE. This could be due to the high solubility of FBT in both lipids Compritol® ATO 888 and Precirol® ATO 5, which might result in less variations in the viscosity of the oily phase, and therefore, there is lower shear generated inside the extruder barrel. Increasing drug concentration results in the increase in drug-to-lipid ratio, which usually decreases EE. Surprisingly, our results showed that increasing drug concentration did not decrease the EE of the drug. This may be due to the range of drug concentration we have used in the formulation. The concentration range from 0.5 to 1% w/w may be solubilizing the drug completely into the lipid, and therefore, there is no decrease in EE, as was observed. It may possible that if we increase drug concentration beyond 1% w/w, we might see a decrease in EE of the drug.
Effect of Surfactant Concentration
Concentration of surfactant demonstrated a significant influence on particle size and PDI. As shown in Eq. (2), the negative value of the coefficient for the surfactant concentration indicates particle size and PDI were decreased with an increase in SC. This might be due to the production and stabilization of smaller lipid droplets at higher SC as enough surfactant was present to reduce interfacial tension between two immiscible phases and stabilize the nano-droplets. Similar results were also reported earlier by Das et al., Hu et al., and Liu et al. [18, 25, 26]. SC had a significant effect (P < 0.05) on ZP. Equation (5) gives the positive coefficient for SC indicating an increase in SC increases ZP. Generally, SC exhibits a huge influence on entrapment efficiency. As described earlier in Rahman et al. [27], a higher amount of surfactant increases the solubility of the drug in the external phase and might be increasing the partitioning of drug from the internal phase to the external phase. Therefore, generally, entrapment efficiency increases with an increase in SC as the presence of sufficient SC, which helped the drug to remain within the lipid particles and/or the surface of the particles [18]. Surprisingly, we found that the SC had a negative coefficient, but P value was more than 0.05 indicating SC demonstrated an insignificant effect on EE (as shown in Eq. (5)).
Effect of Lipid Concentration
Lipid concentration did show a significant effect on all four responses: PS, PDI, ZP, and EE. Particle size significantly increased with increasing lipid concentration. Presence of high lipid concentration results to an increase in the viscosity of the drug-lipid melt. This viscosity increase might cause less homogenization during the initial phase of emulsification and produce larger particles and larger PDI. The negative coefficient of lipid concentration from Eq. (4) indicates an increase in LC decreases the ZP of the SLN formulation. This may be due to the negative charge of the lipid. As the amount of negatively charged lipid increases in the formulation, the ZP of formulation decreases. As expected, EE significantly increased with increasing LC. This might be due to availability of a higher amount of lipid to encapsulate more drug, which led to higher EE.
Effect of Different Surfactant
Choice of surfactant showed a significant effect on particle size of SLN. Positive coefficient for ST indicates changing ST from Cremophor EL to Tween 80 increases the particle size. Cremophor EL produces SLN with a smaller particle size than that of Tween 80. Similar observations are reported by other researchers Das et al. [18]. This might be due to the difference in hydrophile-lipophile balance (HLB) value of Cremophor EL and Tween 80. HLB value of 1 and 2 for Compritol® ATO 888 and Precirol® ATO 5, respectively, are closer to the HLB of 12–14 for Cremophor than HLB of 15 for Tween 80. ST showed a huge effect on EE. As mentioned previously, surfactant increases the solubility of the drug in the external phase and might be increasing the partitioning of drug from the internal phase to the external phase. As shown in Eq. (5), the negative coefficient for ST indicates that changing ST from Cremophor EL to Tween 80 decreases EE. This may be again due to the high HLB value of Tween 80. EE was significantly low when Tween 80 was used.
Effect of Screw Speed
Screw speed produced an insignificant effect (P ˃ 0.05) on PS, PDI, and ZP. On the other hand, it exhibited a significant effect on EE. The positive coefficient for screw speed indicates increase in speed results in the increase in EE. High screw speed generates higher shear inside the barrel, which might result in more homogenization causing more interaction of drug, lipid, and surfactant resulting in the formation of a homogeneous emulsion. Thus, this may explain the increase in EE.
Effect of Barrel Temperature
Barrel temperature only affected particle size of the SLN. The negative coefficient of barrel temperature for particle size demonstrated that increasing barrel temperature reduces the particle size of SLN. This might be because with high barrel temperature, it is possible that the lipids and drug are completely melted resulting in a low viscosity melt without any solid particles. Barrel temperature (zone 2) had insignificant effects on PDI, ZP, and EE of SLN.
Effect of Zone of Liquid Addition
Zone of liquid addition showed an insignificant effect on PS, PDI, and ZP. Surprisingly, however, ZA demonstrated a very significant effect (P = 0.0095) on entrapment efficiency. Negative coefficient for ZA indicates changing zone of liquid addition from zone 3 to zone 4 decreases EE. This is may be due to the difference in temperature of molten mass at zone 3 and zone 4. The temperature of the molten mass is higher in zone 3 than zone 4 which could affect mixing of the molten mass with the surfactant aqueous solution and droplet formation. Also, the other reason to decrease EE by changing the zone of liquid addition could be the length of mixing elements inside the barrel from zone 4 to die is less as compared to the mixing elements from zone 3 to die (Fig. 2). If we add surfactant solution at zone 3, then the molten mass of lipid-drug and surfactant solution are exposed to a larger mixing zone, which generates high shear and may enhance entrapment of drug inside the molten lipid. Addition of surfactant solution at zone 4 provides less exposure to the molten lipid-drug mass for mixing with the surfactant solution. Therefore, addition of liquid at zone 4 results in a decrease in EE (39.8%).
Effect of Different Lipid
Different lipids exhibited a positive impact on particle size, and Compritol® ATO 888 produced smaller SLN when used as the lipid. This may be due to the variations in melt viscosity of Compritol® ATO 888 and Precirol® ATO 5. The positive coefficient for LT for PDI indicates low PDI obtained with Compritol® ATO 888 than Precirol® ATO 5, but P value for LT was found to be more than 0.05 indicating an insignificant effect on PDI. EE was found higher in the case of Compritol® ATO 888 as compared to Precirol® ATO 5. These observations can be explained by the solubility study that demonstrated the higher solubilization capacity of Compritol® ATO 888 for FBT.
Quantification of Drug Release In Vitro
As aqueous solubility of FBT is very low, 0.3% SDS was added to the release media to maintain the sink condition. In vitro release of FBT from the optimized formulation (PB 9) was compared with the release of pure drug and the marketed micronized FBT formulation for a period of 5 h. The amount of FBT released from the SLN dispersion was determined by an in vitro dialysis bag technique. The dialysis bag retained the SLN particles; drug was released from SLN and diffused through the dialysis membrane into the release media. In vitro drug release studies (Fig. 5) showed approximately 94% drug was released at the end of 5 h for FBT SLN formulation (PB 9) and 62% for the marketed micronized FBT formulation at the end of 5 h, whereas 41% drug was released from pure FBT at the end of 5 h. The increase of the dissolution rate of SLN FBT could be mainly attributed to the obvious reduction of the particle size (from a few microns for the crude FBT and marketed micronized formulation to a few nanometers (125 nm) for SLN). According to Nernst-Noyes-Whitney equation, which described the dissolution rate of drug in a diffusion-controlled process, an increase in the surface area could result in an increase in dissolution rate [28–31].
Fig. 5.

Dissolution profile of FBT SLN prepared by novel HME-HPH method marketed micronized FBT formulation (Lofibra) and crude FBT
Comparison Between Novel HME-HPH Method and Conventional Method for the Preparation of SLN
The particle size, PDI, and ZP of the SLN produced using the novel HME-HPH method and conventional method are presented in supplementary data Fig. 4A–C. The pre-emulsion prepared by HME and the conventional method compared with each other are emphasized as this is the major contributing difference in these two methods. The quality of the pre-emulsion affects the quality of the final product attributes to a large extent, and it is desirable to obtain droplets in the size range within a few micrometers. Pre-emulsions prepared by both the novel method and the conventional method were characterized for PS, PDI, and ZP. Particle size of the pre-emulsion prepared by the conventional method was 1643 nm, whereas the PS was 653 nm when prepared by the novel method (see supplementary data Table 3). It is apparent that if the initial pre-emulsion particle size is significantly higher, it will take more cycles and pressure in the HPH to reduce the particle size to 150–200 nm. However, the particle size of the pre-emulsion prepared by the novel method is itself in nanometers; less downstream processing in the HPH is required. With this novel HME-HPH method, high pressure-induced drug degradation that could be caused by HPH can be prevented because of the requirement of a fewer number of cycles as well as lower pressure as compared to the conventional SLN preparation method.
In Vivo Pharmacokinetic Study
In order to determine whether the increase in the dissolution rate helps to improve the oral bioavailability, an in vivo experiment was conducted in the fasted state. The pro-drug FBT, which contains an ester group, undergoes rapid hydrolysis to produce fenofibric acid by intestinal, plasma, and tissue esterase, following oral administration. Thus, in the present study, the pharmacokinetic analysis of FBT is based on the plasma concentration of fenofibric acid. The plasma drug concentration-time profiles of FBT after oral administration of various formulations to male Wistar rats are shown in Fig. 6. The related pharmacokinetic parameters are summarized in Table IV. At all-time points, the fenofibric acid plasma concentration was significantly higher (P < 0.05) for the rats treated with fenofibrate SLN than the marketed and crude fenofibrate. The Cmax value of fenofibrate SLN (65.3 ± 7.2 μg/ml) was higher than that of the marketed (38.05 ± 5.8 μg/ml) and crude fenofibrate (20.0 ± 3.5 μg/ml). Twenty-four hours after oral administration, the fenofibrate-SLN plasma concentration was 10 μg/ml which was higher as compared to that of the marketed formulation (4 μg/ml) and crude fenofibrate (3 μg/ml). From these results, one can conclude that fenofibrate absorption was enhanced significantly by employing the SLN formulations compared to the marketed and crude fenofibrate [32, 33]. The most important advantage of SLN formulations over the crude fenofibrate is the lipid protection of drug from chemical as well as enzymatic degradation, thus further delaying the in vivo metabolism by oxidative and conjugative pathways. An increase in the rate of drug absorption from the SLN has been demonstrated compared to the both marketed micronized formulation and crude drug suspension. Reduction in particles size from the micro- to nanometer range increases the surface area, and thus increases the dissolution velocity according to the equation of Noyes-Whitney [6, 34].
Fig. 6.

Average plasma concentration time profiles of fenofibric acid following oral administration of 50 mg/kg in the rat. Three different formulations were tested: SLN prepared by novel HME-HPH method, marketed micronized FBT formulation, and crude FBT (mean ± SD, n = 4)
Table IV.
Pharmacokinetic Parameters of FBT Formulations in Wistar Rats (Dose 50 mg/kg, n = 4, Mean ± SD)
| Parameters | SLN formulation | Crude FBT | Micronized marketed FBT formulation |
|---|---|---|---|
| Tmax (h) | 4.42 ± 0.40*# | 6.9 ± 0.5 | 6.5 ± 0.4 |
| Cmax (μg/ml) | 65.3 ± 7.2*# | 20.0 ± 3.5 | 38.1 ± 5.8 |
| AUC0–24 (h/μg/ml) | 648 ± 85* | 266 ± 41 | 431 ± 70 |
| AUMC0–24 h (mg-h2/ml) | >5.34 ± 0.53*# | 2.31 ± 0.22 | 3.51 ± 0.32 |
| MRT0–24 (h) | 8.24 ± 0.50 | 8.66 ± 1.40 | 8.14 ± 0.70 |
AUC area under curve, AUMC area under the first moment curve, MRT mean residence time
*P < 0.05 compared with crude FBT; # P < 0.05 compared with Marketed FBT
Stability Study
Stability results are shown in supplementary data Table 4. Particle size, PDI, and zeta potential studies revealed no significant change (P value >0.05). Particle size increased after 6 months of storage at 25°C. Although, no significant change in particle size. A slight reduction in entrapment efficiency of the FBT SLN was observed after 6 months of storage at 25 and at 4°C. However, the changes were not significant. Thus, it can be concluded that FBT SLN have good physical stability in terms of particle size, PDI, ZP, and EE when stored at 4 and 25°C for the 6-month study period.
CONCLUSION
The current study demonstrates that our novel process based on HME-HPH of SLN production is an appropriate continuous technology for producing nano-formulations. The proposed method of HME-HPH was found to be suitable for continuous production of SLN using QbD principles and a DOE approach. This continuous, single step method was found to be a potentially economical as well as an efficiency benefit for the production of SLN. In addition, the process aids to minimize issues associated with the conventional methods of SLN preparation such as pressure-induced drug degradation. Findings of this study demonstrated that selected independent variables significantly affects critical quality attributes of the SLN. Thus, these outcomes of this research have successfully demonstrated the application of QbD principles and a DOE approach to develop a continuous process of SLN production via the HME-HPH technique.
Electronic Supplementary Material
(DOCX 1.20 mb)
References
- 1.Patil A, Pokharkar V. Single step spray drying method to develop proliposomes for inhalation: a systematic study based on quality by design approach. Pulm Pharmacol Ther. 2014;27:197–207. doi: 10.1016/j.pupt.2013.07.006. [DOI] [PubMed] [Google Scholar]
- 2.Basalious EB, El-Sebaie W, El-Gazayerly O. Application of pharmaceutical QbD for enhancement of the solubility and dissolution of a class II BCS drug using polymeric surfactants and crystallization inhibitors: development of controlled-release tablets. AAPS Pharm Sci Technol. 2011;12:799–810. doi: 10.1208/s12249-011-9646-6. [DOI] [PMC free article] [PubMed] [Google Scholar]
- 3.Maltesen MJ, Bjerregaard S, Hovgaard L, Havelund S, Weert M. Quality by design spray drying of insulin intended for inhalation. Eur J Pharm Biopharm. 2008;70:828–38. doi: 10.1016/j.ejpb.2008.07.015. [DOI] [PubMed] [Google Scholar]
- 4.Yerlikaya F, Ozgen A, Vural I, Guven O, Karaagaoglu E, et al. Development and evaluation of paclitaxel nanoparticles using a quality-by-design approach. J Pharm Sci. 2013;102:3748–61. doi: 10.1002/jps.23686. [DOI] [PubMed] [Google Scholar]
- 5.US FDA Guidance for industry: PAT—a framework for innovative pharmaceutical development, manufacturing, and quality assurance. Maryland: Silver Spring; 2004.
- 6.Hanafy A, Spahn-Langguth H, Vergnault G, Grenier P, Tubic Grozdanis M, et al. Pharmacokinetic evaluation of oral fenofibrate nanosuspensions and SLN in comparison to conventional suspensions of micronized drug. Adv Drug Deliv Rev. 2007;59:419–26. doi: 10.1016/j.addr.2007.04.005. [DOI] [PubMed] [Google Scholar]
- 7.Rao GC, Kumar MS, Mathivanan N, Rao ME. Nanosuspensions as the most promising approach in nanoparticulate drug delivery systems. Pharmazie. 2004;59:5–9. [PubMed] [Google Scholar]
- 8.Patil H, Kulkarni V, Majumdar S, Repka MA. Continuous manufacturing of solid lipid nanoparticles by hot melt extrusion. Int J Pharm. 2014;471:153–6. doi: 10.1016/j.ijpharm.2014.05.024. [DOI] [PubMed] [Google Scholar]
- 9.Niu X, Wan L, Hou Z, Wang T, Sun C, et al. Mesoporous carbon as a novel drug carrier of fenofibrate for enhancement of the dissolution and oral bioavailability. Int J Pharm. 2013;452:382–9. doi: 10.1016/j.ijpharm.2013.05.016. [DOI] [PubMed] [Google Scholar]
- 10.Sanganwar GP, Gupta RP. Dissolution-rate enhancement of fenofibrate by adsorption onto silica using supercritical carbon dioxide. Int J Pharm. 2008;360:213–8. doi: 10.1016/j.ijpharm.2008.04.041. [DOI] [PubMed] [Google Scholar]
- 11.Wishart DS, Konx C, Guo AC, Shrivastava S, Hassanali M, et al. Drug bank: a comprehensive resource for in silicon drug discovery and exploration. Nucleic Acids Res. 2006;1:D668–72. doi: 10.1093/nar/gkj067. [DOI] [PMC free article] [PubMed] [Google Scholar]
- 12.Ming-Thau S, Ching-Min Y, Sokoloski TD. Characterization and dissolution of fenofibrate solid dispersion systems. Int J Pharm. 1994;103:137–46. doi: 10.1016/0378-5173(94)90094-9. [DOI] [Google Scholar]
- 13.Mehnert W, Mader K. Solid lipid nanoparticles: production, characterization and applications. Adv Drug Deliv Rev. 2001;47:165–96. doi: 10.1016/S0169-409X(01)00105-3. [DOI] [PubMed] [Google Scholar]
- 14.Crowley MM, Zhang F, Repka MA, Thumma S, Upadhye SB, Battu SK, et al. Pharmaceutical applications of hot-melt extrusion: part I. Drug Dev Ind Pharm. 2007;33(9):909–26. doi: 10.1080/03639040701498759. [DOI] [PubMed] [Google Scholar]
- 15.Repka MA, Battu SK, Upadhye SB, Thumma S, Crowley MM, et al. Pharmaceutical applications of hot-melt extrusion: part II. Drug Dev Ind Pharm. 2007;33:1043–57. doi: 10.1080/03639040701525627. [DOI] [PubMed] [Google Scholar]
- 16.Breitenbach J. Melt extrusion: from process to drug delivery technology. Eur J Pharm Biopharm. 2002;54:107–17. doi: 10.1016/S0939-6411(02)00061-9. [DOI] [PubMed] [Google Scholar]
- 17.Maniruzzaman M, Boateng JS, Snowde MJ, Douroumis D. A review of hot-melt extrusion: process technology to pharmaceutical products. ISRN Pharm. 2012;1–9. [DOI] [PMC free article] [PubMed]
- 18.Das S, Ng WK, Kanaujia P, Kim S, Tan RB. Formulation design, preparation and physicochemical characterizations of solid lipid nanoparticles containing a hydrophobic drug: effects of process variables. Colloids Surf B: Biointerfaces. 2011;88:483–9. doi: 10.1016/j.colsurfb.2011.07.036. [DOI] [PubMed] [Google Scholar]
- 19.Dong Y, Ng WK, Shen S, Kim S, Tan RB. Solid lipid nanoparticles: continuous and potential large-scale nanoprecipitation production in static mixers. Colloids Surf B: Biointerfaces. 2012;94:68–72. doi: 10.1016/j.colsurfb.2012.01.018. [DOI] [PubMed] [Google Scholar]
- 20.Raza K, Singh B, Singal P, Wadhwa S, Katare OP. Systematically optimized biocompatible isotretinoin-loaded solid lipid nanoparticles (SLNs) for topical treatment of acne. Colloids Surf B: Biointerfaces. 2013;105:67–74. doi: 10.1016/j.colsurfb.2012.12.043. [DOI] [PubMed] [Google Scholar]
- 21.Shah RM, Malherbe F, Eldridge D, Palombo EA, Harding IH. Physicochemical characterization of solid lipid nanoparticles (SLNs) prepared by a novel microemulsion technique. J Colloid Interface Sci. 2014;428:286–94. doi: 10.1016/j.jcis.2014.04.057. [DOI] [PubMed] [Google Scholar]
- 22.Luo Y, Chen D, Ren L, Zhao X, Qin J. Solid lipid nanoparticles for enhancing vinpocetine's oral bioavailability. J Control Release. 2006;114:53–9. doi: 10.1016/j.jconrel.2006.05.010. [DOI] [PubMed] [Google Scholar]
- 23.Wang S, Chen T, Chen R, Hu Y, Chen M, et al. Emodin loaded solid lipid nanoparticles: preparation, characterization and antitumor activity studies. Int J Pharm. 2012;430:238–46. doi: 10.1016/j.ijpharm.2012.03.027. [DOI] [PubMed] [Google Scholar]
- 24.ICH Q 1 A (R2). Stability testing of new drug substances and products. http://www.emea.eu.int/pdfs/human/ich/273699en.pdf
- 25.Hu L, Tang X, Cui F. Solid lipid nanoparticles (SLNs) to improve oral bioavailability of poorly soluble drugs. J Pharm Pharmacol. 2004;56:1527–35. doi: 10.1211/0022357044959. [DOI] [PubMed] [Google Scholar]
- 26.Liu J, Hu W, Chen H, Ni Q, Xu H, et al. Isotretinoin-loaded solid lipid nanoparticles with skin targeting for topical delivery. Int J Pharm. 2007;328:191–5. doi: 10.1016/j.ijpharm.2006.08.007. [DOI] [PubMed] [Google Scholar]
- 27.Rahman Z, Zidan AS, Habib MJ, Khan MA. Understanding the quality of protein loaded PLGA nanoparticles variability by Plackett-Burman design. Int J Pharm. 2010;389(1–2):186–94. doi: 10.1016/j.ijpharm.2009.12.040. [DOI] [PMC free article] [PubMed] [Google Scholar]
- 28.Huang QP, Wang JX, Zhang ZB, Shen ZG, Chen JF, et al. Preparation of ultrafine fenofibrate powder by solidification process from emulsion. Int J Pharm. 2009;368:160–4. doi: 10.1016/j.ijpharm.2008.10.015. [DOI] [PubMed] [Google Scholar]
- 29.Van Drooge DJ, Hinrichs WL, Frijlink HW. Anomalous dissolution behaviour of tablets prepared from sugar glass-based solid dispersions. J Control Release. 2004;97:441–52. doi: 10.1016/j.jconrel.2004.03.018. [DOI] [PubMed] [Google Scholar]
- 30.Mosharraf M, NyatrÖm C. The effect of particle size and shape on the surface specific dissolution rate of microsized practically insoluble drugs. Int J Pharm. 1995;122:35–47. doi: 10.1016/0378-5173(95)00033-F. [DOI] [Google Scholar]
- 31.Müller RH, Peters K. Nanosuspensions for the formulation of poorly soluble drugs: I. Preparation by a size-reduction technique. Int J Pharm. 1998;160:229–37. doi: 10.1016/S0378-5173(97)00311-6. [DOI] [Google Scholar]
- 32.Jia Z, Lin P, Xiang Y, Wang X, Wang J, Zhang X, et al. A novel nanomatrix system consisted of colloidal silica and pH-sensitive polymethylacrylate improves the oral bioavailability of fenofibrate. Eur J Pharm Biopharm. 2011;79(1):126–34. doi: 10.1016/j.ejpb.2011.05.009. [DOI] [PubMed] [Google Scholar]
- 33.Borkar N, Xia D, Holm R, Gan Y, Mullertz A, Yang M, et al. Investigating the correlation between in vivo absorption and in vitro release of fenofibrate from lipid matrix particles in biorelevant medium. Eur J Pharm Sci. 2014;51:204–10. doi: 10.1016/j.ejps.2013.09.022. [DOI] [PubMed] [Google Scholar]
- 34.Noyes AA, Whitney WR. The rate of solution of solid substances in their own solutions. J Am Chem Soc. 1897;19:930–4. doi: 10.1021/ja02086a003. [DOI] [Google Scholar]
Associated Data
This section collects any data citations, data availability statements, or supplementary materials included in this article.
Supplementary Materials
(DOCX 1.20 mb)