

Abstract
Glycation of therapeutic proteins occurs during mammalian cell culture expression and upon administration to patients. Since the chemical attachment of mannose or other sugars via a chemical linker has been shown to increase a protein’s clearance rate in mice through the mannose receptor, we explored the effect of mannose glycation on the clearance of an IgG in mice. An IgG decorated with high levels of mannose (~18 mol/mol protein) through glycation did not clear faster in mice than the underivatized protein, whereas the same IgG decorated with mannose attached in a way to maintain the normal glycosidic bond (2-imino-2-methoxyethyl-1-thiomannoside, or IMT-mannose) at similar derivatization levels cleared significantly faster. Surface plasmon resonance studies revealed that the IgG derivatized with IMT-mannose bound tightly to the mannose receptor (KD = 20 nM) but the IgG glycated with mannose did not bind. These results indicate that glycation, even at unnaturally elevated levels, does not appear to be a clearance concern for therapeutic proteins.
KEY WORDS: mannose receptor, mass spectrometry, pharmacokinetics, surface plasmon resonance
INTRODUCTION
The presence of high mannose type glycans on proteins results in their more rapid elimination from circulation in mammals (1,2). Removal is likely mediated by the mannose receptor (MR), also called the macrophage mannose receptor, which is found on the surface of a variety of mammalian cells including immune cells and endothelial cells in the liver (3). Multiple carbohydrate recognition domains (CRD) within the MR may function cooperatively to increase the avidity and specificity of the carbohydrate binding (4). Each CRD has the capacity to bind only a single monosaccharide at a time, but flexibility in the MR backbone is thought to allow other CRDs to interact with additional terminal sugars on the same glycan (5). Therefore, a branched high mannose glycan structure with multiple terminal mannose residues would be expected to demonstrate higher avidity by binding to this receptor.
In some published studies, chemical attachment of mannose to proteins via a chemical linker has served as a model for high mannose glycans to assess animal pharmacokinetic parameters in animal studies. Bovine serum albumin (BSA) derivatized by relatively high levels of 2-imino-2-methoxyethyl-1-thiomannoside (IMT-mannose) is cleared from blood faster in mice than the same protein with lower IMT-mannose levels (6). Mice with the MR genetically knocked out clear the mannose-decorated BSA more slowly than wild-type mice, which is at a rate similar to that of the untreated BSA (1). BSA decorated with a high level of the IMT-mannose may have an increased density of mannose on the protein surface, mimicking the multiple terminal mannose residues on a high mannose glycan (6).
Reducing sugars can spontaneously attach to proteins in vivo and in vitro in a process called glycation. Initial attachment of the sugar to a lysine side chain or N-terminal amine generates a weak Schiff base linkage that can rearrange into a more stable ketoamine form (Fig. 1) (7). This rearrangement causes the loss of C-2 chirality in the sugar, thus eliminating the basis for the structural differences between an attached d-mannose and an attached d-glucose. In the blood stream, serum proteins are glycated by glucose, the main circulating sugar. The relative levels of glycation on a serum protein are a function of the lifetime of the protein and the serum concentrations of the sugar (8). Diabetic patients, with higher serum glucose levels, have been shown to have proportionally increased glycation levels on their serum proteins, such as on hemoglobin (9) or IgG (10). However, even under the elevated glucose concentrations found in the diabetic disease state, the glycation levels on endogenous serum proteins would be low in comparison to the IMT-mannose decoration levels achieved in the previously mentioned clearance studies. Biotherapeutic proteins expressed in tissue culture cells also are glycated from the glucose present in the media used to feed the cells, though again the levels are low, with only 10–20% of protein having a single glucose attached (0.1–0.2 mol attached glucose/mol protein) (8). Slightly higher levels, up to 0.5 mol attached per mole protein, have been observed on some monoclonal antibodies (11,12).
Fig. 1.
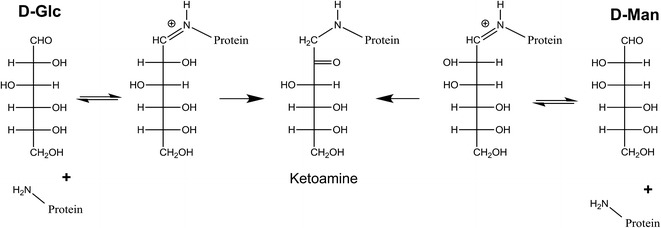
Glycation reaction scheme. D -Glc D-glucose; D -Man d-mannose. Sugar structures are listed in the open fischer projection
The impact of glycation on the pharmacokinetics (PK) of proteins is unclear. One report concluded that high levels of glucose-based glycation increased clearance rates of IgG in mice (13). Levels of glycation were calculated to be above 6 mol of attached glucose per mole of antibody, much higher than those that would occur naturally or in typical mammalian cell culture expression conditions. This result, coupled with studies showing that IMT-mannose decoration increases in vivo clearance rates, implies that mannose-based glycation (and glucose-based glycation), at least at the high derivatization rates used, could affect the clearance of biotherapeutics, including antibodies. To address this question, we compared in mice the clearance of a well-characterized mouse IgG mAbA decorated with IMT-mannose to the same IgG mAbA glycated with mannose.
MATERIALS AND METHODS
Materials
Endoproteinase Asp-N sequencing grade (PN: 11,054,589,001) was purchased from Roche. Bio-Spin 6 Tris columns (PN: 732–6227) were purchased from Bio-Rad Laboratories, Inc. (Hercules, CA). Gamma-irradiated Slide-A-Lyzer G2 dialysis cassettes with 10 K MWCO (PN: 88,251) were from Thermo Scientific. Gibco DPBS® (1×) Dubecco’s Phosphate-buffered Saline (PBS) without calcium and magnesium (PN: 14,190–144) was from Life Technologies (Grand Island, NY). Mouse monoclonal IgG mAbA was produced by Amgen Inc. (Thousand Oaks, CA). MAbA is a mouse IgG antibody produced from mouse hybridoma cells and purified by conventional chromatographic methods (14). The final protein concentration was 10 mg/mL in 10 mM sodium acetate, 9% sucrose at pH 5.2, and the mAb was stored at −80°C until use. Carrier-free Recombinant Mannose Receptor (Catalog # 2534-MR-050/CF) was purchased by R&D Systems (Minneapolis, MN). The reagents for endotoxin analysis Kinetic Limulus Amebocyte Lysate (LAL) Turbidimetric (catalog # KTA2 100 test), Escherichia coli Control Standard Endotoxin (catalog # 055:B5 500 NG), 0.1 M Tris buffer solution (catalog # BT103), and LAL Reagent Water (catalog # W130)] were purchased from Charles River Laboratories, Inc. (Wilmington, MA). All other chemicals were reagent grade or better.
Formation of Mannosylated Mouse IgG mAbA by 2-Imino-2-Methoxyethyl-1-Thiomannoside (IMT-Mannose)
IMT-mannose was prepared by conditions described by Lee et al. (15). IMT-mannose-decorated mAbA was prepared by incubating mAbA (2.5 mg/mL) with 7 mM IMT-mannose in 0.1 M bicarbonate buffer (pH 9.2) with continuous mixing at 23°C for 23 h. After incubation, the sample was dialyzed overnight into PBS. The concentration of modified mAbA was adjusted to 1 mg/mL in PBS and stored in≤−70°C prior to use.
Formation of Mannose-Glycated mAbA
MAbA was glycated by mannose to achieve a low or high overall level. For low level mannose glycation, mAbA (2.5 mg/mL) was incubated in 1 M mannose in PBS at 37°C for 24 h. For a highly glycated level, mAbA (2.5 mg/mL) was incubated with 1 M mannose in 0.1 M sodium bicarbonate buffer (pH 8.2) 96 h. At the end of incubation period, each sample was dialyzed overnight into PBS. After dialysis, the concentration of glycated mouse IgG mAbA was adjusted to 1 mg/mL with PBS and stored in ≤−70°C prior to use. For underivatized control antibody, mAbA was diluted into PBS to 1 mg/mL from purified and concentrated material that had been stored in −80°C. Endotoxin analysis, based on the turbidimetric changes upon incubation with LAL, was similar to that proposed by the manufacturer.
Analytical SEC Analysis of mAbA Samples
MAbA samples (20 μg) were injected onto a Tosoh Bioscience G3000swxl 5 um, 7.8 × 300 mm column with mobile phase of 100 mM sodium phosphate, 250 mM NaCl, pH 6.8 at 0.5 mL/min, and detected at 280 nm.
Reversed Phase Liquid Chromatography/Mass Spectrometry (RP LC/MS) Analysis
MAbA samples were treated with 5 mM dithiothreitol at room temperature for 1 h to reduce interchain disulfide bonds prior to analysis. RP-HPLC/MS analysis was performed as described (8). The analysis was performed on a Waters ACQUITY®UPLC system directly coupled with a Waters Xevo G2 electrospray time-of-flight mass spectrometer.
Endoproteinase Asp-N Peptide Mapping of Glycated Products
MAbA samples (60 μg) were denatured by diluting to a final concentration of 0.46 mg/mL, into a buffer containing 0.1 M Tris, 8 M guanidine-HCl, and pH 8.3. Disulfide bonds were reduced by incubating these denatured samples for 30 min in 9 mM dithiothreitol. Subsequently, samples were carboxymethylated at room temperature for 30 min by adding iodoacetic acid to 15 mM. Samples were then buffer-exchanged into 0.1 M Tris, pH 7.5 by using Bio-Spin 6 Tris columns. Endoproteinase Asp-N digestion was achieved by using at a ratio of 1:50 (proteinase:mAbA) and incubating at 37°C overnight. The reaction was terminated by addition of 20% trifluoroacetic acid (TFA) to a final concentration of 1.3% (v/v)
The digested samples were analyzed by LC/MS/MS. The LC/MS/MS system consisted of a Waters ACQUITY® UPLC system connected inline to a Thermo Scientific Q Exactive Hybrid Quadrupole-Orbitrap mass spectrometer. A reversed phase HPLC column (Waters ACQUITY® UPLC BEH300 C4 1.7 μm, 2.1 × 150 mm PN: 186,004,497) was used to separate the peptides with the column temperature at 75°C; mobile phase A: 0.1% TFA (v/v) in water and mobile phase B: 0.1% TFA in 90% (v/v) acetonitrile. The gradient (hold %B at 0.5% for 5 min, then 5–55% B for 180 min) was performed at 0.1 mL/min. The chromatogram was monitored by both UV light absorbances (214 and 280 nm) and MS. Mass spectrometer parameters set up and data analysis software were the same as described (8). Selected ion current of mass additions of 235 and 162 amu were used to quantify IMT-mannose and mannose glycation on each peptide, respectively.
Mouse PK Study and PK Parameter Analysis
Animals were housed at an Association for Assessment and Accreditation of Laboratory Animal Care International accredited facility in accordance with the Guide for the Care and Use of Laboratory Animals, 8th Edition (National Research Council (USA). Committee for the Update of the Guide for the Care and Use of Laboratory Animals, Institute for Laboratory Animal Research (USA) (16). Male CD-1 mice (Charles River Laboratories, CA) received an intravenous 1 mg/kg bolus injection of the control and various glycated mAbA samples. Approximately 100 uL of whole blood per mouse (n = 3 mice per time-point group) was collected by composite sampling (three samples taken per mouse over the course of the study) into Microtainer® Brand Serum Separator Tubes (Becton, Dickinson and Co.; NJ, USA) at each time-point sampled: 0.083, 0.25, 0.5, 1, 2, 6, 24, 28, and 96 h (a 168 h sample was collected from the control mAb animals.) After collection, tubes were inverted at room temperature several times until fully clotted and processed for serum by centrifugation at 13,000 rpm for 15 min. The collected serum was maintained at −70°C (±10°C) storage for subsequent analysis.
MAbA was quantified in mouse serum with a sandwich immunoassay on Gyrolab® xP Workstation. Standards (STD) and quality controls (QCs) were prepared by spiking mAbA into 100% mouse serum. The biotinylated recombinant human anti-MabA antibody (Amgen Inc.) was first loaded through a common channel within the bioaffy CD as a capture reagent. Biotinylated capture reagent forms a complex with streptavidin-coated beads which reside within the Bioaffy 200 CD’s microstructures. STD, QC, blank, and study samples are pretreated 1:10 prior to loading into Bioaffy 200 CD. The mAb present in the STDs, QCs, and study samples was captured by the biotinylated anti-MabA antibody. The detection antibody, ALEXA 647-labeled rat anti-mouse IgG1 monoclonal antibody, was then loaded through a common channel within the bioaffy CD allowing for immune-complexes formation. Detection was done via laser-induced fluorescence through excitation at 633 nm and emission at 668 nm. The fluorescence signal, which is proportional to the amount of mAb, was measured by a photo multiplier tube within Gyrolab® system. The concentration versus fluorescence relationship is regressed according to a five-parameter logistic (Marquardt) regression model with a weighting factor of 1/Y2. The conversion of fluorescence units for QC and study samples to concentrations is performed using the current Watson® LIMS (Thermo Scientific, MA, USA) data reduction software. Non-compartmental PK parameters were calculated using Watson® LIMS (Thermo Scientific, MA) from serum concentration data. The following parameters were obtained: the area under the serum concentration-time curve from 0 to 96 h (AUC0–96 h), the systemic clearance (CL0–96 h, relative to the exposure interval), and MRT (mean residence time or the average time the drug resides in the body). Statistical comparisons of functions plotted against the clearance profiles were performed in the program SAS® version 9.3 (SAS Institute, Cary, NC).
Mannose Receptor Binding Studies Using Surface Plasmon Resonance
Analyses were performed on a BIAcore® T200 instrument (Biacore, GE Healthcare) as previously described (17). Recombinant macrophage mannose receptor was immobilized on a CM5 chip using standard amine coupling to maximum ~12,000 RU on BIAcore T200. Samples at 100 nM diluted in sample buffer (10 mM HEPES, 150 mM NaCl, 1 mM Ca2+, 1 mM Mg2+, 0.005% P20, 0.1 mg/ml BSA) were injected at flow rate of 10 μl/min. Instrument running buffer is the same as sample buffer, but without BSA. To measure the binding kinetics, recombinant macrophage mannose receptor was immobilized on a CM5 chip using same amine coupling to 2000 RU. IMT-mannose mAbA (0.78 ~ 400 nM) and RNase B (0.78 ~ 800 nM) diluted in the same sample buffer described above were injected at a flow rate of 50 μl/min for 3 min association and 10 min dissociation. Instrument running buffer is the same as described above. RNAse B is a high mannose containing protein (18) that served as a positive control for MR binding, much like mannan or mannosylated IgG have been used in a previous study (17). On-rate, off-rate, and equilibrium dissociation constants were calculated using the 1:1 binding model on BIAevaluation® software (Biacore, GE Healthcare).
RESULTS
Characterization of Mannosylated IgG
Incubation conditions were manipulated to generate a mouse antibody, mAbA, decorated with specific levels of mannosylation through chemical attachment. MAbA was chosen for mouse PK studies because it lacks cross-reactivity with mouse antigens, thus simplifying the in vivo PK characterization. High levels of IMT-mannose attachment on mAbA were sought (20 mol sugar/mol protein) to match levels shown to increase clearance of BSA in mice (6). This sample could potentially serve as a positive control in the clearance studies. Similar levels of mannose glycation on mAbA (20 mol sugar/mol protein) were desired to allow a direct comparison of the effects of the two types of sugar attachment, independent of the derivatization level. A second mannose glycation sample, with lower levels of mannose glycation, was also prepared (goal of 1 mol sugar/mol protein). This sample would have derivatization levels more comparable to those found during typical biotherapeutic manufacturing, which would not have the large number of sugar attachments per protein.
The degree of IMT-mannose decoration and mannose glycation was determined through mass spectrometric analysis of the mAbA heavy chain and light chain after disulfide reduction. Each IMT-mannose addition to a polypeptide results in an increase in mass of 235 Da. Multiple IMT-mannose attachments per polypeptide chain could be observed as multiples of 235 Da mass additions (Fig. 2d). The overall total IMT-mannose addition per antibody was calculated by summing the distribution average additions on the light chain to the distribution average on the heavy chain, then multiplying by two (antibody structure of two HCs and two LCs). While this calculation generates the average sugar additions per molecule, heavily derivatized molecules actually contain a wide distribution of attachments per molecule. Similarly, incubation conditions were established to produce mAbA with different mannose glycation levels. In the case of glycation, each sugar attachment resulted in a 162 Da increase to the polypeptide chain mass. Example spectra are shown for mannose glycation on the LC at different decoration levels in Fig. 2b and c. Since attachment through glycation can be either stable (Amadori rearrangement) (8) or unstable (Schiff base), dialysis was performed on the mannose-glycated mAbA prior to analysis to allow removal of any unstably bound links.
Fig. 2.
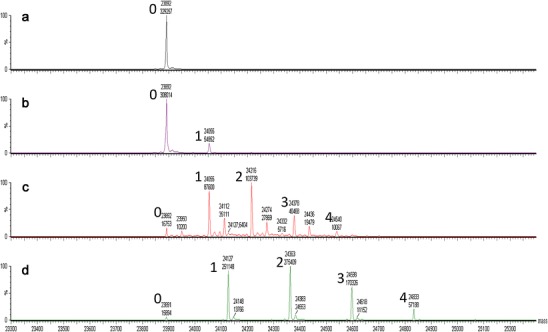
Mass spectrometric analysis of sugar derivatized mAbA. Time of flight analysis of reduced denatured light chain is shown. a underivatized, b glycated with low levels of mannose, c glycated with high levels of mannose, and d derivatized with high levels of IMT-mannose. The number to the left of the labeled peaks refers to the number of sugars attached per light chain
Table I lists the average level of derivatization and the analytical summary for mAbA preparations used in the animal PK study. MAbA with high glycation levels matched the IMT-mannose derivatization levels fairly well. A summary of additional characterization on all antibody preparations prior to administration to mice is included in Table I. Analytical size exclusion chromatography was performed to determine whether the glycation reactions and sample manipulation resulted in any aggregate formation. Little if any change in the levels of dimer or larger aggregated forms was observed in the glycated material. This result is consistent with a previous study in which up to 40 mol of glucose glycation was added to an antibody without perturbing the antibody function (2). In addition, all antibody samples had low or undetectable levels of endotoxin.
Table I.
Derivitization Levels on mAbA
| Sugar | Derivatization Level (mol sugar/mol Ab) | HMW Level (%) | Endotoxin level (EU/mL) |
|---|---|---|---|
| Unmodified | – | 2.2 | <0.2 |
| IMT-Man | 18.2 | 5.3 | 0.3 |
| High Man Glycation | 17.5 | 6.7 | < 0.2 |
| Low Man Glycation | 1.4 | 4.6 | < 0.2 |
HMW high molecular weight, EU endotoxin units, IMT 2-imino-2-methoxyethyl 1-thio
IMT-mannose and mannose glycation both attach to the protein through lysine side chains and the free N-terminal amine. Asp-N peptide mapping was performed on the highly derivatized preparations of IMT-Mannose mAbA (goal of 20 mol sugar/mol protein) and glycated mannose mAbA (goal of 20 sugar mol/mol protein) to determine the site specific distribution of the different chemical moieties (8). Both mannose derivatization methods generated adducts widely distributed among lysine side chains. No strong bias was found among the positions identified (not shown). In general, the lysine derivatization ranged from 10 to 30% by position for both samples.
Effect of Sugar Derivatization on Antibody Clearance
Mice were intravenously administered mAbA either decorated with high levels of IMT mannose, high levels of mannose glycation, low levels of mannose glycation or underivatized (control mAbA). The underivatized control mAbA was incubated under conditions similar to the glycation reactions but without added sugar. Blood samples were removed at various time points after mAbA administration to quantitate mAbA serum levels by ligand binding assay over the time course of the study. The concentration versus time plot of the various mAbA entities reveals PK profiles showing differential initial alpha-phases of clearance followed by less rapid beta-phase elimination (Fig. 3a). The high level IMT mannose mAbA sample cleared much more rapidly than all other samples over both phases, as judged by the 1.5 times lower mean residence time and the greater than 13–17 times increase in clearance and >13–17 times decrease in area under the curve compared to the low and high level mannose-glycated mAbA, respectively. The PK parameter differences for CL and AUC determined for the mAbA control samples were within 1.3 times high mannose glycation samples. Overlapping 95% confidence intervals of plotted functions indicate that these two data sets are not significantly different.
Fig. 3.
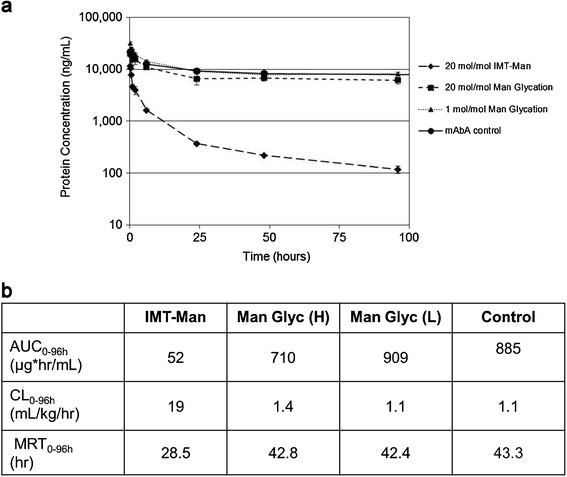
Pharmacokinetics of mAbA samples in mice. a concentration versus time plots of IMT-mannose (solid diamond), high levels of mannose glycated (solid square), low-mannose glycated (solid triangle), and control (underivatized) mAbA (solid circle) samples after 1 mg/kg intravenous administration to CD-1 mice. b PK parameters, including area under the curve (AUC0–96 h), clearance (CL0–96 h), and mean residence time (MRT0–96 h) derived from concentration data of mAbA samples. Error bars represent ± one standard deviation;.(H) high levels of mannose glycation; (L) low levels of mannose glycation
The mAbA serum concentration data for the low and high levels of glycation, and control mAbA samples were replotted using a linear scale to detect smaller differences between the clearance profiles, with each plot being normalized to the initial measured serum concentration (Fig. 4). Again, no significant difference in clearance was apparent between these samples.
Fig. 4.
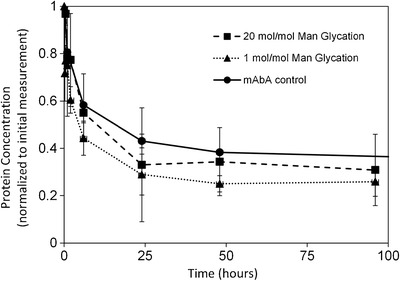
Normalized concentration versus time plots of mAbA samples in mice. Data were normalized to the initial concentration of mAbA and plotted using a linear scale to demonstrate that profiles of the various mAbA samples are within twofold. Symbols are the same as those in Fig. 3. Error bars represent ± one standard deviation
Mannose Receptor Binding
The binding affinities of mAbA samples with either high levels of IMT-mannose attachment or mannose glycation to human recombinant mannose receptor were tested using surface plasmon resonance on BIAcore® T200 (17). No MR binding response was detected for the high mannose-glycated mAbA (Fig. 5, trace c) or the control mAbA sample (Fig. 5, trace d), indicating a lack of binding to MR, but a robust response was observed for the IMT-mannose mAbA (Fig. 5, trace a) and the RNaseB control (Fig. 5, trace b). The equilibrium binding constant (KD) for IMT-mannose mAbA to the MR was derived from additional dose-titration binding studies (Fig. 5b) and was calculated to be approximately 20 nM (Fig. 5c), which is considered relatively high affinity binding. Collectively, these in vitro MR binding results are consistent with the accelerated in vivo clearance of the IMT-mannose mAbA through the MR in the PK study.
Fig. 5.
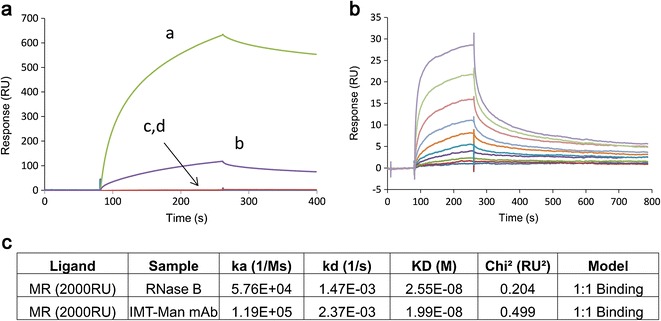
Surface plasmon resonance (SPR) analysis of mAbA samples. a SPR sensorgrams for binding of 100 nM of samples to immobilized MR at 12,000 RU: high levels of IMT-mannose mAbA (a), RNAse B (b), high levels of mannose glycated mAbA (c), and control mAbA (d). b Concentration dependent binding for high levels of IMT-mannose mAbA to immobilized MR at 2000 RU. Protein concentrations from low to high: 0.78, 1.6, 3.1, 6.2, 12.5, 25, 50, 100, 200, and 400 nM
DISCUSSION
The results shown herein are consistent with the previous studies that showed high levels of mannose chemically attached (IMT-mannose) to the surface of a protein increased clearance rates of those proteins in mice (1,6). While in the previous work, the effects on clearance were demonstrated using albumin (~66 kDa), similar enhanced clearance was observed in this study with the larger mouse IgG mAbA (~150 kDa) derivatized with an average of 17 mol of IMT-mannose per mole of protein. However, we extend the results to demonstrate that when mannose is attached to the same antibody at similar levels through the process of glycation, no apparent increase in clearance rates was measured. The effects of derivatization level on the mAb clearance rates were not explored for the IMT-mannose-decorated mAbA, since mannose glycation did not show any impact on clearance at high derivatization levels. Mannose receptors, which are responsible for the faster clearance (1) of proteins with high mannose glycans or decorated with IMT-mannose, bind with high affinity to these proteins but not to mannose-glycated mAbA. Since the MR is conserved between mice and humans and its physiological role in clearance of proteins with high mannose glycans is thought to be similar, the PK results demonstrated here would be expected to translate to humans.
Structural differences between the mannose attached through glycation and through the IMT linkage must account for the mannose receptor binding and clearance differences. IMT-mannose (Fig. 6) remains a closed pyranose ring structure following attachment because the thioglycosidic bond linking the IMT group to the sugar prevents ring opening, similar to terminal mannose residues found in an N-linked high mannose structure. Glycation, through mannose or the more commonly described glucose, is often represented as the open (acyclic) structures shown in Fig. 1. However, multiple studies (19,20) have demonstrated that the glucose-glycated structures are instead mainly closed ring structures, taking the form of either a pyranose (Fig. 6b) or a furanose (Fig. 6c). Conversion between the pyranose and furanose forms would presumably involve an acyclic intermediate. Structures for the glucose glycation would thus be expected to be identical to mannose-glycated structures since the chirality, which distinguishes mannose from glucose, is lost upon Amadori rearrangement (Fig. 1). Ring structures formed on the glycated products are between the C-2 and the C-6 (pyranose, Fig. 6b) or the C-5 (furanose, Fig. 6c) hydroxyl, whereas the ring on free mannose or mannose in a high mannose glycan forms between C-1 and the C-5 hydroxyl. Apparently, these similar linkages on the mannose glycation product render them unrecognizable to the mannose receptor. Results here indicate that proper characterization of therapeutic protein product quality attributes is a critical first step in their determination of biological relevance.
Fig. 6.
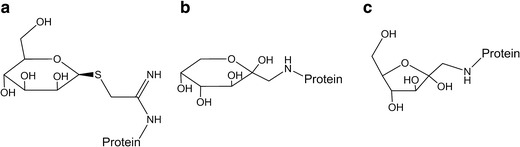
Predicted structures of attached sugars. a IMT-mannose, b pyranose form of glycated sugar (mannose or glucose), and c furanose form of glycated sugar (mannose or glucose). Only the beta anomer of each glycated structure is shown
The mannose receptor CRD-4 crystal structure has been solved (21). Mutagenesis studies have identified this domain as critical for glycan binding and function (22). Unfortunately, the structure did not include the bound sugar. An attempt was made to retrospectively model in the mannose based on the mutagenesis information, but the limited modeled sugar contacts are insufficient to explain the ligand specificity. Thus, structural information published to date cannot account for the glycated mannose versus mannose binding differences.
Mannose derivatization conditions in published studies have been designed to generate high levels of sugar attachment on the test proteins to achieve the clearance effects. These levels are many times greater than those found on endogenous proteins, such as serum IgG, or on antibody therapeutics derived from mammalian cell cultures through the process of glycation. For example, the glycated IgG prepared in the study by Kennedy et al. used 0.5 M glucose incubations for 14–19 days to obtain greater than 6 mol glucose per mole antibody (13). In contrast, endogenous human IgG contains about 0.13 mol glucose glycation per mole antibody and therapeutic IgGs contain between 0.1 and 0.2 mol glycation per mole antibody, meaning that 80–90% of these IgG molecules have no glycation at all (8). Of the glycated fraction, a large majority contains only a single-glycated adduct. Since several of the lysine residues on the protein surface can react with the reducing sugar, the single-glycated species is not a unique molecular form. Forced glycation conditions that produce elevated glycation levels increase the fraction of the protein glycated but also create proteins containing a few to several glycation adducts per IgG molecule. Results presented here indicate that even if extraordinary glycation levels were obtained on therapeutic antibodies, these modifications would not be expected to increase the clearance rate in vivo because the glycation generates a chemical structure not recognized by the mannose receptor.
CONCLUSION
This study showed that IgG highly decorated with mannose through glycation did not clear faster in mice than the underivatized protein, whereas the same IgG decorated with mannose attached in a way to maintain the normal glycosidic at similar derivatization levels cleared significantly faster. Binding studies are consistent with the PK studies, showing that glycated product is not recognized by the mannose receptor. Therefore, glycation, even at unnaturally elevated levels, does not affect clearance for therapeutic proteins.
Acknowledgments
We thank Guna Kannan, John McCarter, Andy Goetze, and Diana Liu for helpful discussions, Michael Shearer, Kiani Maryam, and Toung-vi Don for technical assistance and Fuat Doymaz for statistics advice.
Abbreviations
- AUC
area under the curve
- BSA
bovine serum albumin
- CHO
Chinese hamster ovary
- CRD
carbohydrate recognition domain
- IMT
2-imino-2-methoxyethyl-1-thio-
- LC
liquid chromatography
- mAb
monoclonal antibody
- MR
mannose receptor
- MRT
mean residence time
- MS
mass spectrometry
- PK
phamacokinetics
- RU
resonance units
- SPR
surface plasmon resonance
References
- 1.Lee SJ, Evers S, Roeder D, Parlow AF, Risteli J, Risteli L, et al. Mannose receptor-mediated regulation of serum glycoprotein homeostasis. Science (New York) 2002;295(5561):1898–901. doi: 10.1126/science.1069540. [DOI] [PubMed] [Google Scholar]
- 2.Goetze AM, Liu YD, Zhang Z, Shah B, Lee E, Bondarenko PV, et al. High-mannose glycans on the Fc region of therapeutic IgG antibodies increase serum clearance in humans. Glycobiology. 2011;21(7):949–59. doi: 10.1093/glycob/cwr027. [DOI] [PubMed] [Google Scholar]
- 3.Linehan SA, Martinez-Pomares L, Stahl PD, Gordon S. Mannose receptor and its putative ligands in normal murine lymphoid and nonlymphoid organs: In situ expression of mannose receptor by selected macrophages, endothelial cells, perivascular microglia, and mesangial cells, but not dendritic cells. J Exp Med. 1999;189(12):1961–72. doi: 10.1084/jem.189.12.1961. [DOI] [PMC free article] [PubMed] [Google Scholar]
- 4.Taylor ME, Bezouska K, Drickamer K. Contribution to ligand binding by multiple carbohydrate-recognition domains in the macrophage mannose receptor. J Biol Chem. 1992;267(3):1719–26. [PubMed] [Google Scholar]
- 5.Llorca O. Extended and bent conformations of the mannose receptor family. Cell Mol Life Sci : CMLS. 2008;65(9):1302–10. doi: 10.1007/s00018-007-7497-9. [DOI] [PMC free article] [PubMed] [Google Scholar]
- 6.Opanasopit P, Shirashi K, Nishikawa M, Yamashita F, Takakura Y, Hashida M. In vivo recognition of mannosylated proteins by hepatic mannose receptors and mannan-binding protein. Am J Physiol Gastrointest Liver Physiol. 2001;280(5):G879–89. doi: 10.1152/ajpgi.2001.280.5.G879. [DOI] [PubMed] [Google Scholar]
- 7.Bucola R, Cerami A. Advanced Glycosylation: Chemistry, Biology, and Implications for Diabetes and Aging. Adv Pharmacol. 1992;23:1–33. doi: 10.1016/S1054-3589(08)60961-8. [DOI] [PubMed] [Google Scholar]
- 8.Goetze AM, Liu YD, Arroll T, Chu L, Flynn GC. Rates and impact of human antibody glycation in vivo. Glycobiology. 2012;22(2):221–34. doi: 10.1093/glycob/cwr141. [DOI] [PubMed] [Google Scholar]
- 9.Koenig RJ, Peterson CM, Jones RL, Saudek C, Lehrman M, Cerami A. Correlation of glucose regulation and hemoglobin AIc in diabetes mellitus. N Engl J Med. 1976;295(8):417–20. doi: 10.1056/NEJM197608192950804. [DOI] [PubMed] [Google Scholar]
- 10.Austin GE, Mullins RH, Morin LG. Non-enzymic glycation of individual plasma proteins in normoglycemic and hyperglycemic patients. Clin Chem. 1987;33(12):2220–4. [PubMed] [Google Scholar]
- 11.Miller AK, Hambly DM, Kerwin BA, Treuheit MJ, Gadgil HS. Characterization of site-specific glycation during process development of a human therapeutic monoclonal antibody. J Pharm Sci. 2011;100(7):2543–50. doi: 10.1002/jps.22504. [DOI] [PubMed] [Google Scholar]
- 12.Zhang B, Yang Y, Yuk I, Pai R, McKay P, Eigenbrot C, et al. Unveiling a glycation hot spot in a recombinant humanized monoclonal antibody. Anal Chem. 2008;80(7):2379–90. doi: 10.1021/ac701810q. [DOI] [PubMed] [Google Scholar]
- 13.Kennedy DM, Skillen AW, Self CH. Glycation increases the vascular clearance rate of IgG in mice. Clin Exp Immunol. 1993;94(3):447–51. doi: 10.1111/j.1365-2249.1993.tb08216.x. [DOI] [PMC free article] [PubMed] [Google Scholar]
- 14.Shukla AA, Hubbard B, Tressel T, Guhan S, Low D. Downstream processing of monoclonal antibodies—Application of platform approaches. J Chromatogr B Analyt Technol Biomed Life Sci. 2007;848(1):28–39. doi: 10.1016/j.jchromb.2006.09.026. [DOI] [PubMed] [Google Scholar]
- 15.Lee YC, Stowell CP, Krantz MJ. 2-Imino-2-methoxyethyl 1-thioglycosides: New reagents for attaching sugars to proteins. Biochemistry. 1976;15(18):3956–63. doi: 10.1021/bi00663a008. [DOI] [PubMed] [Google Scholar]
- 16.National Research Council (U.S.). Committee for the Update of the Guide for the Care and Use of Laboratory Animals, Institute for Laboratory Animal Research (U.S.), National Academies Press (U.S.). Guide for the care and use of laboratory animals. 8th ed. Washington, D.C.: National Academies Press; 2011. xxv, 220 p. p.
- 17.Gustafsson A, Sjoblom M, Strindelius L, Johansson T, Fleckenstein T, Chatzissavidou N, et al. Pichia pastoris-produced mucin-type fusion proteins with multivalent O-glycan substitution as targeting molecules for mannose-specific receptors of the immune system. Glycobiology. 2011;21(8):1071–86. doi: 10.1093/glycob/cwr046. [DOI] [PubMed] [Google Scholar]
- 18.Chen X, Flynn GC. Gas-phase oligosaccharide nonreducing end (GONE) sequencing and structural analysis by reversed phase HPLC/mass spectrometry with polarity switching. J Am Soc Mass Spectrom. 2009;20(10):1821–33. doi: 10.1016/j.jasms.2009.06.003. [DOI] [PubMed] [Google Scholar]
- 19.Neglia CI, Cohen HJ, Garber AR, Ellis PD, Thorpe SR, Baynes JW. 13C NMR investigation of nonenzymatic glucosylation of protein. Model studies using RNase A. J Biol Chem. 1983;258(23):14279–83. [PubMed] [Google Scholar]
- 20.Rohovec J, Maschmeyer T, Aime S, Peters JA. The structure of the sugar residue in glycated human serum albumin and its molecular recognition by phenylboronate. Chemistry. 2003;9(10):2193–9. doi: 10.1002/chem.200204632. [DOI] [PubMed] [Google Scholar]
- 21.Feinberg H, Park-Snyder S, Kolatkar AR, Heise CT, Taylor ME, Weis WI. Structure of a C-type carbohydrate recognition domain from the macrophage mannose receptor. J Biol Chem. 2000;275(28):21539–48. doi: 10.1074/jbc.M002366200. [DOI] [PubMed] [Google Scholar]
- 22.East L, Isacke CM. The mannose receptor family. Biochim Biophys Acta. 2002;1572(2–3):364–86. doi: 10.1016/S0304-4165(02)00319-7. [DOI] [PubMed] [Google Scholar]