Abstract
The aim of this study was to investigate the antioxidant activity of orange (Citrus auranthium) flesh (OF) and peel (OP) extracted with acetone, ethanol, and methanol. Antioxidant potential was examined by measuring total phenolic content (TPC), 2,2-diphenyl-1-picrylhydrazyl (DPPH) radical scavenging activity (RSA), total radical-trapping anti-oxidant potential (TRAP), oxygen radical absorbance capacity (ORAC), and cellular antioxidant activity (CAA). The comet assay was used to determine the protective effects of OF and OP against H2O2-induced DNA damage. TPC was highest in the acetone extracts of OF and OP. DPPH RSA was also higher in the acetone extracts than in the ethanol extracts. The DPPH RSA was highest in the acetone extracts of OF. The TRAP and ORAC values of the all extracts increased in a dose-dependent manner. In the TRAP assay, the acetone extracts of OF and OP had the lowest IC50 values. In the CAA assay, the methanol and acetone extracts of OP had the lowest IC50 values. All of the samples protected against H2O2-induced DNA damage in human leukocytes, as measured by the comet assay, but the acetone extracts of OP had the strongest effect. These results suggest that acetone is the best solvent for the extraction of antioxidant compounds from OF and OP. Furthermore, the high antioxidant activity of OP, which is a by-product of orange processing, suggests that it can be used in nutraceutical and functional foods.
Keywords: orange parts, solvents, antioxidant activity, cellular antioxidant activity, comet assay
INTRODUCTION
Hypertension, cancer, heart disease, and diabetes are closely related to dietary habits. Recently, functional foods have gained popularity because they can reduce the incidence of these diet-related diseases (1). Epidemiological studies strongly suggest that foods containing phytochemicals, such as fruits and vegetables containing antioxidants, have protective effects against disease (2). Consumption of fruits and vegetables prevents degenerative processes caused by oxidative stress (3,4).
The orange, which is consumed worldwide, is an important source of vitamin C and polyphenolic compounds (5). Importation of oranges into South Korea has increased since the South Korea-United States Free Trade Agreement was put into effect. In 2012, 115,500 tonne of oranges were imported into South Korea, which was 39,900 tonne greater than the amount imported in 2010 (6).
The major phenolic compounds present in the orange include hydroxycinnamic acids (HCA) and flavonoids, among which flavanones are the most prevalent (5). Citrus flavonoids, especially hesperidin, have a wide range of therapeutic properties, including anti-inflammatory, antihypertensive, diuretic, analgesic, and hypolipidemic activities (7–10). The concentrations of antioxidant components vary among the different parts of the orange (11); therefore, the antioxidant activity of orange parts may also vary. In general, the peel of the fruit contains a higher concentration of antioxidant substances than the flesh of the fruit (12).
Owing to the differing antioxidant potential of compounds with different polarities in complex food samples, the results of assays used to assess the antioxidant capacity of food samples are strongly affected by the solvent extraction method used to prepare samples (13). To the authors’ knowledge, the antioxidant activity of orange flesh (OF) and orange peel (OP) extracts containing compounds with different polarities has not been reported. Furthermore, antioxidants may respond to different radical or oxidant sources in a different manner. Because multiple reaction characteristics, mechanisms, and phase localizations are usually involved, no single assay can accurately reflect all of the radical sources and antioxidants present in a mixed or complex system (14).
To evaluate the potential benefits of specific compounds or fractions from the orange, various standardized methods were used to evaluate the antioxidant activity of acetone, ethanol, and methanol extracts of OF and OP.
MATERIALS AND METHODS
Materials
Orange (Citrus auranthium) was purchased from a local market in August 2011. The 3-(4,5-dimethylthiazol-2-yl)-2,5-diphenyltetrazolium bromide (MTT), Dulbecco’s Modified Eagle’s Medium (DMEM), and gallic acid were purchased from Sigma Chemical Co. (St. Louis, MO, USA). The lactate dehydrogenase (LDH) release assay kit was purchased from Wako Pure Chemical Industries, Ltd. (Osaka, Japan). Fetal bovine serum (FBS) and penicillin/streptomycin were purchased from Gibco BRL (Paisley, Scotland). All organic solvents and other chemicals were of analytical grade or complied with the standards needed for cell culture experiments.
Sample preparation
The OP was separated from the edible parts, slightly washed with tap water, air-dried completely for one day, and cut into approximately 1×1 cm pieces. Five grams of OF or OP was extracted with 100 mL of ethanol, methanol, or acetone for 72 h at 25°C. The extracts were filtered through Whatman No. 1 filter paper (Tokyo, Japan), and the extraction solvents were removed with an evaporator (Eyela N-1000, Tokyo Rikakikai Co., Tokyo, Japan). The OF and OP were redissolved in dimethyl sulfoxide (DMSO) to a concentration of 50 mg/mL and kept at 20°C until use.
Measurement of total phenolic content
The total phenolic content (TPC) of OF and OP was determined according to the method of Park et al. (15). Briefly, OF or OP was mixed with 2 mL of 1 N Folin-Ciocalteu reagent and incubated at 25°C. Then 2 mL of 10% Na2CO3 was added and the mixture was incubated at 25°C. The absorbance at 690 nm was measured with an enzyme-linked immunosorbent assay (ELISA) reader (Tecan Austria GmbH, Grödig, Austria). TPC is expressed as gallic acid equivalents (GAE).
Measurement of 2,2-diphenyl-1-picrylhydrazyl radical scavenging activity
The 2,2-diphenyl-1-picrylhydrazyl (DPPH) radical scavenging activity (RSA) was determined by the slightly modified method of Mensor et al. (16). Briefly, 80 μL of 0.2 mM DPPH ethanol solution was added to 20 μL of sample solution at different concentrations (50~1,000 μg/mL) and allowed to react at 25°C. The control consisted of 20 μL of DMSO and 80 μL of 0.2 mM DPPH. The mixtures were incubated at room temperature for 10 min and then the absorbance was measured by ELISA at 492 nm. The DPPH radical scavenging ability of each sample is expressed as the half maximal inhibitory concentration on DPPH free radicals (IC50).
Total radical-trapping antioxidant potential
Total radical-trapping antioxidant potential (TRAP) was measured by a modification of the photometric method described by Rice-Evans and Miller (17). Twenty microliter sample aliquots (50~1,000 μg/mL) were added to tubes containing phosphate buffered saline (PBS), 2.5 mM metmyoglobin, and 150 M 2,2′-azino-bis(3-ethyl-benzothiazoline-6-sulphonic acid) (ABTS) and then mixed by vortexing. The reaction was started by adding 250 μL of 75 μM H2O2, and the absorbance was measured at 734 nm using a spectrophotometer (UV-1601; Shimadzu, Tokyo, Japan). Values are expressed as estimation of the median effective dose (ED50).
Oxygen radical absorbance capacity assay
The oxygen radical absorbance capacity (ORAC) assay was carried out on a FLUOstar OPTIMA fluorescence plate reader (BMG LABTECH GmbH, Ortenberg, Germany) with fluorescent filters (excitation wavelength 485 nm, emission wavelength 535 nm) according to the method of Park et al. (15). The results were calculated based on the difference between the area under the fluorescence decay curves of the blank and each sample. ORAC peroxyl (ROO·) radical is expressed as μmol of Trolox equivalents (TE).
Cellular antioxidant activity assay
Cellular antioxidant activity (CAA) was evaluated according to the methods described by Ko et al. (18). HepG2 (ATCC 8065) cells were purchased from the American Type Culture Collection (ATCC, Rockville, MD, USA). The cells were maintained in DMEM supplemented with 10% heat-inactivated FBS, penicillin (100 U/mL), streptomycin (100 g/mL), and 2 mg/mL of NaHCO3 in a humidified, 37°C incubator with 5% CO2.
To measure cell viability, 1.0×10⁴ HepG2 cells/well were pre-incubated in a 96-well plate for 24 h and pre-treated with various concentrations (final concentration adjusted to 1 μg/mL, 10 μg/mL, 25 μg/mL, or 50 μg/mL) of the OF or OP solvent extracts. After incubation for 24 h, MTT reagent (5 mg/mL) was added to each well, and the plate was incubated for an additional 1 h at 37°C. At the end of the incubation period, the media were removed, and the intracellular formazan product was dissolved in 100 μL of DMSO. The absorbance of each well was measured at 540 nm using an ELISA reader (Tecan Austria GmbH), and the MTT reduction rate was calculated by setting the survival rate of each of the control samples to 100%.
To measure CAA, HepG2 cells were cultured in 96-well plates (5×10⁵ cells/mL) for 24 h. Then, the cells were incubated with different concentrations of OF or OP in DMSO (final DMSO concentration <1%) for 30 min, the wells were washed with 100 μL of PBS, and the cells were treated with 80 μM of 2,2′-azobis-2-methyl-prop-animidamide, dihydrochloride (AAPH) in 100 μL of PBS containing 40 μM dichlorodihydrofluorescein diacetate (DCFH-DA). Then, the 96-well microplate was placed into a FLUOstar OPTIMA fluorescence plate reader at 37.8°C. Emission at 535 nm was measured with excitation at 485 nm. Triplicate control and blank wells were included on each plate: control wells contained cells treated with DCFH-DA and an oxidant, AAPH; blank wells contained cells treated with PBS that did not contain AAPH.
DNA damage determination by alkaline comet assay
The antigenotoxic effect of OF and OP on human leukocytes was measured using the alkaline comet assay (19). Peripheral venous blood was collected in heparinized vials from 3 healthy male donors with no history of smoking/drinking or chronic use of medication. The donors gave written consent to participate in the study after being informed of its purpose, nature, and potential risks. Leukocytes were isolated from the blood and incubated with varying concentrations of OF or OP extracts prepared with the different extraction solvents for 30 min at 37°C. The cells were then re-suspended in PBS containing 200 μM H2O2 for 5 min on ice to stimulate oxidative damage.
After each treatment, the leukocytes were centrifuged at 500 g for 5 min and washed with PBS. DMSO (1%) without H2O2 was used as the negative control (NC). After treatment, the leukocytes were mixed with 75 μL of 0.7% low melting agarose, and added to slides that had been pre-coated with 0.5% agarose. The slides were then immersed in lysis solution [2.5 M NaCl, 100 mM ethylenediaminetetraacetic acid (EDTA), 10 mM Tris, 1% sodium laurylasarcosine, 1% Triton X-100, and 10% DMSO] for 1 h at 4°C. Thereafter, the slides were placed in an electrophoresis tank containing 300 mM NaOH and 10 mM Na2EDTA (pH 13.0) for 20 min. To electrophorese the DNA, an electric current of 25 V and 300±3 mA was applied to the electrophoresis tank for 20 min at 4°C. The slides were then washed three times with a neutralizing buffer (0.4 M Tris, pH 7.5) for 5 min at 4°C, and then treated with ethanol for 5 min. The slides were stained with 20 μL of 20 μg/mL ethidium bromide, and the percentage of fluorescence in the tail (i.e., tail intensity; measured for 50 cells from each of 2 replicate slides) was measured with image analysis (Komet version 5.0, Kinetic Imaging Ltd., Liverpool, UK) and fluorescence microscopy (LEICA DM LB, Bensheim, Germany).
Statistical analysis
The SPSS package for Windows version 14.0 (SPSS Inc., Chicago, IL, USA) was used to perform the statistical analysis. One-way analysis of variance (ANOVA) followed by Duncan’s multiple range tests were used to compare the mean values. P values less than 0.05 were considered significant. Pearson’s correlation coefficient was used to do determine correlations.
RESULTS AND DISCUSSION
Each in vitro antioxidant assay performed in this study evaluated the antioxidant activity of samples via a different mechanism (20). The TPC and DPPH methods are based on a single electron transfer (SET) reaction in which antioxidants are oxidized by oxidants, such as the DPPH radical. As a result, a single electron is transferred from the antioxidant molecule to the oxidant. In contrast, the ORAC and TRAP assays are based on a hydrogen atom transfer (HAT) reaction. In this type of reaction, a HAT is transferred after a peroxyl radical, ROO·, has been generated in which this radical extracts a hydrogen atom from the antioxidant compounds (19,20). The CAA and comet assays serve as a way to monitor oxidative stress in cells; they take into account the cellular uptake, distribution, and metabolism of antioxidants (21). According to Wolfe and Liu (22), the CAA assay is better correlated with in vivo conditions than pure chemical assays. Therefore, the antioxidant activity of OF and OP that had been extracted with various solvents (i.e., ethanol, methanol, and acetone) was evaluated using a range of antioxidant tests, including the TPC, DPPH RSA, TRAP, ORAC, CAA, and the comet assay.
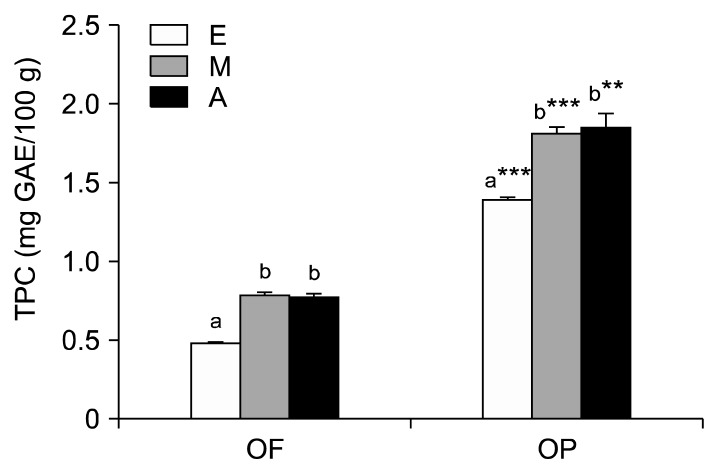
The TPC of OP was significantly higher than that of OF (Fig. 1). The TPC of OP ranged from 1.39 mg GAE/100 g to 1.85 mg GAE/100 g, while the TPC of OF ranged from 0.48 mg GAE/100 g to 0.79 mg GAE/100 g. Methanol and acetone extracted more phenolic compounds from OF and OP than ethanol. The extraction of polyphenols from plant material is influenced by the solubility of the phenolic compounds in the solvent used for the extraction process. Furthermore, solvent polarity plays a key role in increasing the phenolic content (23) of extracts. Jimenez et al. (24) reported that the acetone extract of capulin cherries has the highest polyphenol concentrations, followed by the ethanol and methanol extracts; these solvents possess high reactivity, which permits them to act as hydrogen or electron donors. It has also been reported that various anthocyanins and flavonoids (mainly cyanidin 3-glucoside and cyanidin 3-rutinoside) are present in capulin cherry samples extracted with acetone, which probably explains the anti-oxidant activity of capulin cherry samples. In the present study, the high TPC observed in the acetone and methanol extracts may be due to the presence of flavonoids in OF and OP. Jayaprakasha and Patil (25) reported that the methanol and acetone extracts of blood oranges contain flavonoids, flavonoid glucosides, and limonoids.
Fig. 1.
Total phenolic content of orange fruit (OF) and orange peel (OP) extracted with organic solvents. E, ethanol; M, methanol; A, acetone. Values are mean with standard deviation. Values not sharing the same letter within OF or OP are significantly different from one another (P<0.05) by Duncan’s multiple range test. **P<0.01, ***P<0.001 significantly different between fruit and peel extract by Student t-test.
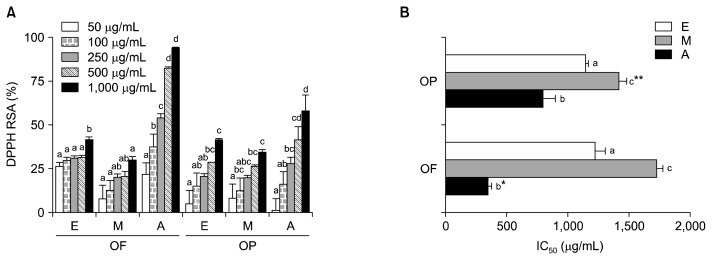
The OF and OP quenched DPPH in a dose-dependent manner, regardless of the orange part or extraction solvent used (Fig. 2A). The IC50 values (i.e., the concentration of sample required to scavenge 50% of the free radical content) were lowest in the acetone extracts of OF (333.7 μg/mL) and OP (781.9 μg/mL), followed by the ethanol extracts (OF, 1,212.5 μg/mL; OP, 1,137.9 μg/mL) and the methanol extracts (OF, 1,710.2 μg/mL; OP, 1,402.9 μg/mL) (Fig. 2B). A lower IC50 value indicates more potent antioxidant activity. For the acetone extracts, the IC50 value of the OF extract was significantly lower than that of the OP extract, while this relationship was reversed for the methanol extracts. There was no statistically significant difference between the DPPH RSA IC50 values of the OF ethanol extracts and the OP ethanol extracts. Although the TPC of the OP extracts was higher than the TPC of the OF extracts, the DPPH RSA was strongest in the acetone extracts of OF. The TPC assay has been criticized for its poor specificity and because its results can be influenced by any substance that can be oxidized by the Folin reagent, not just polyphenols (26,27). Others have suggested that non-phenolic substances may also contribute to the anti-oxidant activity of a sample (28). Synergistic effects and other substances, such as vitamin C, carotenoids, and pigments, may have contributed to the DPPH RSA of the OF and OP extracts (29). The observed lack of a relationship between an extract’s constituents and its effects is in agreement with Anagnostopoulou et al. (30), who reported an r2 value of 0.42 for the relationship between the TPC and DPPH results obtained for a sweet orange peel extract. In our study, the correlation coefficient for the TPC and DPPH RSA IC50 values was low (r=−0.207).
Fig. 2.
DPPH radical scavenging activity (A) and IC50 (B) of orange fruit (OF) and orange peel (OP), when extracted various solvents. E, ethanol; M, methanol; A, acetone. IC50: concentration for scavenging 50% DPPH radical. Values are mean with standard deviation. Values not sharing the same letter within OF or OP are significantly different from one another (P<0.05) by Duncan’s multiple range test. *P<0.05, **P<0.01 significantly different between fruit and peel extract by Student t-test.
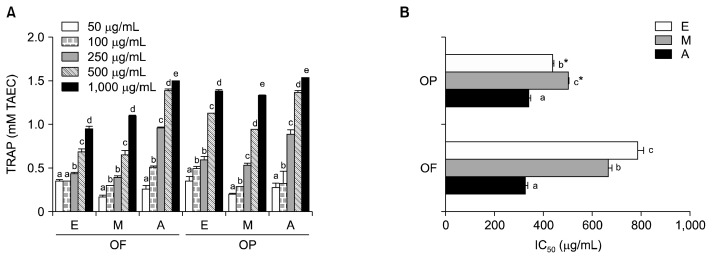
TRAP was affected by OF and OP in a dose-dependent manner, regardless of the orange part or extraction solvent used (Fig. 3A). Acetone extracts of OF and OP had the highest TRAP values (Fig. 3B). There was not a significant difference between the IC50 values of the OF extracted with acetone (326.0 μg/mL) and OP extracted with acetone (340.2 μg/mL). The TRAP values of the ethanol and methanol extracts of OP were significantly higher than the ethanol and methanol extracts of OF.
Fig. 3.
Antioxidant activity effect (A) and IC50 (B) of different solvent extracts from orange fruit (OF) and orange peel (OP) on total radical trapping antioxidant potential (TRAP). E, ethanol; M, methanol; A, acetone. IC50: concentration for scavenging 50% of ABTS radicals. Values are mean with standard deviation. Values not sharing the same letter within OF or OP are significantly different from one another (P<0.05) by Duncan’s multiple range test. *P<0.05 significantly different between fruit and peel extract by Student t-test.
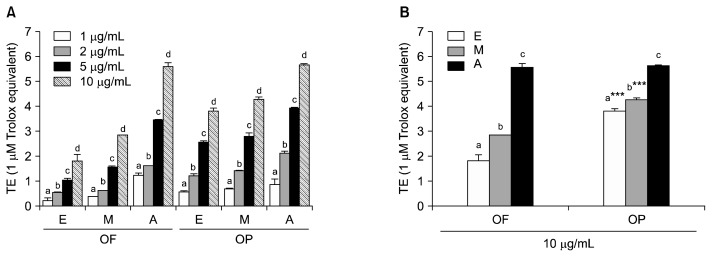
Similar results were found for the ORAC assay. The OF and OP extracts possessed significant free radical scavenging capabilities and inhibited fluorescein decay in a dose-dependent manner (Fig. 4A). At the 10 μg/mL concentration, the highest ROO· scavenging activity was observed in the acetone extracts of OF and OP, followed by the methanol and ethanol extracts of OF and OP (Fig. 4B). There was no significant difference between the ORAC values of the OF acetone extract (5.57 μM TE) and the OP acetone extract (5.65 μM TE). The ORAC values of the OP ethanol and methanol extracts were higher than those of the OF extracts. There was a positive correlation between the ORAC and TPC values (r=0.471, P<0.05) of the present study. ORAC values were also correlated with the IC50 values of DPPH RSA (r=−0.710, P<0.01).
Fig. 4.
Oxygen radical absorbance capacity (ORAC) values (A) at 1, 2, 5, and 10 μg/mL of different solvent extracts from orange fruit (OF) and orange peel (OP) and at 10 μg/mL of each extracts. E, ethanol; M, methanol; A, acetone. Values are mean with standard deviation. Values not sharing the same letter within OF or OP are significantly different from one another (P<0.05) by Duncan’s multiple range test. ***P<0.001 significantly different between fruit and peel extract by Student t-test.
In the current study, the most potent antioxidant activities were observed for the OP extracts. This result is in agreement with that of Gorinstein et al. (31), who reported that extracts from the peel of the orange has good antioxidant activity. For all assays except the DPPH RSA assay, the maximum antioxidant activity was observed in the acetone extracts. Jayaprakasha et al. (32) reported that the rank order of the navel orange extract antioxidant capacity is: ethyl acetate> acetone> methanol : water> methanol> hexane. It seemed that the antioxidant capacity of the extracts corresponded to the amount of phenolic compounds and lycopene present in each fraction, and that the extracts might be a good source of antioxidants. Therefore, phenolic compounds and lycopene were likely the main mediators of the antioxidant activity of OP and OF extracts.
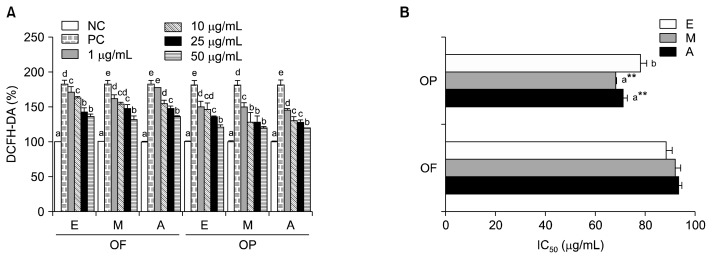
HepG2 cells were supplemented with or without increasing concentrations (i.e., 1~50 μg/mL) of acetone, ethanol, or methanol extracts of OF or OP for 24 h. Following incubation, the effects of the OF and OP extracts on cell viability were assessed using the neutral violet uptake assay. Cell viability in the control and treatment groups was greater than 75% for all experiments (data not shown). The CAA of different concentrations (i.e., 1 μg/mL, 10 μg/mL, 25 μg/mL, and 50 μg/mL) of the extracts against peroxyl radical-induced oxidation of HepG2 cells (Fig. 5A) was evaluated. CAA was observed for all of the concentrations and extracts tested. The CAA of the methanol and acetone extracts of OP was higher than that of the ethanol extract of OP, while the CAA of the OF extracts was not affected by solvent type (Fig. 5B). The CAA of the OP extracts was significantly higher than the CAA the OF extracts. The CAA of the methanol extract (68.2 μg/mL) and the acetone extract (71.1 μg/mL) from OP was higher than those measured for OF (methanol, 91.8 μg/mL; acetone, 93.1 μg/mL). The results of the CAA assay indicate that the antioxidant activity of the acetone and methanol extracts is stronger than that of the ethanol extracts. Huang et al. (21) reported that high TPC is significantly associated with high CAA because of more phenolics which can help protect the cell from damage. The CAA assay constitutes a new approach for the determination of anti-oxidant activity that takes the phenolic bioactivity of samples into account (22).
Fig. 5.
Cellular antioxidant activity (A) and IC50 (B) of different solvent extracts from orange fruit (OF) and orange peel (OP). E, ethanol; M, methanol; A, acetone. IC50: concentration for scavenging 50% of AAPH radicals. Values are mean with standard deviation. Values not sharing the same letter within OF or OP are significantly different from one another (P<0.05) by Duncan’s multiple range test. *P<0.05 significantly different between fruit and peel extract by Student t-test.
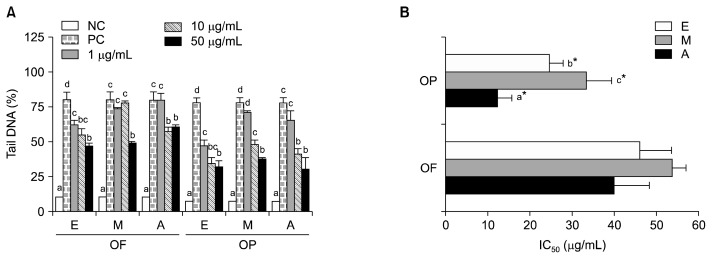
The comet assay has been used to measure the protective effects of polyphenol compounds from foods against the oxidative DNA damage that occurs through metal chelation and reactive oxygen species (ROS) and reactive nitrogen species (RNS) scavenging (33). Human leukocytes were pre-incubated with or without various concentrations (i.e., 1 μg/mL, 10 μg/mL, and 50 μg/mL) of acetone, ethanol, or methanol extracts of OF or OP for 30 min prior to exposure to 200 μM H2O2 on ice for 5 min. In this study, the H2O2-induced DNA damage of human leukocytes that had been pre-treated with a 50 μg/mL concentration of OP or OF extract was significantly lower than that of cells treated with H2O2, alone (Fig. 6A). For all of the extracts tested, the maximum protective effect of the leukocyte pretreatment was produced by pretreatment with the 50 μg/mL doses. The results of the tail DNA% measurements demonstrated that the acetone extract of the OP produced a level of protection against H2O2 exposure that was significantly greater than that of extracts produced with other solvents (Fig. 6B). At their respective IC50 values, the inhibitory effect of OP against H2O2-induced DNA damage was significantly stronger than that of OF. The acetone extracts had the strongest antioxidant activity and were the most effective extracts against H2O2-induced single-strand DNA breaks in human leukocytes, indicating that they contained polyphenol compounds.
Fig. 6.
Effect of supplementation with different solvent extracts from orange fruit (OF) and orange peel (OP) on H2O2-induced DNA damage in human leukocytes (A) and IC50 (B). E, ethanol; M, methanol; A, acetone. NC, DMSO-treated normal control; PC, 200 μM H2O2-treated positive control. IC50: concentration for scavenging 50% H2O2 radical. Values are mean with standard error. Values not sharing the same letter within OF or OP are significantly different from one another (P<0.05) by Duncan’s multiple range test. *P<0.05 significantly different between fruit and peel extract by Student t-test.
The results of this study showed the TPC and anti-oxidant activities of ethanol, methanol, and acetone extracts of OF and OP. The acetone extracts of OP were rich in phenolics and had strong antioxidant activity and radical-scavenging action in all of the reported assays (i.e., TRAP, ORAC, CAA, and comet assays), except the DPPH RSA assay. Therefore, acetone is the best solvent for the extraction of antioxidant compounds from OF and OP. Furthermore, the OP, which is a waste product of the orange, is rich in antioxidants and may have practical applications in the food industry.
ACKNOWLEDGEMENT
This study was supported by the Kyungnam University Research Fund, 2014.
Footnotes
AUTHOR DISCLOSURE STATEMENT
The authors declare no conflict of interest.
REFERENCES
- 1.Jayaprakasha GK, Girennavar B, Patil BS. Antioxidant capacity of pummelo and navel oranges: extraction efficiency of solvents in sequence. LWT–Food Sci Technol. 2008;41:376–384. doi: 10.1016/j.lwt.2007.03.017. [DOI] [Google Scholar]
- 2.Senevirathne M, Kim SH, Siriwardhana N, Ha JH, Lee KW, Jeon YJ. Antioxidant potential of Ecklonia cava on reactive oxygen species scavenging, metal chelating, reducing power and lipid peroxidation inhibition. Food Sci Technol Int. 2006;12:27–38. doi: 10.1177/1082013206062422. [DOI] [Google Scholar]
- 3.Kaur C, Kapoor HC. Antioxidants in fruits and vegetables-the millennium’s health. Int J Food Sci Technol. 2001;36:703–725. doi: 10.1046/j.1365-2621.2001.00513.x. [DOI] [Google Scholar]
- 4.Vinson JA, Su X, Zubik L, Bose P. Phenol antioxidant quantity and quality in foods: fruits. J Agric Food Chem. 2001;49:5315–5321. doi: 10.1021/jf0009293. [DOI] [PubMed] [Google Scholar]
- 5.Klimczak I, Małecka M, Szlachta M, Gliszczyńska-Świgło A. Effect of storage on the content of polyphenols, vitamin C and the antioxidant activity of orange juices. J Food Compos Anal. 2007;20:313–322. doi: 10.1016/j.jfca.2006.02.012. [DOI] [Google Scholar]
- 6.Korea Agency of Education, Promotion and Information Service in Food, Agriculture, Forestry and Fisheries (EPIS) New paradigm in fruit consumption. 2013. [accessed Jul 2014]. www.epis.or.kr/community/show.do;jsessionid=12EEDB77570159019321ED03FF26462F?boardId=BOARDID_000000000039&menuNo=2000000008&seq=9777.
- 7.Emim JA, Oliveira AB, Lapa AJ. Pharmacological evaluation of the anti-inflammatory activity of Citrus bioflavonoid, hesperidin, and the isoflavonoids, duartin and claussequinone, in rats and mice. J Pharm Pharmacol. 1994;46:118–122. doi: 10.1111/j.2042-7158.1994.tb03753.x. [DOI] [PubMed] [Google Scholar]
- 8.Monforte MT, Trovato A, Kirjavainen S, Forestieri AM, Galati EM, Lo Curto RB. Biological effects of hesperidin, a citrus flavonoid. (note II): hypolipidemic activity on experimental hypercholesterolemia in rat. Farmaco. 1995;50:595–599. [PubMed] [Google Scholar]
- 9.Galati EM, Monforte MT, Kirjavainen S, Forestieri AM, Trovato A, Tripodo MM. Biological effects of hesperidin, a citrus flavonoid. (note I): antiinflammatory and analgesic activity. Farmaco. 1994;49:709–712. [PubMed] [Google Scholar]
- 10.Galati EM, Trovato A, Kirjavainen S, Forestieri AM, Rossitto A, Monforte MT. Biological effects of hesperidin, a citrus flavonoid. (Note III): antihypertensive and diuretic activity in rat. Farmaco. 1996;51:219–221. [PubMed] [Google Scholar]
- 11.Oyanagui Y. Reevaluation of assay methods and establishment of kit for superoxide dismutase activity. Anal Biochem. 1984;142:290–296. doi: 10.1016/0003-2697(84)90467-6. [DOI] [PubMed] [Google Scholar]
- 12.Kondo S, Tsuda K, Muto N, Ueda J. Antioxidative activity of apple skin or flesh extracts associated with fruit development on selected apple cultivars. Sci Hortic. 2002;96:177–185. doi: 10.1016/S0304-4238(02)00127-9. [DOI] [Google Scholar]
- 13.Pellegrini N, Colombi B, Salvatore S, Brenna OV, Galaverna G, Del Rio D, Bianchi M, Bennett RN, Brighenti F. Evaluation of antioxidant capacity of some fruit and vegetable foods: Efficiency of extraction of a sequence of solvents. J Sci Food Agric. 2007;87:103–111. doi: 10.1002/jsfa.2682. [DOI] [Google Scholar]
- 14.Prior RL, Wu X, Schaich K. Standardized methods for the determination of antioxidant capacity and phenolics in foods and dietary supplements. J Agric Food Chem. 2005;53:4290–4302. doi: 10.1021/jf0502698. [DOI] [PubMed] [Google Scholar]
- 15.Park JH, Kim RY, Park E. Antioxidant and α-glucosidase inhibitory activities of different solvent extracts of skullcap (Scutellaria baicalensis) Food Sci Biotechnol. 2011;20:1107–1112. doi: 10.1007/s10068-011-0150-2. [DOI] [Google Scholar]
- 16.Mensor LL, Menezes FS, Leitão GG, Reis AS, dos Santos TC, Coube CS, Leitão SG. Screening of Brazilian plant extracts for antioxidant activity by the use of DPPH free radical method. Phytother Res. 2001;15:127–130. doi: 10.1002/ptr.687. [DOI] [PubMed] [Google Scholar]
- 17.Rice-Evans C, Miller NJ. Total antioxidant status in plasma and body fluids. Methods Enzymol. 1994;234:279–293. doi: 10.1016/0076-6879(94)34095-1. [DOI] [PubMed] [Google Scholar]
- 18.Ko SH, Park JH, Kim SY, Lee SW, Chun SS, Park E. Antioxidant effects of spinach (Spinacia oleracea L.) supplementation in hyperlipidemic rats. Prev Nutr Food Sci. 2014;19:19–26. doi: 10.3746/pnf.2014.19.1.019. [DOI] [PMC free article] [PubMed] [Google Scholar]
- 19.Park JH, Seo BY, Lee KH, Park E. Onion supplementation inhibits lipid peroxidation and leukocyte DNA damage due to oxidative stress in high fat-cholesterol fed male rats. Food Sci Biotechnol. 2009;18:179–184. [Google Scholar]
- 20.Nurul MAA, Shafik H, Maria AP, Maria GG. Solvent effect on antioxidant activity and total phenolic content of Betula alba and Convolvulus arvensis. Int J Biol Veterinary Agric Food Eng. 2013;7:152–157. [Google Scholar]
- 21.Huang H, Sun Y, Lou S, Li H, Ye X. In vitro digestion combined with cellular assay to determine the antioxidant activity in Chinese bayberry (Myrica rubra Sieb. et Zucc.) fruits: a comparison with traditional methods. Food Chem. 2014;146:363–370. doi: 10.1016/j.foodchem.2013.09.071. [DOI] [PubMed] [Google Scholar]
- 22.Wolfe KL, Liu RH. Cellular antioxidant activity (CAA) assay for assessing antioxidants, foods, and dietary supplements. J Agric Food Chem. 2007;55:8896–8907. doi: 10.1021/jf0715166. [DOI] [PubMed] [Google Scholar]
- 23.Naczk M, Shahidi F. Phenolics in cereals, fruits and vegetables: occurrence, extraction and analysis. J Pharm Biomed Anal. 2006;41:1523–1542. doi: 10.1016/j.jpba.2006.04.002. [DOI] [PubMed] [Google Scholar]
- 24.Jimenez M, Castillo I, Azuara E, Beristain CI. Antioxidant and antimicrobial activity of capulin (Prunus serotina subsp capuli) extracts. Rev Mex Ing Quím. 2011;10:29–37. [Google Scholar]
- 25.Jayaprakasha GK, Patil BS. In vitro evaluation of the antioxidant activities in fruit extracts from citron and blood orange. Food Chem. 2007;101:410–418. doi: 10.1016/j.foodchem.2005.12.038. [DOI] [Google Scholar]
- 26.Escarpa A, González MC. Approach to the content of total extractable phenolic compounds from different food samples by comparison of chromatographic and spectrophotometric methods. Anal Chim Acta. 2001;427:119–127. doi: 10.1016/S0003-2670(00)01188-0. [DOI] [Google Scholar]
- 27.Singleton VL, Orthofer R, Lamuela-Raventós RM. Analysis of total phenols and other oxidation substrates and antioxidants by means of Folin-Ciocalteu reagent. Methods Enzymol. 1999;29:152–178. doi: 10.1016/S0076-6879(99)99017-1. [DOI] [Google Scholar]
- 28.de Oliveira AMF, Pinheiro LS, Pereira CKS, Matias WN, Gomes RA, Chaves OS, de Souza MFV, de Almeida RN, de Assis TS. Total phenolic content and antioxidant activity of some Malvaceae family species. Antioxidants. 2012;1:33–43. doi: 10.3390/antiox1010033. [DOI] [PMC free article] [PubMed] [Google Scholar]
- 29.Babbar N, Oberoi HS, Uppal DS, Patil RT. Total phenolic content and antioxidant capacity of extracts obtained from six important fruit residues. Food Res Int. 2011;44:391–396. doi: 10.1016/j.foodres.2010.10.001. [DOI] [Google Scholar]
- 30.Anagnostopoulou MA, Kefalas P, Papageorgiou VP, Assimopoulou AN, Boskou D. Radical scavenging activity of various extracts and fractions of sweet orange peel (Citrus sinensis) Food Chem. 2006;94:19–25. doi: 10.1016/j.foodchem.2004.09.047. [DOI] [Google Scholar]
- 31.Gorinstein S, Martín-Belloso O, Park YS, Haruenkit R, Lojek A, Ĉíž M, Caspi A, Libman I, Trakhtenberg S. Comparison of some biochemical characteristics of different citrus fruits. Food Chem. 2001;74:309–315. doi: 10.1016/S0308-8146(01)00157-1. [DOI] [Google Scholar]
- 32.Jayaprakasha GK, Wilson C, Patil BS. Phenolics and carotenoids contribute to antioxidant activity in navel orange. Oral session 25 presented at 103rd Annual International Conference of the American Society for Horticultural Science; New Orleans, LA, USA. 2006. [Google Scholar]
- 33.Lin KH, Yang YY, Yang CM, Huang MY, Lo HF, Liu KC, Lin HS, Chao PY. Antioxidant activity of herbaceous plant extracts protect against hydrogen peroxide-induced DNA damage in human lymphocytes. BMC Res Notes. 2013;6:490. doi: 10.1186/1756-0500-6-490. [DOI] [PMC free article] [PubMed] [Google Scholar]


