

Abstract
In this study, we developed a method to quantify esculetin (6,7-dihydroxycoumarin) in plasma and tissues using HPLC coupled with ultraviolet detection and measured the level of esculetin in rat plasma after oral administration. The calibration curve for esculetin was linear in the range of 4.8 ng/mL to 476.2 ng/mL, with a correlation coefficient (r2) of 0.996, a limit of detection value of 33.2 ng/mL, and a limit of quantification value of 100.6 ng/mL. Recovery rates for the 95.2 ng/mL and 190.5 ng/mL samples were 95.2% and 100.3%, within-runs and 104.8% and 101.0% between-runs, respectively. The relative standard deviation was less than 7% for both runs. In the pharmacokinetic analysis, the peak plasma esculetin level was reached 5 min after administration (Cmax=173.3 ng/mL; T1/2=45 min; AUC0 ~180 min=5,167.5 ng · min/mL). At 180 min post-administration (i.e., after euthanasia), esculetin was only detectable in the liver (30.87±11.33 ng/g) and the kidney (20.29±7.02 ng/g).
Keywords: esculetin, plasma, HPLC, pharmacokinetics
INTRODUCTION
Esculetin (6,7-dihydroxycoumarin), one of the main active compounds in the bark of Cortex fraxini, is used traditionally in herbal medicines to alleviate fever and pain (1). Esculetin has been shown to inhibit lipoxygenase activity (2), inhibit platelet aggregation (3), and act as a radical scavenger (4). Recently, esculetin was reported to induce apoptosis of human leukemia HL-60 cells (5) and U937 cells (6). It has also been reported to have anti-inflammatory activity in the trinitrobenzenesulfonic acid model of rat colitis (7). In addition, Lee et al. (8) reported that esculetin suppressed the proliferation of human colon cancer cells by directly targeting β-catenin.
Only a few studies have quantified esculetin in different matrices. Schimmer and Eschelbach (9) detected esculetin for the first time in an alchemilla species using gas chromatography mass spectrometry (GC/MS). Zhou et al. (1) analyzed coumarin derivatives from plants by HPLC-DAD-ESI-MS, and Tsai et al. (10) measured esculetin in rat blood collected by microdialysis. However, an increased attention on esculetin as pharmaceutical and nutraceutical agent has highlighted the need to develop better methods for the quantitative assessment of esculetin in biofluids. Recently, nutrigenomics assessing the interaction between genes and nutrients are interested, and convergence with metabolomics based on analytical technique is also focused for the deep understanding about interaction of nutrient and gene (11).
The aim of this study was to detect esculetin in the plasma and tissues of rats after oral administration of esculetin. To ensure that esculetin was accurately measured, we developed and validated an HPLC method for the quantification of esculetin and identified esculetin using time of flight mass spectrometry (TOF/MS/MS).
MATERIALS AND METHODS
Chemicals
Esculetin and 7-amino-4-methylcoumarin (Fig. 1), which was used as an internal standard (IS), were purchased from Sigma Chemical Co. (St. Louis, MO, USA), stored at −20°C, and protected from light until use. Methanol and acetonitrile (HPLC grade) were purchased from J.T. Baker (Phillipsburg, NJ, USA). All other solvents were purchased from Sigma Chemical Co.
Fig. 1.
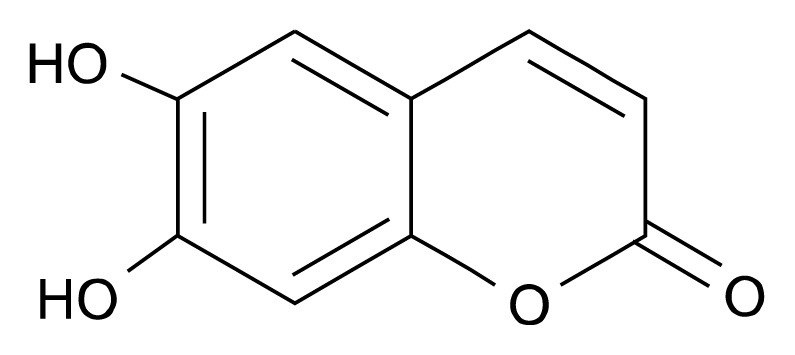
Structure of esculetin.
Animals
Sprague-Dawley (SD) rats (male, 310 g to 340 g, n=25) were purchased from Orient Bio, Inc. (Seongnam, Korea). All animal experiments were carried out in accordance with the guidelines of the Korea Food Research Institutional Animal Care and Use Committee (Seongnam, Korea). For 3 days prior to the start of the experiment, the rats were housed in an environmentally controlled breeding room (temperature: 25±2°C, humidity: 60± 5%, 12-h dark/light cycle) with ad libitum access to standard laboratory chow and water. Prior to the start of the experiment, the rats were fasted overnight.
The 25 rats were divided into two groups. The rats in Group I (n=10) were euthanized and their blood was collected in heparinized tubes, centrifuged at 1,400 g for 10 min, and then stored at −80°C until use. The blood from the rats in Group I was used for method validation. The rats in Group II (n=15) were used for the investigation of plasma and tissue levels of esculetin after oral administration. Following an overnight fast, the rats in Group II were dosed orally with corn oil (vehicle, n=6) or esculetin (25 mg/kg body weight) in corn oil (n=9). Blood samples were collected from the suborbital vein at 5, 10, 15, 30, 60, 90, 120, and 180 min after dosing. After the last plasma collection, the rats were euthanized, and the liver, kidney, muscle, heart, lung, brain, testis, thymus, brown fat, and epididymal adipose tissues were dissected, immediately frozen in liquid nitrogen, and stored at −70°C until esculetin measurement.
Sample preparation
A liquid-liquid extraction procedure was used to extract esculetin from the plasma and tissue samples. For the plasma samples, a mixture of 450 μL plasma, 50 μL methanol, and 25 μL IS (500 ng/mL) was vortexed for 30 s. To extract the esculetin from this mixture, 1 mL diethyl ether was added, and the resulting mixture was mixed for 10 min, centrifuged for 2 min at 2,000 g, and then the supernatant was collected. This procedure was repeated three times, and the supernatants were combined, evaporated to dryness under N2 gas, and reconstituted with 100 μL methanol. Each tissue sample (100 mg) was homogenized with five volumes of citrate buffer (25 mM, pH 5.0) using a FAST Prep-24 homogenization system (MP Biomedicals, Seven Hills, NSW, Australia) for 30 s at 5.5 m/s. Tissue homogenates (450 μL) were vortexed for 30 s with 50 μL methanol and 25 μL IS. The mixture was extracted three times with 1 mL diethyl ether. Diethyl ether layers were combined and evaporated to dryness under N2 gas, and the residue was reconstituted in an equivalent volume (100 μL) of carefully stabilized methanol.
LC conditions
We used an HPLC system (Jasco, Tokyo, Japan) equipped with a pump (PU-2089), column oven (CO-2065), 20 μL loop, and UV detector (UV-2075). An XTerra RP 18 column (4.6×150 mm, 5 μm particle size; Waters, MA, USA) was used for the separation of esculetin. The mobile phase consisted of 20 mM phosphate buffer (pH 2.5) and acetonitrile (85:15, v/v), the flow rate was 1.2 mL/min, and the detection wavelength was 342 nm. The column oven and auto-sampler were maintained at 35°C and 4°C, respectively, and sample injection volume was 20 μL.
TOF/MS/MS conditions
The MS detection was performed on an LCT Premier TOF mass spectrometer (Waters) equipped with an electrospray ionization (ESI) source and lock spray interface for accurate mass measurements with a MassLynx™ data analysis system (Waters). The scan range was from 100 m/z to 1,000 m/z. The MS source parameters were set as follows: capillary voltage, 2.7 kV; cone voltage, 40 V. The desolvation and source temperatures were set at 300°C and 110°C, respectively, and the nebulizer gas flow was set to 700 L/h. The lock spray was used for all analyses to ensure accuracy and reproducibility. A 1 μg/mL solution of leucine-enkephalin set to a flow rate of 10 μg/min was used as the lock mass. The lock mass attenuated ion (m/z 556.2771) was used in positive ionization mode. Systematic data acquisition was performed in positive centroid mode (i.e., W analyzer mode), the lock spray frequency was set at 5 s, and the lock-mass data was averaged over a 10 s scan for correction.
Method validation
The linearity of calibration, recovery, precision, and accuracy were calculated to validate the HPLC method. To evaluate the linearity of sample detection, calibration curves were constructed with triplicate measurements of the concentration of esculetin in three independent batches of plasma spiked with 10 different concentrations of esculetin (range: 4.8 ng/mL to 476.2 ng/mL) and the IS (500 ng/mL). The standard curve was constructed using the weighted (1/X) linear regression of the peak area of esculetin versus the corresponding nominal plasma concentration of esculetin (X, ng/mL). To validate the recovery, precision, and accuracy of the analytical method, within-run (n=4) and between-run (4 days) analyses were performed using blank plasma spiked with 95.2 ng/mL and 190.5 ng/mL of esculetin. The results were assessed by calculating the relative standard deviations (RSDs). The standard deviation and slope of the calibration curve were used to calculate the limit of detection (LOD) and the limit of quantification (LOQ).
Plasma and tissue distribution
To determine the pharmacokinetic distribution of esculetin in the plasma, the area under the curve (AUC), maximum plasma concentration (Cmax), time to peak (Tmax), and half-life (T1/2) were calculated by the non-compartmental PK functions for Microsoft Excel. The AUC was analyzed by comparing the plasma esculetin concentration to the time course. Cmax and Tmax were obtained directly from the plasma concentration-time plots and used to calculate T1/2.
Statistical analysis
For each sample, the esculetin concentration was measured in triplicate. The pharmacokinetic parameters were calculated using Sigma Plot 9.0 (Systat Software Inc., San Jose, CA, USA). All data are presented as mean± standard deviation (SD). Statistical analysis was carried out using the SAS System (version 8, SAS Institute Inc., Cary, NC, USA).
RESULTS
Esculetin identification and method validation
Plasma esculetin was identified by HPLC. An XTerra RP 18 column, 85% acetonitrile (pH 2.5), and a UV detector set to 342 nm were used for this analysis. The esculetin peak was eluted through the column at 4.2 min. For the MS and MS/MS analyses, 0.1% formic acid was added to the water mobile phase to improve the ionization efficiency and the peak shape. The spectra of esculetin (MW=178.14) are shown in Fig. 2. The most abundant fragmentation ion observed in the positive mode MS spectra of esculetin was m/z 179.0338, corresponding to the protonated esculetin ion. In the MS/MS analysis, we found a successive loss of CO, corresponding to the [M+H−CO]+ m/z 151.0392 and [M+H−2CO]+ m/z 123.0443 fragment ions and the [M+H−H2O−CO]+ m/z 133.0287 fragment ion.
Fig. 2.

Typical MS spectra and HPLC-UV chromatogram (A) and (+) ESI-MS/MS fragmentation ions (collision energy=18 volts) (B) of esculetin.
To validate the analytical method, we compared the calibration curves generated with organic solvent to those from blank plasma; this allowed us to assess the potential endogenous interference from the biofluid matrix. There were no significant differences between the calibration curves generated with organic solvent and the calibration curves generated with blank plasma. The calibration curves were linear in the range of 4.8~476.2 ng/mL, the mean regression equation of the calibration curves was y=235.92x+978.5, and the linearity of the curves was good (r2=0.996). The LOD and LOQ values were 33.2 ng/mL and 100.6 ng/mL, respectively (Table 1). The precision and accuracy of the analytical method were assessed by the quantification of esculetin in rat plasma that had been spiked with nominal concentrations (95.2 ng/mL and 190.5 ng/mL) of esculetin. The within-run recovery rates for the 95.2 ng/mL and 190.5 ng/mL samples were 95.2% and 100.3%, respectively, and the between-run recovery rates were 104.8% and 101.0%, respectively. The RSD was less than 7% for both runs (Table 2). These results indicate that the analytical method used in this study is very accurate and is reproducible for the measurement of trace amounts of plasma esculetin.
Table 1.
Calibration parameters for plasma samples containing esculetin
| Compound | Regression equation | R2 | Linear range (ng/mL) | LOD1) (ng/mL) | LOQ2) (ng/mL) |
|---|---|---|---|---|---|
| Esculetin | y=235.92x+978.5 | 0.996 | 4.8~476.2 | 33.2 | 100.6 |
LOD: limit of detection.
LOQ: limit of quantification.
Table 2.
Precision and accuracy for esculetin determination in rat plasma
| Compound | Nominal conc. (ng/mL) | Measured conc.±SD (ng/mL) | RSD1) (%) | Recovery rate (%) |
|---|---|---|---|---|
| Within-run | 95.2 | 90.7±5.1 | 5.6 | 95.2 |
| 190.5 | 191.1±12.5 | 6.6 | 100.3 | |
| Between-run | 95.2 | 99.8±3.5 | 3.5 | 104.8 |
| 190.5 | 192.3±1.7 | 0.9 | 101.0 |
RSD: relative standard deviation.
Plasma and tissue distribution
The plasma esculetin concentrations were determined in SD rats following oral administration of 25 mg/kg esculetin. The plasma esculetin concentration was 173.3± 25.8 ng/mL at 5 min, 82.5±32.2 ng/mL at 10 min, 38.4±4.5 ng/mL at 15 min, 34.2±12.7 ng/mL at 30 min, 34.4±10.3 ng/mL at 60 min, 34.1±7.4 ng/mL at 90 min, 11.4±10.9 ng/mL at 120 min, and 5.6±0.0 ng/mL at 180 min. The plasma concentration/time profile of esculetin is shown in Fig. 3. Plasma esculetin was detected until 180 min after oral administration. The Cmax was 173.3 ng/mL at 5 min, the T1/2 was 45 min, and the AUC0~180 min was 5,167.5 ng · /mL. Among the tissues tested, esculetin was only detected in the liver (30.87±11.33 ng/g) and the kidney (20.29±7.02 ng/g). These results indicate that esculetin may be rapidly distributed and eliminated in rat.
Fig. 3.

The concentration vs. time curve of esculetin in plasma (n=9).
DISCUSSION
The convergence of nutrigenomics, metabolomics, and proteomics has been rapidly advancing the scientific investigation of the influence of nutrients and bioactive components on gene expression. Especially, monitoring for the distribution of trace nutrients or metabolites in human body might be based on the understanding of the interaction between components and genes.
Esculetin, a derivative of coumarin, has been found in chicory in the form of glycosides; is traditionally used as an herbal medicine to alleviate fever and pain (1); and has been recently studied for its beneficial nutraceutical effects on lipoxygenase activity, platelet aggregation, inflammation, and colon cancer cells (8). However, the adsorption and distribution of esculetin in the human body is poorly understood.
The purpose of the current study was to improve our basic understanding of esculetin adsorption, distribution, metabolism, and excretion by investigating the distribution of esculetin in the plasma and tissues of SD rats after oral administration. In addition, we developed and validated an HPLC method for the accurate detection of esculetin in biofluids and identified esculetin using TOF/MS/MS.
Many metabolomic research experiments have emphasized the importance of using evidence-based sample preparation methods when detecting analytes in biofluids or tissues (12). Pereira et al. (13) said that optimization of the anticoagulant type used for sample collection, the method used for protein precipitation, and the conditions used for LC/MS is necessary to obtain the most reproducible results when analyzing biofluidic matrices. In this study, we were able to use HPLC to clearly resolve esculetin from plasma using 85% acetonitrile adjusted to pH 2.5 and a UV detector set 342 nm. We used MS/MS to confirm that the peak of interest was esculetin; the most abundant fragment ions in MS were [M+H]+ m/z 179.0388, [M+H−CO]+ m/z 151.0392, and [M+H−2CO]+ m/z 123.0433; and the most abundant fragment ion in MS/MS was [M+H−H2O−CO]+ m/z 133.0287. These results are in agreement with those of previous reports by Li et al. (14), who showed that scopoletin, which is structurally similar to esculetin, exhibited successive cleavage of CO and Yang et al. (15), who reported that some coumarins that have two hydroxyl groups show the elimination of H2O. Based on the above studies, we are convinced that the analytical method we used to detect esculetin in plasma is valid.
Finally, we validated the accuracy and reproducibility of the analytical methods developed for this study because, relative to its concentration in plants, esculetin is normally present in trace amounts in animal plasma. We showed a good linearity (r2=0.996) in the range of 4.8~476.2 ng/mL. The LOD and LOQ were 33.2 ng/mL and 100.6 ng/mL, respectively. The within-run recovery rates for the 95.2 ng/mL and 190.5 ng/mL samples were 95.2% and 100.3%, respectively, and the between-run recovery rates for the 95.2 ng/mL and 190.5 ng/mL samples were 104.8% and 101.0%, respectively. The RSD was less than 7% in both runs. Overall, these results indicate that the variability of the results of repeated analytical experiments performed on the same day and on different days is low, and that the results obtained with this method are highly accurate and reproducible.
The analytical method described above was used to measure the plasma esculetin concentration of SD rats at 5 min, 10 min, 15 min, 30 min, 60 min, 90 min, 120 min, and 180 min after oral administration of a 25 mg/kg dose of esculetin. The maximum plasma level of esculetin (173.3±25.8 ng/mL) was detected at 5 min post-oral administration. The T1/2 of esculetin in the plasma was 45.0 min (Table 3).
Table 3.
Maximum plasma concentration and AUC value of esculetin in rat plasma after oral administration
| Parameter | Tmax1) (min) | Cmax2) (ng/mL) | T1/23) (min) | AUC0~180 min4) (ng·min/mL) |
|---|---|---|---|---|
| Esculetin | 5 | 173.3 | 45.0 | 5,167.5 |
Tmax: time to reach Cmax.
Cmax: maximum plasma concentration.
T1/2: elimination half-life.
AUC0~180 min: area under the concentration vs. time curve from 0 min to the last sampling time (i.e., 180 min).
To optimize the extraction of esculetin from various tissues, we tested several organic solvents, buffering solutions, and organic solvent to buffering solution ratios during sample preparation. We found that the combination of 2.5 mM citrate buffer and diethyl ether was most effective for the extraction and concentration of esculetin from tissues. We were able to detect esculetin in the liver (30.87±11.33 ng/g) and kidney (20.29±7.02 ng/g), but not in the other tissues collected (i.e., liver, kidney, muscle, heart, lung, brain, testis, thymus, brown fat, and epididymal adipose tissue). Lake (16) said that orally administered coumarins are rapidly absorbed from the gastrointestinal tract, distributed through the body and then extensively metabolized by hepatic CYP2A6 to 7-hydroxycoumarin and excreted in the urine as glucuronide and sulfate conjugates. Ritschel et al. (17,18) reported that orally administered coumarins are completely absorbed from the gastrointestinal tract and are metabolized by the liver in the first pass.
In conclusion, orally administered esculetin is rapidly absorbed and eliminated from plasma and is rapidly distributed and eliminated from tissues. Esculetin may not have been detected in other tissues because it was metabolized or catabolized. While it wasn’t investigated in the present study, further elucidation of esculetin absorption, distribution, metabolism, and elimination might provide evidence to support a relationship between esculetin and target gene expression that improves human health.
Footnotes
AUTHOR DISCLOSURE STATEMENT
The authors declare no conflict of interest.
REFERENCES
- 1.Zhou L, Kang J, Fan L, Ma XC, Zhao HY, Han J, Wang BR, Guo DA. Simultaneous analysis of coumarins and secoiridoids in Cortex Fraxini by high-performance liquid chromatography–diode array detection–electrospray ionization tandem mass spectrometry. J Pharm Biomed Anal. 2008;47:39–46. doi: 10.1016/j.jpba.2007.12.009. [DOI] [PubMed] [Google Scholar]
- 2.Kemal C, Louis-Flamberg P, Krupinski-Olsen R, Shorter AL. Reductive inactivation of soybean lipoxygenase 1 by catechols: a possible mechanism for regulation of lipoxygenase activity. Biochemistry. 1987;26:7064–7072. doi: 10.1021/bi00396a031. [DOI] [PubMed] [Google Scholar]
- 3.Okada Y, Miyauchi N, Suzuki K, Kobayashi T, Tsutsui C, Mayuzumi K, Nishibe S, Okuyama T. Search for naturally occurring substances to prevent the complications of diabetes. II. Inhibitory effect of coumarin and flavonoid derivatives on bovine lens aldose reductase and rabbit platelet aggregation. Chem Pharm Bull (Tokyo) 1995;43:1385–1387. doi: 10.1248/cpb.43.1385. [DOI] [PubMed] [Google Scholar]
- 4.Wang SY, Lin HS. Antioxidant activity in fruits and leaves of blackberry, raspberry, and strawberry varies with cultivar and developmental stage. J Agric Food Chem. 2000;48:140–146. doi: 10.1021/jf9908345. [DOI] [PubMed] [Google Scholar]
- 5.Wang F, Herzmark P, Weiner OD, Srinivasan S, Servant G, Bourne HR. Lipid products of PI(3)Ks maintain persistent cell polarity and directed motility in neutrophils. Nat Cell Biol. 2002;4:513–518. doi: 10.1038/ncb810. [DOI] [PubMed] [Google Scholar]
- 6.Park C, Jin CY, Kim GY, Choi IW, Kwon TK, Choi BT, Lee SJ, Lee WH, Choi YH. Induction of apoptosis by esculetin in human leukemia U937 cells through activation of JNK and ERK. Toxicol Appl Pharmacol. 2008;227:219–228. doi: 10.1016/j.taap.2007.10.003. [DOI] [PubMed] [Google Scholar]
- 7.Witaicenis A, Seito LN, Di Stasi LC. Intestinal anti-inflammatory activity of esculetin and 4-methylesculetin in the trinitrobenzenesulphonic acid model of rat colitis. Chem Biol Interact. 2010;186:211–218. doi: 10.1016/j.cbi.2010.03.045. [DOI] [PubMed] [Google Scholar]
- 8.Lee SY, Lim TG, Chen H, Jung SK, Lee HJ, Lee MH, Kim DJ, Shin A, Lee KW, Bode AM, Surh YJ, Dong Z. Esculetin suppresses proliferation of human colon cancer cells by directly targeting β-catenin. Cancer Prev Res (Phila) 2013;6:1356–1364. doi: 10.1158/1940-6207.CAPR-13-0241. [DOI] [PMC free article] [PubMed] [Google Scholar]
- 9.Schimmer O, Eschelbach H. Esculetin in Alchemilla speciosa: identification and antimutagenic properties. Pharmazie. 1997;52:476–478. [PubMed] [Google Scholar]
- 10.Tsai TH, Huang CT, Shum AY, Chen CF. Simultaneous blood and biliary sampling of esculetin by microdialysis in the rat. Life Sci. 1999;65:1647–1655. doi: 10.1016/S0024-3205(99)00413-0. [DOI] [PubMed] [Google Scholar]
- 11.Sales NMR, Pelegrini PB, Goersch MC. Nutrigenomics: definitions and advances of this new science. J Nutr Metab. 2014;2014:202759. doi: 10.1155/2014/202759. [DOI] [PMC free article] [PubMed] [Google Scholar]
- 12.Issaq HJ, Van QN, Waybright TJ, Muschik GM, Veenstra TD. Analytical and statistical approaches to metabolomics research. J Sep Sci. 2010;32:2183–2199. doi: 10.1002/jssc.200900152. [DOI] [PubMed] [Google Scholar]
- 13.Pereira H, Martin JF, Joly C, Sébédio JL, Pujos-Guillot E. Development and validation of a UPLC/MS method for a nutritional metabolomic study of human plasma. Metabolomics. 2010;6:207–218. doi: 10.1007/s11306-009-0188-9. [DOI] [Google Scholar]
- 14.Li ZL, Zhang L, Tian JK, Zhou WM. Studies on chemical constituents from leaves of Vaccinium bracteatum. Zhongguo Zhong Yao Za Zhi. 2008;33:2087–2089. [PubMed] [Google Scholar]
- 15.Yang W, Ye M, Liu M, Kong D, Shi R, Shi X, Zhang K, Wang Q, Lantong Z. A practical strategy for the characterization of coumarins in Radix Glehniae by liquid chromatography coupled with triple quadrupole-linear ion trap mass spectrometry. J Chromatogr A. 2010;1217:4587–4600. doi: 10.1016/j.chroma.2010.04.076. [DOI] [PubMed] [Google Scholar]
- 16.Lake BG. Coumarin metabolism, toxicity and carcinogenicity: relevance for human risk assessment. Food Chem Toxicol. 1999;37:423–453. doi: 10.1016/S0278-6915(99)00010-1. [DOI] [PubMed] [Google Scholar]
- 17.Ritschel WA, Brady ME, Tan HSI. First-pass effect of coumarin in man. Int J Clin Pharmacol Biopharm. 1979;17:99–103. [PubMed] [Google Scholar]
- 18.Ritschel WA, Brady ME, Tan HS, Hoffmann KA, Yiu IM, Grummich KW. Pharmacokinetics of coumarin and its 7-hydroxy-metabolites upon intravenous and peroral administration of coumarin in man. Eur J Clin Pharmacol. 1977;12:457–461. doi: 10.1007/BF00561066. [DOI] [PubMed] [Google Scholar]