Abstract
Background
Renal hemodynamic measurements are complicated to perform in patients with cirrhosis; yet they provide the best measure of risk to predict hepatorenal syndrome (HRS). Currently, there are no established biomarkers of altered renal hemodynamics in cirrhosis validated by measured renal hemodynamics.
Methods
In this pilot study, simultaneous measurements of glomerular filtration rate (GFR), renal plasma flow (RPF), renal resistive indices and biomarkers were performed to evaluate renal hemodynamic alterations in 10 patients with cirrhosis (3 patients without ascites, 5 with diuretic sensitive and 2 diuretic refractory ascites).
Results
Patients with diuretic refractory ascites had the lowest mean GFR (36.5 ml/min/1.73m2) and RPF (133.6 ml/min/1.73m2) when compared to those without ascites (GFR=82.9 ml/min/1.73m2, RPF=229.9 ml/min/1.73m2) and with diuretic-sensitive ascites (GFR=82.3 ml/min/1.73m2, RPF=344.1 ml/min/1.73m2). A higher mean filtration fraction (FF= GFR/RPF=0.36) was noted among those without ascites compared to those with ascites. Higher FF in patients without ascites is most likely secondary to the vasoconstriction in the efferent glomerular arterioles (normal FF≃0.20). In general, renal resistive indices were inversely related to FF. While patients with ascites had lower FF and higher right kidney main and arcuate artery resistive indices, those without ascites had higher FF and lower right kidney main and arcuate artery resistive indices. While cystatin C and beta-2 microglobulin performed better compared to Cr in estimating RPF; beta-trace protein, beta-2 microglobulin, SDMA, and (SDMA+ADMA) performed better in estimating right kidney arcuate artery resistive index.
Conclusion
The results of this pilot study showed that identification of non-invasive biomarkers of reduced RPF and increased renal resistive indices can identify cirrhotics at risk for HRS at a stage more amenable to therapeutic intervention, and reduce mortality from kidney failure in cirrhosis.
Keywords: End-stage liver disease, glomerular filtration rate, renal plasma flow, renal resistive index, cystatin C, beta-trace protein, beta-2 microglobulin, kidney injury molecule-1 (KIM-1), Neutrophil Gelatinase-Associated Lipoprotein (NGAL)
INTRODUCTION
The estimated prevalence of acute and chronic kidney diseases among hospitalized patients with cirrhosis is reported to be 20%1. Acute kidney injury (AKI) in cirrhosis is associated with high morbidity and mortality2-4. In particular, hepatorenal syndrome (HRS), a specific cause of AKI5 due to severe reduction of renal blood flow1,4,6-9 and may lead to consequent acute tubular necrosis (ATN) requiring renal replacement therapy. Without liver and possibly simultaneous liver-kidney transplantation, HRS is frequently fatal1,4,6. Based on Organ Procurement and Transplantation Network data as of February 21, 2014; 8% of all adult liver-transplants performed in 2012 were simultaneous liver-kidney transplants (excluding simultaneous liver-kidney heart, liver-kidney intestine, liver-kidney pancreas, liver-kidney-pancreas-intestine)10.
Current treatments of HRS include splanchnic vasoconstrictors (Octreotide, Terlipressin), alpha-agonists and albumin. These treatments are effective in fewer than 50% of patients with cirrhosis3,4. The lack of efficacy in the treatment of HRS is likely due to delays in the administration of splanchnic vasoconstrictors caused by the limitation of the current diagnostic criteria of HRS11. There is no gold standard method to diagnose HRS; it is largely a diagnosis of exclusion. It can also be superimposed on anatomical kidney diseases, or functional changes in renal function such as prerenal azotemia due to gastrointestinal bleeding, further complicating the diagnosis. Existing methods to identify reduced renal blood flow in cirrhosis that are clinically practical have limited accuracy11. First, serum creatinine (Cr) is not a sufficiently accurate marker of kidney function in cirrhosis12; yet current diagnostic criteria for HRS is based on serum Cr. Furthermore, reduction in renal blood flow, particularly renal cortical blood flow, is a key phenomenon in the development of HRS and may precede the increase in Cr and decline in glomerular filtration rate (GFR)13. Second, current criteria14 are inadequate to diagnose HRS in subjects with cirrhosis and underlying chronic kidney disease (CKD) who already have elevated Cr levels5,11. Third, these criteria traditionally require two days of albumin administration to differentiate hypovolemia-induced prerenal azotemia from HRS14. Waiting for two days to determine the effects of albumin infusion can cause substantial delays in initiation of vasoconstrictor treatment in HRS and reduce the efficacy of existing treatments11. Differentiation of prerenal azotemia from HRS may not be the best strategy, as cirrhotics can have combined HRS and hypovolemia-induced azotemia11.
Currently, there are no established biomarkers of altered renal hemodynamics in cirrhosis validated by measured GFR and renal plasma flow (RPF) measurements. The primary objective of this pilot study was to assess renal hemodynamic levels in different stages of cirrhosis using a gold-standard invasive assessment and determine whether novel non-invasive biomarkers including cystatin C, beta-trace protein, beta-2 microglobulin and dimethylarginines were more accurate estimators of altered renal hemodynamics compared to Cr in patients with cirrhosis.
METHODS
Study Participants
Between September and December 2013, patients with cirrhosis were recruited from the University of Maryland Medical Center. Inclusion criteria were having cirrhosis based on either liver histopathology or clinical, laboratory and radiological results and being 18 years of age or older at the time of enrollment. Exclusion criteria included inability to give informed consent and cognitive impairment; being pregnant or breastfeeding; allergy to iothalamate, iodine, iodine-containing radiographic contrast media or para-aminohippurate (PAH); untreated active hyperthyroidism, thyroid autonomy, multinodular goiter, or ongoing treatment with radioactive iodine; limitations for voiding or collecting urine; renal failure treated with dialysis or estimated GFR < 15 ml/min/1.73m2; treatment with corticosteroids and non-steroidal anti-inflammatory drugs (NSAIDs) except any daily dose of aspirin lower than 325 mg within 1 week of enrollment; any change in the dose of diuretics, angiotensin-converting enzyme inhibitors or angiotensin II receptor blockers or new onset of diuretic, angiotensin-converting enzyme inhibitors or angiotensin II receptor blockers use within 1 week of enrollment; acute onset of infection, hospitalization due to exacerbation of encephalopathy, acute gastrointestinal bleeding, acute kidney injury within 1 week of enrollment; acute cardiovascular or cerebrovascular disease diagnosed within 3 weeks of enrollment; history of transjugular intrahepatic porto-systemic shunt placement, and previous kidney or liver transplantation.
The study was approved by the Institutional Review Board of the University of Maryland, Baltimore, and all study subjects provided written informed consent.
Study Visits and Procedures
The study included a screening visit that was conducted either at the University of Maryland Medical Center clinics or General Clinical Research Center (GCRC) and a procedure visit that was conducted at the GCRC. During screening visit, subjects were enrolled in the study and had a complete history and physical examination taken. They were instructed to have an overnight fast prior to the procedure day except they were allowed to take water and medications. If they were diabetic, they were asked to fast only for 2 hours.
The 6-hour procedure visit was scheduled in GCRC within 1 to 3 weeks of screening visit. On the procedure date, after consuming 500 ml of water, subjects underwent simultaneous measurements of RPF, GFR, renal resistive indices and biomarkers. The procedures and methods were as follows:
Renal Plasma Flow (RPF) Measurement
RPF was measured by PAH clearance as described in Wang et al.15. After an IV loading dose of 200 mg (1 mL), subjects received a constant infusion to achieve steady-state PAH plasma concentration of 20 mg/L. All subjects received PAH infusion at 60 mL/hr. The desired maintenance doses were based on the subjects’ screening GFR estimated by Modification of Diet in Renal Disease (MDRD) Study equation16. A 5 ml of blood sample was collected in heparinized tubes before and at 5, 15, 30, 45, 60, 120, 180, 240 and 360 min after the initiation of PAH administration. Following a pre-PAH urine collection, spontaneous urine collections were obtained at 0-60, 60-120, 120-180, and 180-360 min after starting the PAH infusion and urine volume collected at each time point was measured and 3 ml was transferred into a test tube. Plasma and urine samples were harvested by centrifugation, and aliquots stored at −20°C until analysis. Plasma and urine PAH concentrations were determined using High Performance Liquid Chromatography (HPLC) assay method17. RPF was calculated as the average renal clearance of PAH during the 360 min urine collection period as Renal PAH Clearance = (Amount of PAH excreted)x-y/(Area under the plasma PAH concentration vs. time curve)x-y, where x-y was the time interval of the urine collection period.
GFR Measurement
GFR was measured by non radiolabeled iothalamate plasma clearance as described in Mindikoglu et al. 18. The same blood samples as collected for RPF measurements were used for the GFR measurements. Plasma concentrations of iothalamate were determined by reversed-phase HPLC with ultraviolet (UV) detection as described by Dowling et al.17. Plasma iothalamate concentration versus time curve was modeled based on two-compartment model19 applying iterative least-square method using WinNonlin® version 5.1 (Certara L.P. (Pharsight), St. Louis, MO).
Measurement of Renal Resistive Indices.
Duplex Doppler Ultrasonography of both kidneys was performed using the Philips Healthcare iU22 Ultrasound System with C5-1 convex transducer. Duplex waveforms of the main, segmental, interlobar and arcuate arteries were assessed in the upper, mid and lower poles in both kidneys and peak systolic velocity, end diastolic velocity and resistive indices were measured simultaneously with GFR and RPF measurements. Renal resistive index was calculated as [(peak systolic velocity-end diastolic velocity)/peak systolic velocity]20. Two repeated measurements were taken from each renal artery; renal resistive index of each artery was reported as the mean value of these two measurements. Final resistive index was reported as the mean value of the mean resistive indices of the upper, mid and lower segmental, interlobar and arcuate arteries (e.g. arcuate artery resistive index reported in the analysis was equal to the mean value of the mean resistive indices of the upper, mid and lower arcuate arteries). Duplex Doppler Ultrasonography of all patients was performed by the same sonographer.
Measurement of Systemic Hemodynamics
Subjects’ intravascular volume status was assessed by measuring inferior vena cava (IVC) diameter during expiration using ultrasonography simultaneously with GFR and RPF measurements. Three measurements were taken from the IVC; IVC diameter was reported as the mean value of these three measurements.
Renal Hemodynamic Biomarkers
Pre-RPF/GFR blood samples were collected for symmetric (SDMA) and asymmetric dimethylarginine (ADMA), L-arginine, renin and aldosterone levels. SDMA, ADMA, L-arginine were measured using Diagnostika® standard ELISA method21,22, renin using Renin Human ELISA method (BioVendor Research and Diagnostic Products)23 and aldosterone using ELISA method (BioVendor Research and Diagnostic Products)24.
Filtration Markers
Pre-RPF/GFR blood samples were collected for Cr, cystatin C, beta-trace protein, beta 2 microglobulin measurements. Cr, cystatin C and beta-2 microglobulin concentrations were measured using Siemens Dimension Vista® System Flex® reagent cartridge (Siemens Healthcare Diagnostics Inc, Newark, DE)25,27. Beta-trace protein was measured using N Latex βTP assay using Siemens ProSpec® nephelometer (Siemens Healthcare Diagnostics Inc, Newark, DE)28 at the University of Minnesota Advanced Research and Diagnostic Laboratory. Other Laboratory Tests. Pre-RPF/GFR blood samples were collected for basic metabolic panel, complete blood count with differential, hepatic panel consisting of aspartate aminotransferase (AST), alanine aminotransferase (ALT), total and direct bilirubin, alkaline phosphatase (ALP), albumin, globulin, and total protein; prothrombin time (PT)/international normalized ratio (INR) and C reactive protein.
Urine Tests:
Pre-RPF/GFR urine samples were collected for microscopic analysis, Cr and protein to calculate spot urine protein to Cr ratio, kidney injury molecule-1 (KIM-1) and Neutrophil Gelatinase-Associated Lipoprotein (NGAL). NGAL was measured using Quantikine® ELISA Human Lipocalin 2/NGAL Immunoassay (R&D Systems, Inc)29 and KIM-1 using Human KIM 1 ELISA Kit (Aviscera Bioscience, Inc)30 .
Statistical Analysis
For statistical analyses, we used SAS, Version 9.2 (Cary, NC)31 and Minitab (Minitab, Inc., State College, PA)32 statistical softwares. Linear regression analysis was performed to assess the performance of renal biomarkers to predict RPF and renal arcuate artery resistive index.
RESULTS
Study Participants
A total of 14 subjects with cirrhosis were enrolled in the study; 10 out of 14 (7 men and 3 women; age ranging from 45 to 69) completed all study procedures. Table 1 shows clinical and laboratory characteristics of 10 patients with cirrhosis. Seven patients had hepatitis C cirrhosis and 3 alcohol cirrhosis. Three patients had no ascites, 5 diuretic sensitive ascites and 2 diuretic-refractory ascites. While the lowest Model for End-Stage Liver Disease (MELD) score was 8, the highest was 19. All patients except one (spot urine protein to Cr ratio=0.25) had a spot urine protein to Cr ratio lower than 0.2 suggesting no evidence for clinically significant glomerular disease. No patient's urine KIM-1 and NGAL level was greater than the optimal cut points of KIM-1 (15.4 ng/ml=15,400 pg/ml) and NGAL (365 ng/ml) that differentiates ATN from non-ATN as described by Belcher et al.33
Table 1.
Clinical and Laboratory Characteristics of Patients with Cirrhosis
| Patient | Age (Years) | Sex | Etiology of Cirrhosis | MELD Score | Type of Ascites | Cr (mg/dl) | Cystatin C (mg/L) | Beta-trace Protein (mg/L) | Beta-2 Microglobulin (mg/L) | SDMA (micromol/L) | ADMA (micromole/L) | L-Arginine (micromole/L) | Renin (pg/ml) | Aldosterone (pg/ml) | NGAL (ng/ml) | Urine KIM-1 (pg/ml) | Spot Urine Protein/Cr Ratio |
|---|---|---|---|---|---|---|---|---|---|---|---|---|---|---|---|---|---|
| 1 | 60 | M | Hepatitis C | 16 | Diuretic-Refractory | 1.510 | 1.690 | 2.300 | 8.480 | 1.027 | 0.901 | 78.554 | 170.620 | 1638.95 | 2.99 | 851.13 | 0.10 |
| 2 | 46 | M | Alcohol | 18 | Diuretic-Sensitive | 0.852 | 0.633 | 0.495 | 1.740 | 0.477 | 0.568 | 87.249 | 76.367 | 1355.70 | 26.85 | 1644.32 | 0.05 |
| 3 | 69 | F | Alcohol | 14 | Diuretic-Sensitive | 0.740 | 0.918 | 0.791 | 2.940 | 0.568 | 0.848 | 89.733 | 112.210 | 685.38 | 133.40 | 1188.20 | 0.25 |
| 4 | 53 | M | Hepatitis C | 10 | Diuretic-Sensitive | 0.896 | 0.891 | 0.594 | 2.860 | 0.742 | 1.022 | 81.882 | 35.130 | 347.29 | 9.60 | 1972.18 | 0.09 |
| 5 | 65 | M | Hepatitis C | 8 | No Ascites | 0.756 | 0.693 | 0.367 | 2.690 | 0.427 | 0.501 | 67.139 | 5.370 | 191.97 | 5.27 | 390.50 | 0.11 |
| 6 | 58 | M | Hepatitis C | 17 | Diuretic-Refractory | 1.830 | 2.100 | 1.940 | 8.400 | 1.055 | 1.013 | 97.693 | 29.584 | 333.03 | 88.21 | 6992.23 | 0.17 |
| 7 | 58 | M | Alcohol | 10 | No Ascites | 0.562 | 0.920 | 0.697 | 2.230 | 0.387 | 0.576 | 75.672 | 29.896 | 187.57 | 4.83 | 5520.12 | 0.08 |
| 8 | 45 | F | Hepatitis C | 19 | Diuretic-Sensitive | 0.721 | 0.974 | 0.805 | 2.750 | 0.575 | 0.768 | 160.220 | 149.770 | 1115.60 | 19.85 | 848.62 | 0.09 |
| 9 | 57 | M | Hepatitis C | 16 | Diuretic-Sensitive | 0.614 | 0.719 | 0.648 | 2.280 | 0.422 | 0.723 | 133.200 | 1.307 | 232.45 | 5.23 | 2400.70 | 0.04 |
| 10 | 55 | F | Hepatitis C | 8 | No Ascites | 0.979 | 1.010 | 0.803 | 3.250 | 0.467 | 0.655 | 73.798 | 1.168 | 205.31 | 13.08 | 99.44 | 0.06 |
Renal Hemodynamics
Table 2 shows GFR and RPF measured simultaneously with renal resistive indices of main, segmental, interlobar and arcuate arteries of both kidneys. No subjects had evidence of volume depletion or overload; mean IVC diameter was 1.61 cm, ranging from 1.07 cm to 2.19 cm. In general, FF (GFR/RPF) was lower and renal resistive indices were higher in patients with ascites compared to those without ascites (Table 3). A higher mean FF (0.36) was noted among those without ascites compared to those with ascites (Table 3). Patients with diuretic-refractory ascites had the lowest mean GFR (36.5 ml/min/1.73m2) and mean RPF (133.6 ml/min/1.73m2) when compared to those without ascites (GFR=82.9 ml/min/1.73m2, RPF=229.9 ml/min/1.73m2) and with diuretic-sensitive ascites (82.3 ml/min/1.73m2, 344.1 ml/min/1.73m2) (Table 3).
Table 2.
Simultaneous Measurement of Renal Hemodynamics including GFR, RPF, and Renal Resistive Indices in Patients with Cirrhosis
| Case # | Type of Ascites | IVC Diameter (cm) | GFR1 | RPF1 | FF2 | Right Kidney Main Artery Resistive Index3 | Right Kidney Segmental Artery Resistive Index3 | Right Kidney Interlobar Artery Resistive Index3 | Right Kidney Arcuate Artery Resistive Index3 | Left Kidney Main Artery Resistive Index3 | Left Kidney Segmental Artery Resistive Index3 | Left Kidney Interlobar Artery Resistive Index3 | Left Kidney Arcuate Artery Resistive Index3 |
|---|---|---|---|---|---|---|---|---|---|---|---|---|---|
| 1 | Diuretic-Refractory | 1.367 | 36.193 | 144.950 | 0.25 | 0.865 | 0.773 | 0.740 | 0.800 | 0.805 | 0.763 | 0.768 | 0.635 |
| 2 | Diuretic-Sensitive | 1.970 | 112.216 | 550.298 | 0.20 | 0.595 | 0.672 | 0.643 | 0.633 | 0.670 | 0.612 | 0.605 | 0.592 |
| 3 | Diuretic-Sensitive | 1.550 | 54.217 | 253.319 | 0.21 | 0.750 | 0.727 | 0.680 | 0.727 | 0.830 | 0.795 | 0.803 | 0.708 |
| 4 | Diuretic-Sensitive | 1.630 | 91.011 | 306.801 | 0.30 | 0.695 | 0.677 | 0.663 | 0.650 | 0.725 | 0.677 | 0.668 | 0.622 |
| 5 | No Ascites | 1.550 | 73.901 | 183.233 | 0.40 | 0.720 | 0.665 | 0.687 | 0.630 | 0.680 | 0.683 | 0.650 | 0.673 |
| 6 | Diuretic-Refractory | 2.063 | 36.819 | 122.263 | 0.30 | 0.770 | 0.748 | 0.728 | 0.707 | 0.775 | 0.762 | 0.750 | 0.763 |
| 7 | No Ascites | 2.190 | 114.575 | 323.786 | 0.35 | 0.705 | 0.665 | 0.648 | 0.645 | 0.765 | 0.627 | 0.683 | 0.662 |
| 8 | Diuretic-Sensitive | 1.108 | 61.775 | 289.812 | 0.21 | 0.815 | 0.743 | 0.718 | 0.677 | 0.795 | 0.732 | 0.683 | 0.712 |
| 9 | Diuretic-Sensitive | 1.607 | 92.458 | 320.475 | 0.29 | 0.720 | 0.712 | 0.693 | 0.695 | 0.745 | 0.697 | 0.712 | 0.658 |
| 10 | No Ascites | 1.070 | 60.205 | 182.552 | 0.33 | 0.585 | 0.593 | 0.572 | 0.572 | 0.585 | 0.630 | 0.552 | 0.585 |
GFR and RPF were reported in ml/min/1.73m2.
Filtration Fraction (FF)=GFR/RPF.
Two repeated measurements were taken from each renal artery; renal resistive index of each artery was reported as the mean value of these two measurements. Final resistive index was reported as the mean value of the mean resistive indices of the upper, mid and lower segmental, interlobar and arcuate arteries.
Table 3.
Mean GFR, RPF, FF and Renal Resistive Indices Stratified by Type of Ascites in Patients with Cirrhosis
| Right Kidney | Mean Renal Resistive Index | Left Kidney | Mean Renal Resistive Index | Mean GFR1 | Mean RPF1 | Mean FF2 | |
|---|---|---|---|---|---|---|---|
| No Ascites | Main Renal Artery | 0.670 | Main Renal Artery | 0.677 | 82.894 | 229.857 | 0.36 |
| Segmental Artery | 0.641 | Segmental Artery | 0.647 | ||||
| Interlobar Artery | 0.636 | Interlobar Artery | 0.628 | ||||
| Arcuate Artery | 0.616 | Arcuate Artery | 0.640 | ||||
| Diuretic-Sensitive Ascites | Main Renal Artery | 0.715 | Main Renal Artery | 0.753 | 82.336 | 344.141 | 0.24 |
| Segmental Artery | 0.706 | Segmental Artery | 0.702 | ||||
| Interlobar Artery | 0.680 | Interlobar Artery | 0.694 | ||||
| Arcuate Artery | 0.676 | Arcuate Artery | 0.658 | ||||
| Diuretic-Refractory Ascites | Main Renal Artery | 0.818 | Main Renal Artery | 0.790 | 36.506 | 133.606 | 0.28 |
| Segmental Artery | 0.761 | Segmental Artery | 0.763 | ||||
| Interlobar Artery | 0.734 | Interlobar Artery | 0.759 | ||||
| Arcuate Artery | 0.753 | Arcuate Artery | 0.699 | ||||
GFR and RPF were reported in ml/min/1.73m2.
FF=GFR/RPF.
Renal Resistive Indices
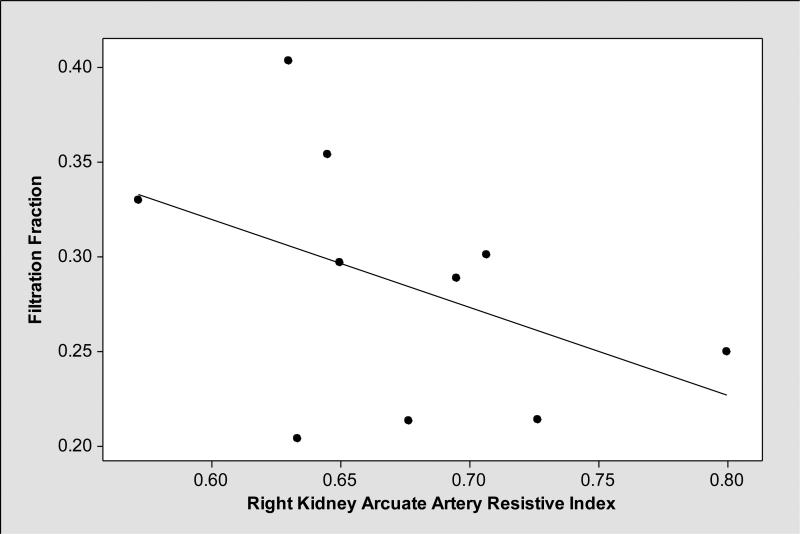
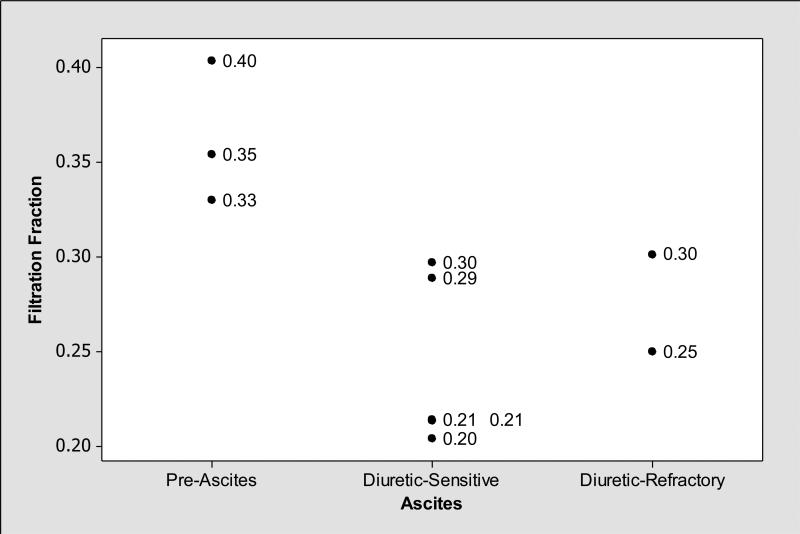
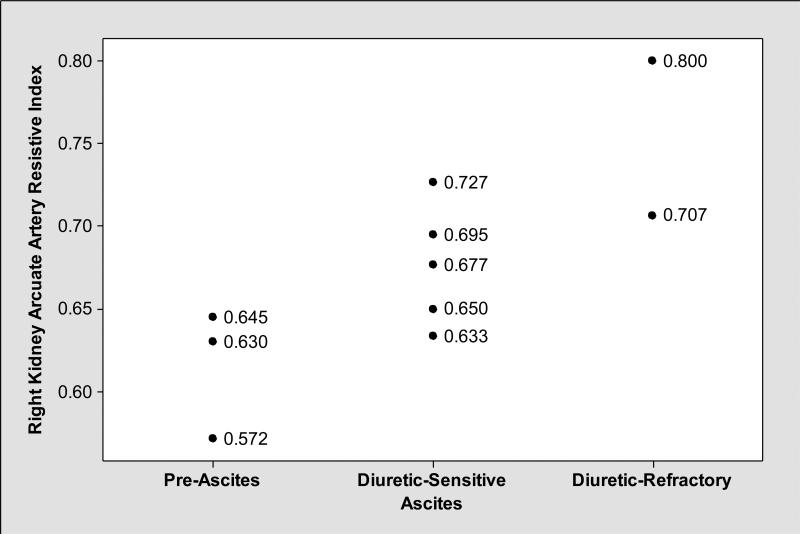
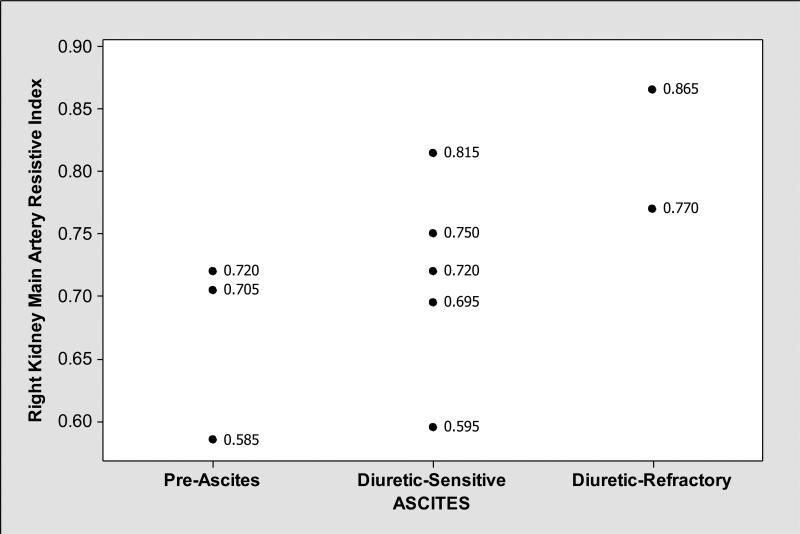
As shown in Table 3, mean renal resistive indices were higher in cirrhotics with ascites compared to those without ascites. In general, renal resistive indices, particularly right kidney arcuate artery resistive indices showed medium level negative correlation with FF (Pearson correlation coefficient r= −0.44, P=0.20) (Figure 1); while patients with ascites had lower FF and higher right kidney main and arcuate artery resistive indices, those without ascites had higher FF and lower right kidney main and arcuate artery resistive indices (Figures 2, 3 and 4). We observed similar findings with left kidney main and arcuate artery resistive indices.
Figure 1.
Right kidney arcuate artery resistive indices had medium negative correlation with filtration fraction (Pearson correlation coefficient r= −0.44, P=0.20).
Figure 2.
Filtration fraction (FF=GFR/RPF) was increased (FF>0.20) among subjects without ascites while it was lower among those with diuretic sensitive and -refractory ascites compared to those without ascites.
Figure 3.
In contrast to FF that was lower in subjects with ascites (Figure 2), right kidney arcuate artery (located at the junction of renal cortex and medulla; supplying renal cortex) resistive indices were elevated in those with ascites compared to those without ascites.
Figure 4.
In contrast to FF that was lower in subjects with ascites (Figure 2), right kidney main artery resistive indices were elevated in those with ascites compared to those without ascites.
Biomarkers
Additionally, we measured renal biomarkers including serum Cr, cystatin C, beta-trace protein, beta-2 microglobulin, SDMA, ADMA and L-arginine simultaneously with GFR, RPF and renal resistive indices.
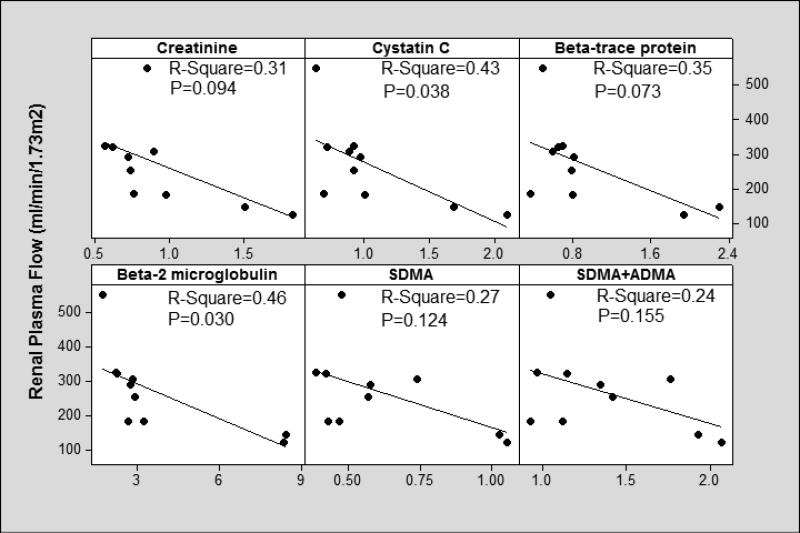
In terms of estimating RPF, the linear regression fit was better for cystatin C (R-Square=0.43, P=0.038), beta-trace protein (R-Square=0.35, P=0.073) and beta-2 microglobulin (R-Square=0.46, P=0.030) compared to Cr (R-Square=0.31, P=0.094), SDMA (R-Square=0.27, P=0.124), the sum of SDMA and ADMA (SDMA+ADMA) (R-Square=0.24, 0.155), L-arginine (R Square=0.03, P=0.643), ADMA (R-Square=0.15, P=0.267) and L-arginine/SDMA ratio (R-Square=0.20, P=0.199) (Figure 5). We obtained similar results when we controlled for age, sex and race.
Figure 5.
We measured candidate biomarkers simultaneously with RPF (adjusted for body surface area) and compared their performances to serum Cr.
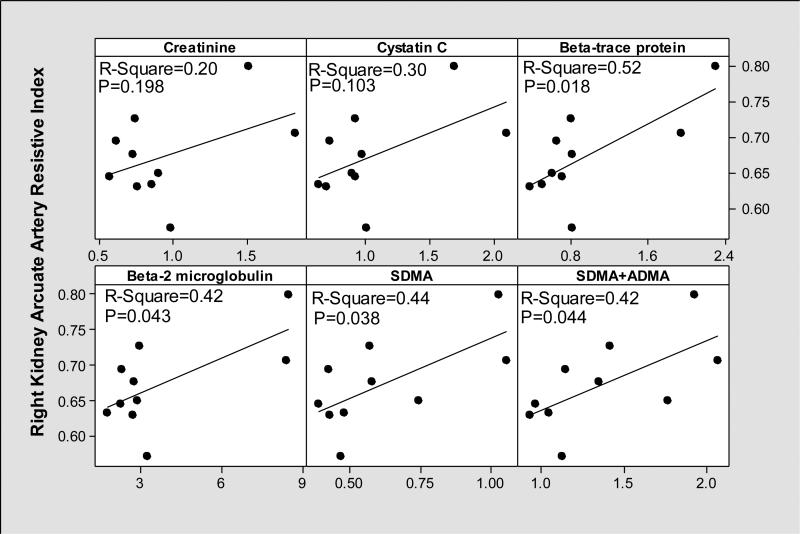
While all biomarkers appeared to perform better compared to serum Cr (R-Square=0.20, P=0.198) in estimating renal cortical blood flow assessed by right kidney arcuate artery resistive index; the beta-trace protein (R-Square=0.52, P=0.018), beta 2 microglobulin (R-Square=0.42, P=0.043), SDMA (R-Square=0.44, P=0.038), (SDMA+ADMA) (R-Square=0.42, P=0.044) performed the best (Figure 6). The performance of L-arginine (R-Square=0.04, P=0.585), ADMA (R-Square=0.31, P=0.092) and L-arginine/SDMA ratio (R-Square=0.05, P=0.537) was poor.
Figure 6.
We measured candidate biomarkers simultaneously with right kidney arcuate artery resistive indices and compared their performances to serum Cr.
DISCUSSION
In this pilot study, we performed simultaneous measurements of GFR, RPF, renal resistive indices and biomarkers to evaluate patterns of change in different stages of cirrhosis. To our knowledge, our study is the first to measure renal resistive indices simultaneously with direct RPF and GFR measurements in cirrhotics. Our results suggest that in different stages of cirrhosis assessed by the type of ascites (no ascites, diuretic sensitive and –refractory ascites), there are distinct patterns of glomerular hemodynamics and resistive indices.
We observed a higher mean FF (FF=GFR/RPF=0.36) among those without ascites compared to those with ascites (Table 3). Higher FF in patients without ascites is most likely secondary to the vasoconstriction in the efferent glomerular arterioles (normal FF≃0.20). Among those with diuretic-refractory ascites, we observed the lowest GFR and RPF consistent with the results of our recent study18. Among those with ascites, FF was near normal and renal resistive indices were higher. In general, renal resistive indices were inversely related to FF (Figure 1); while patients with ascites had lower FF and higher right kidney main and arcuate artery resistive indices, those without ascites had higher FF and lower kidney main and arcuate artery resistive indices (Figures 2, 3 and 4). These findings suggest that in late stages of cirrhosis, reduced RPF is associated with increase in renal arterial resistive indices as there is no compensatory increase in FF. According Poiseuille's law34, resistance to flow is inversely related to volume flow rate. As renal vascular resistance is positively and significantly correlated with renal resistive indices35, our findings of reduced RPF with increased renal resistive indices suggest that our findings are in line with Poiseuille's law. While cystatin C and beta-2 microglobulin performed better compared to Cr in estimating RPF (Figure 5); beta-trace protein, beta-2 microglobulin, SDMA, and (SDMA+ADMA) performed better in estimating right kidney arcuate artery resistive index (Figure 6).
In our recent review, we emphasized the importance of simultaneous evaluation of GFR, RPF and FF in cirrhosis and proposed a dynamic classification system that takes both GFR and RPF into account in evaluating kidney dysfunction in cirrhosis11. In 1951, Leslie et al.36 evaluated renal hemodynamics in 17 patients with cirrhosis and showed the importance of FF (simultaneous GFR and RPF measurements) in cirrhosis. In patients without ascites, mean FF was elevated; whereas in those with ascites, mean FF was normal36. The elevation in FF most likely resulted from the vasoconstrictive effect of angiotensin II on efferent glomerular arterioles11,36,37. On the other hand, simultaneous reductions in mean GFR and RPF resulted in normal/subnormal levels of FF in parallel to the severity of ascites. The results of our study are in line with these findings (Table 3).
Additionally, we showed that normal FF (FF≃0.20) was associated with reductions in renal cortical blood flow that was assessed by renal arcuate artery resistive indices (Figure 1). Arcuate arteries are located at the junction of renal cortex and medulla and give rise to interlobular arteries that supply the renal cortex38. Measurement of interlobular artery resistive indices by Duplex Doppler ultrasound is technically challenging and poorly reproducible in patients with cirrhosis and ascites given the size of the arteries39,40. Therefore, we elected to measure resistive indices in the arcuate arteries to assess the renal cortical blood flow. The increase in resistive indices in the right kidney in patients with decompensated cirrhosis, particularly in those with diuretic refractory ascites was previously shown by Rivolta et al.41. However, the authors did not validate increases in renal resistive indices by simultaneous RPF measurements; rather they compared alterations in renal resistive indices with Cr clearance which is not an accurate measure of GFR in cirrhosis41. In this study, we confirmed the increases in renal resistive indices by the decrease in RPF measured by PAH clearance.
Our study suggests that both normal FF (≃0.20) and an increase in renal resistive indices can be associated with severe reductions in renal blood flow in cirrhosis. Development of spontaneous bacterial peritonitis, sepsis, aggressive diuresis and frequent paracenteses at this stage may increase risk of patients with cirrhosis to develop ATN in the setting of already severely reduced renal blood flow. Therefore, early identification of this stage by noninvasive biomarkers may facilitate early management in patients with cirrhosis including holding diuretics, infusion of albumin, and administration of vasoconstrictor drugs before waiting for increases in Cr.
Our study was limited to only 10 patients with cirrhosis which precluded formal statistical inference testing of between-group differences and correlations of RPF with the circulating biomarkers. Additionally, our study population was limited to only Caucasian and African-American participants. The results of this study are preliminary and a larger study is needed to assess the performance of these biomarkers. Despite the small study, our results are consistent and encouraging. These biomarkers may have significant specificity and sensitivity to assist management in patients with cirrhosis.
In conclusion, this pilot study suggests that normal FF (≃0.20) with reduced RPF and GFR and increased renal arterial resistance were the key alterations in renal hemodynamics of decompensated stages of cirrhosis. As direct measurement of GFR, RPF and renal resistive indices would be impractical and costly in a clinical setting; identification of non-invasive biomarkers more accurate than creatinine which are predictive of these hemodynamic changes may lead to modifications in treatment by identifying cirrhotics at risk for HRS at a stage more amenable to therapeutic intervention. Ultimately, such early identification could perhaps decrease the need for simultaneous kidney transplantation in cirrhotics awaiting liver transplantation, and reduce mortality from kidney failure in cirrhosis.
ACKNOWLEDGEMENTS
The authors thank Jean-Pierre Raufman, M.D. (Professor of Medicine, Department of Medicine, Division of Gastroenterology and Hepatology, University of Maryland School of Medicine) for editing our manuscript and for his valuable input; Heather L. Rebuck, MT (ASCP), CLS (NCA) and Sharon Y. Huang, MT for analysis of blood samples, Reem M. Sharaf, B.A. (study coordinator), Oscar R. Del Barco, MS, RDMS, RVT, RT (R) (sonographer) and University of Maryland General Clinical Research Center Staff.
FUNDING
“The project described was supported by Grant Number 5 K23 DK089008-04 from the National Institutes of Health (NIH) National Institute of Diabetes and Digestive and Kidney Diseases (to Ayse L. Mindikoglu, M.D., M.P.H.) and its contents are solely the responsibility of the authors and do not necessarily represent the official views of the National Institute of Diabetes and Digestive and Kidney Diseases or the NIH”
This work was also supported by the University of Maryland Clinical Translational Science Institute and the University of Maryland General Clinical Research Center.
Footnotes
CONFLICT OF INTEREST STATEMENT
None of the authors has conflict of interest associated with the manuscript.
REFERENCES
- 1.Garcia-Tsao G, Parikh CR, Viola A. Acute kidney injury in cirrhosis. Hepatology. 2008;48:2064–77. doi: 10.1002/hep.22605. [DOI] [PubMed] [Google Scholar]
- 2.Gines P. Pharmacological management of hepatorenal syndrome: lessons from non-responders. J Hepatol. 2011;55:268–9. doi: 10.1016/j.jhep.2011.02.006. [DOI] [PubMed] [Google Scholar]
- 3.Gluud LL, Christensen K, Christensen E, Krag A. Systematic review of randomized trials on vasoconstrictor drugs for hepatorenal syndrome. Hepatology. 2010;51:576–84. doi: 10.1002/hep.23286. [DOI] [PubMed] [Google Scholar]
- 4.Cholongitas E, Senzolo M, Patch D, Shaw S, O'Beirne J, Burroughs AK. Cirrhotics admitted to intensive care unit: the impact of acute renal failure on mortality. Eur J Gastroenterol Hepatol. 2009;21:744–50. doi: 10.1097/MEG.0b013e328308bb9c. [DOI] [PubMed] [Google Scholar]
- 5.Wong F, Nadim MK, Kellum JA, et al. Working Party proposal for a revised classification system of renal dysfunction in patients with cirrhosis. Gut. 2011;60:702–9. doi: 10.1136/gut.2010.236133. [DOI] [PubMed] [Google Scholar]
- 6.Alessandria C, Ozdogan O, Guevara M, et al. MELD score and clinical type predict prognosis in hepatorenal syndrome: relevance to liver transplantation. Hepatology. 2005;41:1282–9. doi: 10.1002/hep.20687. [DOI] [PubMed] [Google Scholar]
- 7.Epstein M. Hepatorenal syndrome: emerging perspectives of pathophysiology and therapy. J Am Soc Nephrol. 1994;4:1735–53. doi: 10.1681/ASN.V4101735. [DOI] [PubMed] [Google Scholar]
- 8.Epstein M, Berk DP, Hollenberg NK, et al. Renal failure in the patient with cirrhosis. The role of active vasoconstriction. Am J Med. 1970;49:175–85. doi: 10.1016/s0002-9343(70)80073-0. [DOI] [PubMed] [Google Scholar]
- 9.Epstein M, Schneider N, Befeler B. Relationship of systemic and intrarenal hemodynamics in cirrhosis. J Lab Clin Med. 1977;89:1175–87. [PubMed] [Google Scholar]
- 10. [February 28, 2014];Data. Available at http://optn.transplant.hrsa.gov/latestData/rptData.asp.
- 11.Mindikoglu AL, Weir MR. Current concepts in the diagnosis and classification of renal dysfunction in cirrhosis. Am J Nephrol. 2013;38:345–54. doi: 10.1159/000355540. [DOI] [PMC free article] [PubMed] [Google Scholar]
- 12.Sherman DS, Fish DN, Teitelbaum I. Assessing renal function in cirrhotic patients: problems and pitfalls. Am J Kidney Dis. 2003;41:269–78. doi: 10.1053/ajkd.2003.50035. [DOI] [PubMed] [Google Scholar]
- 13.Kew MC, Brunt PW, Varma RR, Hourigan KJ, Williams HS, Sherlock S. Renal and intrarenal blood-flow in cirrhosis of the liver. Lancet. 1971;2:504–10. doi: 10.1016/s0140-6736(71)90435-1. [DOI] [PubMed] [Google Scholar]
- 14.Salerno F, Gerbes A, Gines P, Wong F, Arroyo V. Diagnosis, prevention and treatment of hepatorenal syndrome in cirrhosis. Gut. 2007;56:1310–8. doi: 10.1136/gut.2006.107789. [DOI] [PMC free article] [PubMed] [Google Scholar]
- 15.Wang DJ, Dowling TC, Meadows D, et al. Nesiritide does not improve renal function in patients with chronic heart failure and worsening serum creatinine. Circulation. 2004;110:1620–5. doi: 10.1161/01.CIR.0000141829.04031.25. [DOI] [PubMed] [Google Scholar]
- 16.Levey AS, Coresh J, Greene T, et al. Expressing the Modification of Diet in Renal Disease Study equation for estimating glomerular filtration rate with standardized serum creatinine values. Clinical Chemistry. 2007;53:766–72. doi: 10.1373/clinchem.2006.077180. [DOI] [PubMed] [Google Scholar]
- 17.Dowling TC, Frye RF, Zemaitis MA. Simultaneous determination of p-aminohippuric acid, acetyl-p-aminohippuric acid and iothalamate in human plasma and urine by high-performance liquid chromatography. J Chromatogr B Biomed Sci Appl. 1998;716:305–13. doi: 10.1016/s0378-4347(98)00294-1. [DOI] [PubMed] [Google Scholar]
- 18.Mindikoglu AL, Dowling TC, Weir MR, Seliger SL, Christenson RH, Magder LS. Performance of chronic kidney disease epidemiology collaboration creatinine-cystatin C equation for estimating kidney function in cirrhosis. Hepatology. 2014;59:1532–42. doi: 10.1002/hep.26556. [DOI] [PMC free article] [PubMed] [Google Scholar]
- 19.Gibaldi M, Perrier D. Pharmacokinetics. 2nd ed. Marcel Dekker Inc; New York, NY: 1982. [Google Scholar]
- 20.Viazzi F, Leoncini G, Derchi LE, Pontremoli R. Ultrasound Doppler renal resistive index: a useful tool for the management of the hypertensive patient. J Hypertens. 2014;32:149–53. doi: 10.1097/HJH.0b013e328365b29c. [DOI] [PMC free article] [PubMed] [Google Scholar]
- 21.SDMA-ELISA [September 21, 2009]; Available at http://www.dld-diagnostika.de/uploads/SDMA-E.pdf.
- 22.ADMA- Arginine- Plasma ELISA [March 27, 2012]; Available http://www.dld-diagnostika.de/uploads/ADMA-Arginine-Plasma-E.pdf.
- 23.Renin Human ELISA [January 8, 2014]; Available at http://www.biovendor.com/product/immunoassays/renin-human-elisa.
- 24.Aldosterone ELISA [January 8, 2014]; Available at http://www.biovendor.com/product/immunoassays/aldosterone-elisa.
- 25.Package Insert/Instructions for Use, CYSC, REF K7040, Issue date 2011-03, SIEMENS, Dimension Vista® System Flex® reagent cartridge. Siemens Healthcare Diagnostics Inc; Newark, DE: [Google Scholar]
- 26.Package Insert/Instructions for Use, ECREA, REF K1270A, Issue date 2012-04-04, SIEMENS, Dimension Vista® System Flex® reagent cartridge. Siemens Healthcare Diagnostics Inc; Newark, DE: [Google Scholar]
- 27.Package Insert/Instructions for Use, B2MIC, REF K7024, Issue date 2009-05, SIEMENS, Dimension Vista® System Flex® reagent cartridge. Siemens Healthcare Diagnostics Inc; Newark, DE: [Google Scholar]
- 28.Package Insert/Instructions for Use, N Latex βTP. Siemens Healthcare Diagnostics Inc; Newark, DE: [Google Scholar]
- 29.Quantikine® ELISA [January 8, 2014];Human Lipocalin-2/NGAL Immunoassay. Available at http://www.rndsystems.com/pdf/DLCN20.pdf.
- 30. [January 8, 2014];Human KIM-1 Elisa Kit. Available at http://www.aviscerabioscience.com/Product_Systems/KIM-1/SK00186-01_avbs.pdf.
- 31.SAS software Http://www.Sas.Com/. The data analysis for this paper was generated using SAS software, Version 9.2 of the SAS System for Windows. Copyright © 2002-2008 SAS Institute Inc. SAS and all other SAS Institute Inc. product or service names are registered trademarks or trademarks of SAS Institute Inc., Cary, NC, USA.
- 32.Minitab 15 Statistical Software . [Computer software] Minitab, Inc.; State College, PA: 2007. ( www.minitab.com) [Google Scholar]
- 33.Belcher JM, Sanyal AJ, Peixoto AJ, et al. Kidney biomarkers and differential diagnosis of patients with cirrhosis and acute kidney injury. Hepatology. 2013 doi: 10.1002/hep.26980. [DOI] [PMC free article] [PubMed] [Google Scholar]
- 34. [January 15, 2014];The History of Poiseuille's Law. Available at http://www.annualreviews.org/doi/pdf/10.1146/annurev.fl.25.010193.000245.
- 35.Tublin ME, Tessler FN, Murphy ME. Correlation between renal vascular resistance, pulse pressure, and the resistive index in isolated perfused rabbit kidneys. Radiology. 1999;213:258–64. doi: 10.1148/radiology.213.1.r99oc19258. [DOI] [PubMed] [Google Scholar]
- 36.Leslie SH, Johnston B, Ralli EP. Renal function as a factor in fluid retention in patients with cirrhosis of the liver. J Clin Invest. 1951;30:1200–7. doi: 10.1172/JCI102539. [DOI] [PMC free article] [PubMed] [Google Scholar]
- 37.Koeppen BM, Stanton BA. Glomerular Filtration and Renal Blood Flow. In: Koeppen BM, Stanton BA, editors. Renal Physiology. 4th ed. Mosby; Philadelphia: 2007. pp. 31–46. [Google Scholar]
- 38.Hall JE. Urine Formation by the Kidneys. In: Hall JEGA, editor. Guyton and Hall textbook of medical physiology. 12th ed. Saunders/Elsevier; Philadelphia, PA: 2011. pp. 303–322. [Google Scholar]
- 39.Bossard G, Bourgoin P, Corbeau JJ, Huntzinger J, Beydon L. Early detection of postoperative acute kidney injury by Doppler renal resistive index in cardiac surgery with cardiopulmonary bypass. British journal of anaesthesia. 2011;107:891–8. doi: 10.1093/bja/aer289. [DOI] [PubMed] [Google Scholar]
- 40.Knapp R, Plotzeneder A, Frauscher F, et al. Variability of Doppler parameters in the healthy kidney: an anatomic-physiologic correlation. J Ultrasound Med. 1995;14:427–9. doi: 10.7863/jum.1995.14.6.427. [DOI] [PubMed] [Google Scholar]
- 41.Rivolta R, Maggi A, Cazzaniga M, et al. Reduction of renal cortical blood flow assessed by Doppler in cirrhotic patients with refractory ascites. Hepatology. 1998;28:1235–40. doi: 10.1002/hep.510280510. [DOI] [PubMed] [Google Scholar]


