Abstract
The temperature-dependent property of the Grueneisen parameter has been employed in photoacoustic imaging mainly to measure tissue temperature. Here we explore this property using a different approach and develop Grueneisen-relaxation photoacoustic microscopy (GR-PAM), a technique that images non-radiative absorption with confocal optical resolution. GR-PAM sequentially delivers two identical laser pulses with a micro-second-scale time delay. The first laser pulse generates a photoacoustic signal and thermally tags the in-focus absorbers. Owing to the temperature dependence of the Grueneisen parameter, when the second laser pulse excites the tagged absorbers within the thermal relaxation time, a photoacoustic signal stronger than the first one is produced. GR-PAM detects the amplitude difference between the two co-located photoacoustic signals, confocally imaging the non-radiative absorption. We greatly improved axial resolution from 45 µm to 2.3 µm and at the same time slightly improved lateral resolution from 0.63 µm to 0.41 µm. In addition, the optical sectioning capability facilitates the measurement of the absolute absorption coefficient without fluence calibration.
Introduction
Confocal microscopy has broad applications in life science, semiconductor inspection, and materials science. It offers better optical resolution and a higher signal-to-background ratio than wide-field microscopy [1]. However, confocal microscopic contrast has been limited to back-scattering and fluorescence; it cannot image non-radiative absorption contrast with sufficient sensitivity. Most molecules, especially those in biological tissues, absorb photons at certain wavelengths and generate heat via non-radiative relaxation, but only a few produce strong radiative contrasts such as fluorescence. Hence, the ability to image non-radiative absorption contrast can extend microscopy to broader applications.
The recent development of optical-resolution photoacoustic microscopy (OR-PAM) has enabled imaging with absorption contrasts [2–5]. However, like wide-field optical microscopy, OR-PAM lacks optically defined axial resolution when imaging planar objects—i.e., objects wider than the lateral resolution. Two-photon absorption has been explored in OR-PAM to achieve better axial resolution [6]. Yet, it is challenging to effectively separate the two-photon photoacoustic (PA) signal from the predominant single-photon signal.
In this letter, we explore a phenomenon in PA imaging, which we call the Grueneisen relaxation effect. This effect describes the change of the Grueneisen parameter within the thermal relaxation time following a laser impulse excitation. Although it is well known that the Grueneisen parameter is temperature dependent, it has not been widely explored in photoacoustic imaging, except for measuring tissue temperature. Here, in order to address the aforementioned challenges in confocal microscopy and OR-PAM, we developed Grueneisen-relaxation photoacoustic microscopy (GR-PAM), which enables imaging non-radiative absorbers with confocal resolution. GR-PAM sequentially excites absorbers with two identical laser pulses. The first laser pulse generates a PA signal and thermally tags the absorbers. Owing to the Grueneisen relaxation effect, the second laser pulse generates a stronger PA signal than the first one. GR-PAM detects the amplitude difference between the two PA signals, achieving optically confocal imaging, with greatly improved axial resolution and slightly improved lateral resolution as well. In addition, taking advantage of the optical sectioning capability, GR-PAM can measure the optical absorption coefficient without fluence calibration, which has been a challenge in quantitative PA tomography [7–13].
Principle
In GR-PAM, two identical nanosecond laser pulses are sequentially delivered with a sub-microsecond delay. The first pulse generates an initial pressure rise p01:
| (1) |
where Γ0 is the Grueneisen parameter at the baseline temperature, ηth is the heat conversion efficiency, μa is the optical absorption coefficient, and F is the optical fluence. The Grueneisen parameter depends on the local temperature, following an approximated linear function [14–16].
Notably, the temperature rise responsible for the initial pressure rise also alters the local Grueneisen parameter. Within the thermal relaxation time of the first laser pulse, we excite the same absorbers with the second laser pulse, which generates another initial pressure rise p02:
| (2) |
where b is a coefficient that relates the thermal energy absorbed from the first pulse to the Grueneisen parameter change at the time of the second laser excitation.
We assume that the optical fluence follows a 2D Gaussian distribution in the lateral directions. The PA amplitude induced by the first laser pulse PA1 can be derived from the spatial integration of p01:
| (3) |
where k is a constant related to the PA detection sensitivity, E is the pulse energy, and w is the waist of the Gaussian beam. Here we assume that the spatial integration in the z-axis direction can be decoupled from the integrations in the lateral (x, y) directions and contributes only to the detection sensitivity k.
Similarly, the PA amplitude induced by the second laser pulse can be written as
| (4) |
The right-hand side of Eq. 4 has two parts. The first part is the same as PA1. The second part is generated jointly from the first pulse’s Grueneisen relaxation effect and the second pulse’s excitation.
Subtracting Eq. 3 from Eq. 4, we obtain the GR-PAM signal:
| (5) |
For a planar target with an uniform μa, the GR-PAM signal becomes
| (6) |
The Gaussian beam waist varies with the distance z from the focus in a relationship of
| (7) |
where w0 is the beam waist at the focus, and zR is the Rayleigh range. When z = ±zR, the GR-PAM signal amplitude decreases by half of that when the beam is focused at the absorber plane. Hence the axial full width at half maximum (FWHM) of a planar target is twice the optical Rayleigh range, giving GR-PAM optical sectioning capability. In comparison, the OR-PAM signal amplitude from a planar target is PA1 = kΓ0ηthμaE, which does not depend on the focal distance. Therefore, conventional OR-PAM cannot provide optical sectioning for planar targets.
The lateral resolution of GR-PAM can be estimated by scanning a point target in the x-y plane. In such a case, GR-PAM generates a two-dimensional image, expressed by
| (8) |
The point spread function of the GR-PAM follows a 2D Gaussian distribution with a waist of . In comparison, OR-PAM gives an image described by , which has a waist of w. Therefore, the lateral resolution of GR-PAM is better than that of OR-PAM by .
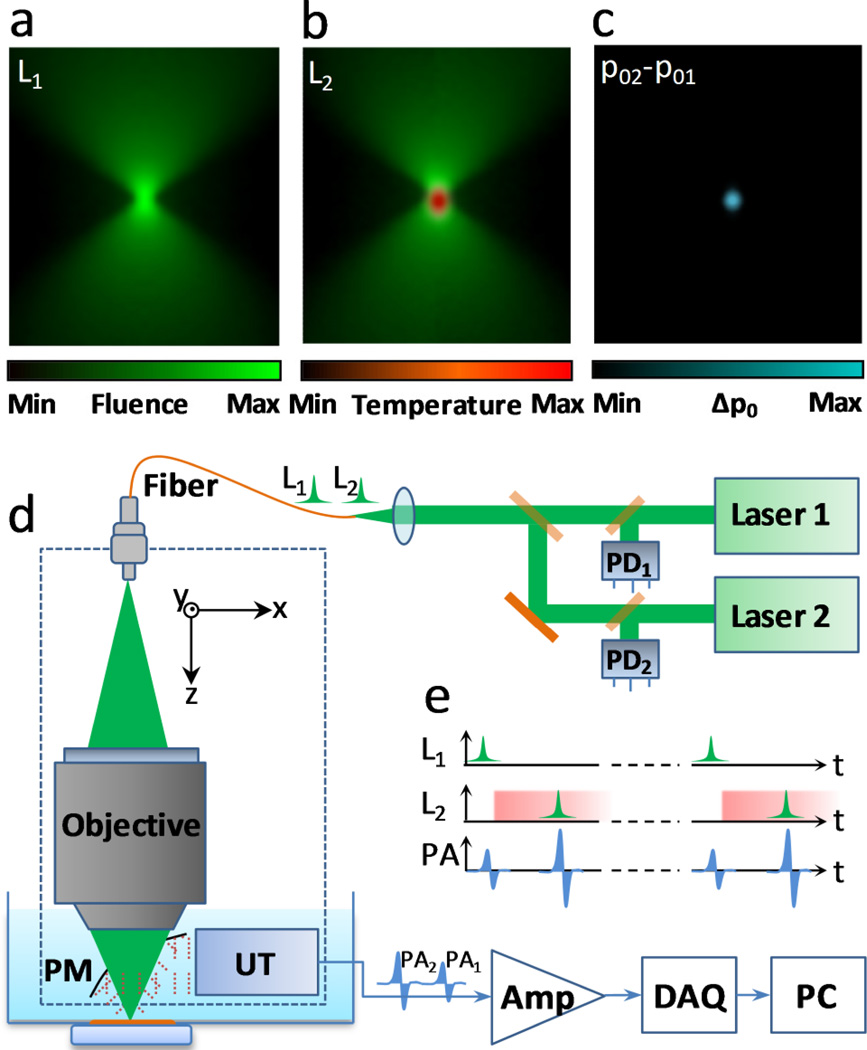
GR-PAM is analogous to nonlinear microscopy techniques. In GR-PAM, the first laser pulse thermally tags absorbers. Since the fluence in the optical focus zone is much higher than that out of the focal zone, only absorbers within the focal zone can be effectively tagged. The second laser pulse excites the same absorbers. The Grueneisen relaxation effect allows the two temporally separated but spatially co-located laser pulses to jointly act on the same absorbers and produce an increased signal. The differential operation, subtracting the first signal from the second one, rejects the non-tagged PA signals and results in the quadratic dependence on fluence, analogous to other nonlinear effects such as two-photon absorption. Typical optical fluence distributions, the residual temperature rise, and a differential pressure distribution are illustrated in Fig. 1a–c.
Fig. 1.
(a) Fluence distribution for laser pulse 1 (L1). (b) Residual temperature rise from laser pulse 1 and fluence distribution of laser pulse 2 (L2). (c) Differential pressure rise induced by the Grueneisen relaxation effect. (d) Schematic of a GR-PAM system. Amp, 40-dB broadband amplifier; DAQ, high-speed digitizer; p01, initial pressure rise from the first laser pulse; p02, initial pressure rise from the second laser pulse; Δp0 = p02 − p01; PC, computer; PD1 and PD2, photodiodes 1 and 2; PM, parabolic mirror; UT, ultrasonic transducer.
Experimental setup
Fig. 1d is a schematic of a GR-PAM system. Two pulsed lasers (532 nm, 1 ns pulse duration, SPOT 100-200-532, Elforlight) are sequentially triggered with a sub-microsecond delay. Fig. 1e shows the temporal relationship among the laser triggers and the PA signals. Both lasers operate at a 10 kHz pulse repetition rate, and their pulse energies are calibrated by two photodiodes. The two laser beams are spatially aligned and coupled into a single-mode fiber connected to a PA probe [17]. The PA probe employs a 0.63 numerical aperture (NA) objective to focus the laser beam. The optical depth of focus (i.e., focal zone) is estimated to be 2.4 µm (1.8λ / NA2, where λ = 532 nm). A parabolic mirror with a center opening transmits light and reflects the ultrasonic waves to a custom-made ultrasonic transducer (53-MHz central frequency, 94% bandwidth). The optical objective and the parabolic mirror both focus to the same spot to optimize the PA detection sensitivity. The detailed design of the PA probe is available in the Reference [17]. The output of the ultrasonic transducer is amplified by 40 dB, digitized at 500 MHz, and recorded in a computer. At each position, two PA signals are recorded. The computer and an FPGA card (PCI-7830R, National Instruments) control a three-axis motorized stage (PLS-85, PI miCos GmbH) to perform three-dimensional scanning. Using this system, the Grueneisen relaxation effect was experimentally validated as shown in the supplementary materials.
Measurement of lateral and axial resolutions
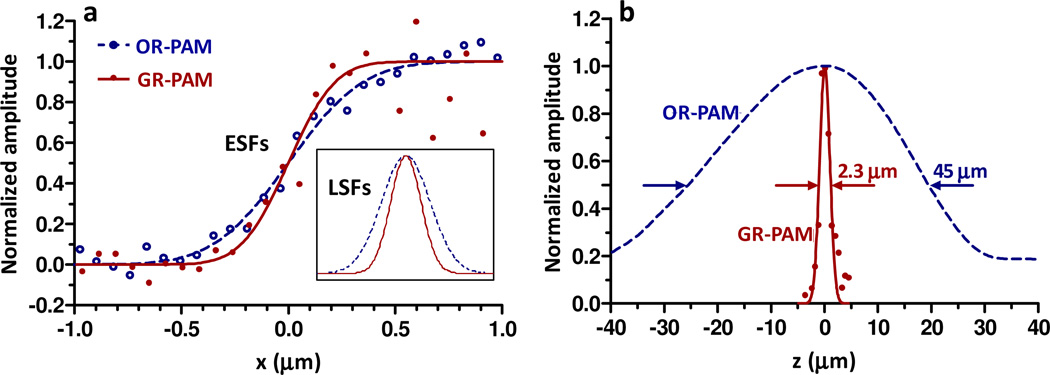
Lateral resolution was measured by imaging a sharp ink edge on a cover glass. The edge spread function (ESF) of the GR-PAM was obtained by scanning across the sharp edge (Fig. 2a). For comparison, the ESF of the OR-PAM was computed from the PA signal of the first laser pulses. Derivation of the ESFs gives the line spread functions (LSFs, inset in Fig. 2a). The FWHM of the LSF quantifies the lateral resolution. The lateral resolutions of OR-PAM and GR-PAM were 0.65 µm and 0.41 µm, respectively. Therefore, the lateral resolution was improved by a factor of 1.6, close to the theoretical prediction of .
Fig. 2.
(a) Lateral profiles of a sharp ink edge measured by OR-PAM and GR-PAM. OR-PAM has a lateral resolution of 0.65 µm, while GR-PAM has a lateral resolution of 0.41 µm. ESFs, edge spread functions; LSFs, line spread functions. (b) Axial profiles of OR-PAM and GR-PAM. The FWHM of the OR-PAM profile is 45 µm. The FWHM of the GR-PAM profile is 2.3 µm.
Axial resolution was estimated by scanning perpendicular to a monolayer of RBCs. At each axial position, the peak-to-peak amplitude of the differential PA signal was recorded to form a 1D depth-resolved image of the GR-PAM, which was fitted to a Gaussian function. As shown in Fig. 2bThe FWHM of the Gaussian curve is 2.3 µm, which is close to the theoretical prediction of 2.4 µm. For comparison, the A-line of the OR-PAM was obtained by converting a time-resolved PA signal into a depth-resolved signal with the known sound speed in water. We calculated the envelope of the OR-PAM A-line using the Hilbert transformation. The FWHM of the envelope is 45 µm. Clearly, GR-PAM provides an optical axial resolution much higher than the current acoustic axial resolution in this system. Here we should note that the acoustic resolution of 45 µm is not the limit for all OR-PAM systems. Other axial resolution quantification methods might give a finer acoustic axial resolution [17]. Higher frequency ultrasonic transducers and deconvolution algorithm have been utilized to achieve higher acoustically defined axial resolution at the cost of signal-to-noise ratio [18, 19]. Nevertheless, GR-PAM provides a unique approach to achieve optically defined axial resolution, whose novel imaging and sensing capabilities are demonstrated in the following two experiments.
Optically sectioned imaging of red blood cells
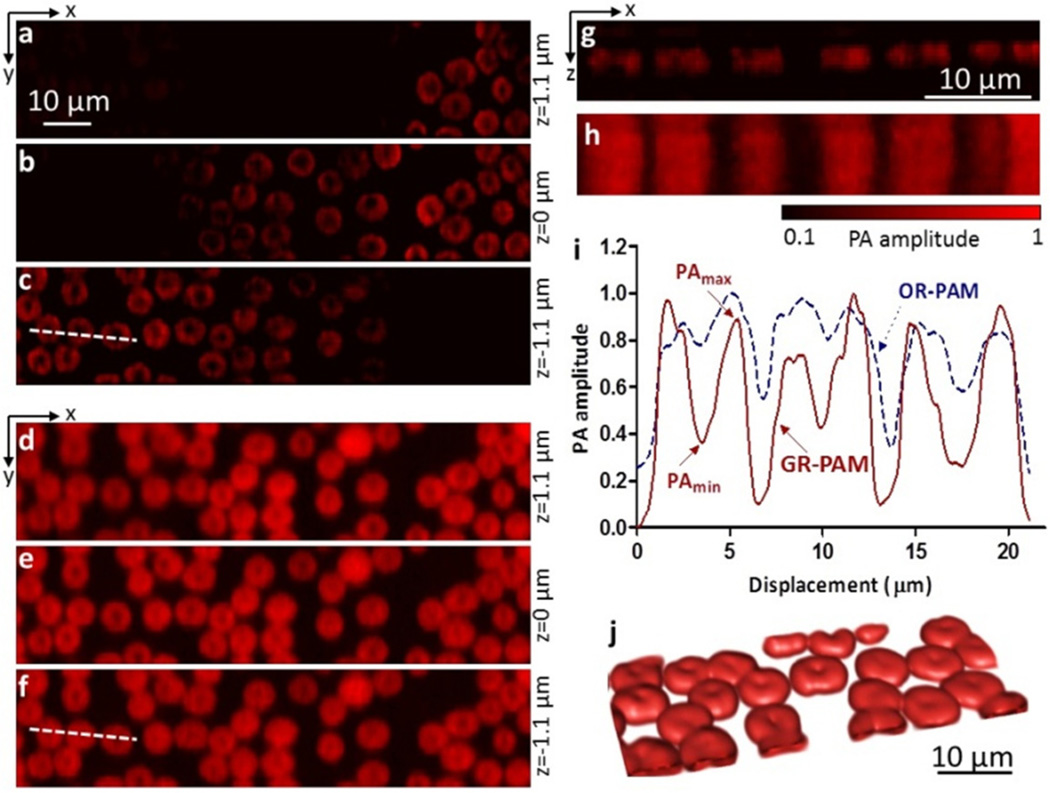
Figs. 3a–c show GR-PAM images of a monolayer of RBCs placed at different axial positions. The average laser pulse energy was 25 nJ. As the RBCs moved out of optical focus, the GR-PAM signals quickly decreased, demonstrating optical sectioning. Supplementary Video 1 is a movie of optically sectioned imaging of the RBC sample. Figs. 3d–f present OR-PAM images of the same sample. The OR-PAM signals did not show obvious changes when scanning the sample along the axial direction. Figs. 3g–h present GR-PAM and OR-PAM side-view images in the x-z plane. With optical axial resolution, a small tilt angle of the sample slide was clearly imaged using GR-PAM. In addition to the improvement in axial resolution, GR-PAM also enhanced image contrast. The doughnut-feature contrast was quantified as c = (PAmax − PAmin) / PAmax, where PAmin is the smallest pixel value in the doughnut feature, and PAmax is the nearest peak value around the doughnut center, as shown in Fig. 3i. GR-PAM shows clearer features of the doughnut-shaped red blood cells than OR-PAM, and it increased the average contrast by a factor of 4.2. Fig. 3j shows a volumetric GR-PAM image of red blood cells. The volumetric image is interpolated four times in the z-axis direction. Supplementary Video 2 shows a rotating volumetric GR-PAM image of the RBC sample.
Fig. 3.
(a–c) Optically sectioned GR-PAM images of red blood cells at three depths. (d–f) Optically sectioned OR-PAM images of the same sample as in (a–c). (g) A side-view GR-PAM image of red blood cells in the x-z plane. (h) A side-view OR-PAM image of the same sample as in (g). (i) PA profiles along the dashed lines in (c) and (f). The contrasts of the doughnut-shaped features were measured in GR-PAM and OR-PAM images. Based on measurements from 9 RBCs, the contrast of GR-PAM is 0.46±0.04, while the contrast of OR-PAM is 0.11±0.03 (mean ± standard error). The average ratio between the contrasts is 4.2. (j) Volumetric GR-PAM image of red blood cells.
Calibration-free measurement of absolute absorption coefficient
Measuring optical absorption coefficient is the key to determine molecular concentrations. In conventional PA imaging, in order to determine the absolute absorption coefficient, we need to calibrate the local optical fluence. However, the calibration is challenging due to optical scattering and shadowing. Owing to its optical sectioning capability and absorption contrast, GR-PAM enables the quantification of the absolute absorption coefficient without fluence calibration.
According to Beer’s law, optical energy decays exponentially with the optical path length. In an absorption-dominant sample, the optical energy E can be approximated as an exponential function of light path length. According to Eq. 5, the GR-PAM signal is proportional to the square of the optical energy. When scanning the GR-PAM focus along the z-axis, the GR-PAM signal becomes:
| (9) |
where E0 is the pulse energy on the absorber surface, and absorption coefficient is assumed to be uniform. Eq. 9 shows that the GR-PAM signal is an exponential function of penetration depth. The decay constant is twice the absolute absorption coefficient. Although the laser pulse energy at the absorber surface (E0) may change due to either shadowing from other absorbers or scattering, the exponential decay constant of the GR-PAM signal will not be affected[20, 21]. Therefore, the absorption coefficient can be determined without fluence calibration. Note that Eqs. 9 was derived based on a collimated beam. For a focused beam with 0.63 NA, we numerically computed the decay constant in Eq. 9, which was 2.14 multiplied by the absorption coefficient. This correction factor was used in our experiments.
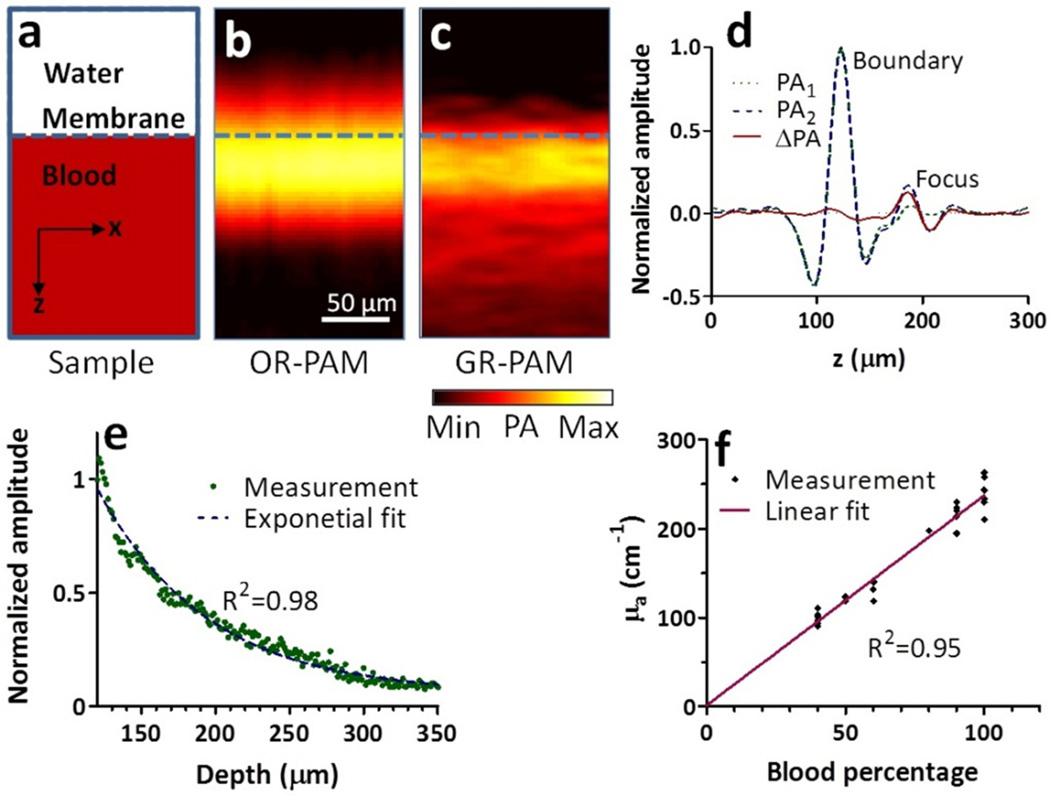
Fig. 4a shows a diagram of a thick oxygenated bovine blood sample imaged with an average laser pulse energy of 15 nJ. The OR-PAM image in Fig. 4b shows good contrasts only on the boundary due to the limited ultrasonic bandwidth. The GR-PAM image in Fig. 4c shows clear signals beyond the boundary. Two depth-resolved PA signals and their difference are shown in Fig. 4d, where the optical focus was placed 60 µm below the boundary. The two PA signals were almost identical at the boundary, but were obviously different at the focus due to the Grueneisen relaxation effect.
Fig. 4.
(a) Diagram of a thick blood sample. (b) An OR-PAM cross-sectional image. (c) A GR-PAM cross-sectional image. (d) Time-resolved PA signals from the two laser pulses and the differential PA signal. The focus was 60 µm below the blood surface. (e) Exponential decay of GR-PAM amplitude along depth. (f) Measured absolute absorption coefficient versus set absorption coefficient.
Fig. 4e plots the GR-PAM signal decreasing with depth. The data was fitted to Eq. 9 with a corrected decay constant to calculate the absolute absorption coefficient. By diluting the blood sample into different concentrations, we measured different absorption coefficients. The results agree well with the actual absorption coefficients measured with a spectrophotometer. For example, the actual absorption coefficient of 100% blood at 532 nm was measured to be 234 cm−1, which validated the GR-PAM measurement of 240±8 cm−1.
Discussion
Non-radiative relaxation is a primary energy conversion mechanism in most light-matter interactions. Label-free imaging of these non-radiative absorbers may help diagnose and monitor many diseases such as cancer. The Grueneisen relaxation effect, as a natural result of non-radiative relaxation and temperature dependence of primarily thermal expansion coefficient, exists in many materials, such as water, aqueous solutions, and soft biological tissues. PA signals are inherently sensitive to the local Grueneisen parameter. The combination of the Grueneisen relaxation effect and PA detection enables high-resolution label-free PA imaging of many endogenous absorbers, such as hemoglobin, lipid, melanin, DNA/RNA, protein, or water [22–26]. Although the specificity of single-wavelength label-free imaging might not be as high as a fluorescence-labeled counterpart, multiple wavelengths may be used to spectrally separate primary absorbers.
GR-PAM requires pulse energy similar to that of conventional OR-PAM. Since the differential PA signal amplitude is proportional to the residual temperature, a good PA signal from the first laser pulse ensures effective thermal tagging. Note that the differential operation in GR-PAM decreases the signal-to-noise ratio (SNR). In addition, when applying GR-PAM to in vivo tissues or living cells, the tolerable sustained temperature rise cannot be higher than one to several degrees, which is another limiting factor for high SNR. Modulated thermal tagging may be used to improve SNR in the future. Averaging or more sensitive ultrasound detection might also address this issue to some extent.
In terms of light exposure, the average laser power of GR-PAM is twice as high as that in OR-PAM due to the second laser pulse. If cumulative heating starts to approach the damage threshold, the laser pulse energy can be reduced at the expense of SNR. Unlike conventional OR-PAM, the GR-PAM signal is proportional to the square of the optical absorption coefficient. Thus we can use the square root of the GR-PAM signal if a linear mapping of the absorption coefficient is desired.
The dual-laser system in GR-PAM can be further simplified by splitting a single laser pulse into two and delaying one pulse. The time delay between the two laser pulses should be shorter than the thermal relaxation time so that the thermal tagging by the first laser pulse can significantly affect the second PA magnitude. The point-by-point depth scanning prolongs data acquisition, which might be mitigated by increasing the laser repetition rate and the scanning speed.
Using dual-pulse laser excitations and a high-NA PA probe, GR-PAM improve the axial resolution from the acoustic scale to the optical depth of focus, and the lateral resolution was improved by . Besides its improved resolutions, GR-PAM also enables measurement of the absolute absorption coefficient without calibration of the local optical fluence. We notice that acoustic-scale axial resolution has recently been pushed to several microns using either deconvolution or a high frequency ultrasonic transducer [18, 19]. However, the optical sectioning capability provided by GR-PAM still shows salient advantages, such as not requiring high-frequency transducers or a model-based algorithm, and it can also measure absolute absorption coefficients without fluence calibration. In addition, we hope this exploration of the Grueneisen relaxation effect can inspire more applications in PA imaging and sensing.
Supplementary Material
Acknowledgements
The authors appreciate Prof. James Ballard’s help with editing the manuscript, and thank Dr. Amos Danielli, Junjie Yao, Lijun Ma, Arie Krumholz, and Yan Liu for constructive discussions and experimental assistance. This work was sponsored by NIH grants DP1 EB016986 (NIH Director’s Pioneer Award), R01 CA186567 (NIH Director’s Transformative Research Award), and R01 CA159959. Lihong Wang has a financial interest in Microphotoacoustics, Inc. and Endra, Inc., which, however, did not support this work.
References
- 1.Conchello J-A, Lichtman JW. Nat Meth. 2005;2:920. doi: 10.1038/nmeth815. [DOI] [PubMed] [Google Scholar]
- 2.Maslov K, et al. Opt. Lett. 2008;33:929. doi: 10.1364/ol.33.000929. [DOI] [PubMed] [Google Scholar]
- 3.Wang L, et al. Opt. Lett. 2011;36:139. doi: 10.1364/OL.36.000139. [DOI] [PMC free article] [PubMed] [Google Scholar]
- 4.Yao J, et al. Journal of Biomedical Optics. 2012;17:080505. doi: 10.1117/1.JBO.17.8.080505. [DOI] [PMC free article] [PubMed] [Google Scholar]
- 5.Wang L, Maslov K, Wang LV. Proceedings of the National Academy of Sciences. 2013 [Google Scholar]
- 6.Yamaoka Y, Nambu M, Takamatsu T. Opt. Express. 2011;19:13365. doi: 10.1364/OE.19.013365. [DOI] [PubMed] [Google Scholar]
- 7.Cox BT, et al. Applied Optics. 2006;45:1866. doi: 10.1364/ao.45.001866. [DOI] [PubMed] [Google Scholar]
- 8.Maslov K, Zhang HF, Wang LV. Inverse Problems. 2007;23:S113. [Google Scholar]
- 9.Cox BT, Laufer JG, Beard PC. SPIE BiOS: Biomedical Optics (International Society for Optics and Photonics. 2009:717713. [Google Scholar]
- 10.Wang L, et al. Journal of Biomedical Optics. 2012;17:1060071. [Google Scholar]
- 11.Daoudi K, et al. Optics Express. 2012;20:14117. doi: 10.1364/OE.20.014117. [DOI] [PubMed] [Google Scholar]
- 12.Rosenthal A, Razansky D, Ntziachristos V. Medical Imaging, IEEE Transactions on. 2009;28:1997. doi: 10.1109/TMI.2009.2027116. [DOI] [PubMed] [Google Scholar]
- 13.Wang L, Maslov K, Wang LV. Proceedings of the National Academy of Sciences. 2013;110:5759. doi: 10.1073/pnas.1215578110. [DOI] [PMC free article] [PubMed] [Google Scholar]
- 14.Irina VL, Kirill VL, Rinat OE. Journal of Physics D: Applied Physics. 2005;38:2633. [Google Scholar]
- 15.Gao L, et al. Journal of Biomedical Optics. 2013;18:026003. [Google Scholar]
- 16.Shah J, et al. Journal of Biomedical Optics. 2008;13:034024. doi: 10.1117/1.294036. [DOI] [PMC free article] [PubMed] [Google Scholar]
- 17.Zhang C, et al. Journal of Biomedical Optics. 2012;17:0205011. doi: 10.1117/1.JBO.17.2.020501. [DOI] [PMC free article] [PubMed] [Google Scholar]
- 18.Zhang C, et al. Journal of Biomedical Optics. 2012;17:116016. doi: 10.1117/1.JBO.17.11.116016. [DOI] [PMC free article] [PubMed] [Google Scholar]
- 19.Zhang C, et al. Applied Physics Letters. 2013;102:163702. doi: 10.1063/1.4803444. [DOI] [PMC free article] [PubMed] [Google Scholar]
- 20.Guo Z, Hu S, Wang LV. Opt. Lett. 2010;35:2067. doi: 10.1364/OL.35.002067. [DOI] [PMC free article] [PubMed] [Google Scholar]
- 21.Guo Z, et al. Journal of Biomedical Optics. 2012;17:066011. doi: 10.1117/1.JBO.17.6.066011. [DOI] [PMC free article] [PubMed] [Google Scholar]
- 22.Zhang HF, et al. Nat Biotech. 2006;24:848. doi: 10.1038/nbt1220. [DOI] [PubMed] [Google Scholar]
- 23.Wang B, et al. Opt. Lett. 2012;37:1244. doi: 10.1364/OL.37.001244. [DOI] [PubMed] [Google Scholar]
- 24.Oh J-T, et al. Journal of Biomedical Optics. 2006;11:034032. [Google Scholar]
- 25.Yao D-K, et al. Opt. Lett. 2010;35:4139. doi: 10.1364/OL.35.004139. [DOI] [PMC free article] [PubMed] [Google Scholar]
- 26.Xu Z, Li C, Wang LV. Journal of Biomedical Optics. 2010;15:036019. doi: 10.1117/1.3443793. [DOI] [PMC free article] [PubMed] [Google Scholar]
Associated Data
This section collects any data citations, data availability statements, or supplementary materials included in this article.


