

Abstract
Aims:
Hypoxia has adverse effects on renal development. This study was the first to test hypoxia-induced renal autophagy in rat fetuses.
Methods:
Pregnant rats were exposed to hypoxia or normoxia during pregnancy and fetal kidneys were collected at gestation day 21.
Results:
Fetal kidney weight and ratio of kidney–body weight were reduced. Histological analysis showed enlargement in Bowman space and wider space between interstitia in the kidneys of fetus exposed to hypoxia. Fetal renal B-cell lymphoma 2 (BCL-2) was decreased accompanied with higher 2′-deoxyuridine 5′-triphosphate nick end-labeling staining and unchanged soluble FAS in the hypoxia group. Hypoxia increased autophagic structures, including autophagosomes and autolysosomes, in fetal kidneys and increased renal APG5L. There was an increase in renal LC3-II, Beclin 1, p-S6, hypoxia inducible factor 1α (HIF-1a), and ratio of LC3-II–LC3-I and a decrease in P62, protein kinase B (AKT), and phosphorylated AKT in the hypoxia group. Both renal mammalian target of rapamycin (mTOR) and Beclin 1 signaling were upregulated.
Conclusion:
Hypoxia-affected fetal renal development was associated with renal apoptosis and Beclin 1 signaling-mediated autophagy.
Keywords: hypoxia, autophagy, rat fetus, kidney
Introduction
Sufficient oxygen is necessary for fetal development, and in utero hypoxia can induce adverse effects on fetal development.1–5 A number of environmental and maternal factors, including high altitudes, smoking, anemia, preeclampsia, pulmonary diseases, and placental dysfunction or umbilical cord problems, can cause intrauterine hypoxia.6–8 In turn, hypoxia in utero plays critical roles in inducing fetal growth restriction (FGR)9 and affecting the development of fetal important organs such as the kidney.10,11
Previous studies showed that nephrogenesis could be disturbed by intrauterine hypoxia, leading to a low nephron endowment.11 Moreover, intrauterine hypoxia influenced the fetal renin–angiotensin system and fetal renal hemodynamic.12 The renal development could be significantly affected by prenatal insults. For example, malnutrition during pregnancy could cause abnormal development of the kidney and reduced number of nephron.13,14 However, how hypoxia during pregnancy impacts on fetal renal development is still unclear. The present study paid special attention on that topic.
In search for mechanisms of renal hypogenesis from exposure to adverse intrauterine environment, previous work demonstrated the roles of apoptosis.15–18 Apoptosis and autophagy are important in embryos development.19 Apoptosis, which is known as type I programmed cell death (PCD), plays an important role in nephrogenesis.15,20 Recent studies showed that apoptosis was adversely involved in renal development.21–23 Whether autophagy, type II PCD, also contributes to impairment of nephrogenesis remains unknown. Furthermore, there is no information on whether intrauterine hypoxia may affect autophagy in the fetal kidney. Thus, the present study investigated whether and how autophagy occurred in the fetal kidney following hypoxia.
There are 2 important signaling pathways in the regulation of autophagy. One is hypoxia inducible factor 1α (HIF-1α)/Bcl2/adenovirusE1B19kD interacting protein 3 (BNIP3)/Beclin 1 pathway and the other is phosphoinositide-3-kinase (PI3K)/protein kinase B (AKT)/mammalian target of rapamycin (mTOR).24 The present study examined the key elements in both signaling pathways associated with renal developmental problems. Together, the present study tested the hypothesis that chronic hypoxia during pregnancy may adversely affect renal development related to renal autophagy in the rat fetus, aiming at ascertaining (1) the pathophysiological changes in vivo in the kidneys of term fetal rats following exposure to hypoxia; (2) the chronic prenatal hypoxia’s effects on apoptosis and autophagy in the kidneys; and (3) the mechanisms and pathways of autophagy in these kidneys. The data gained provided novel information on hypoxia-induced renal developmental risks and the related mechanisms for kidney health problems in fetal origins.
Methods
Experimental Animals and Hypoxia
All procedures and protocols used were approved by the Institutional Animal Care Committee and followed the guidelines by the National Institutes of Health. Time-dated pregnant Sprague-Dawley rats were obtained from Experimental Animal Center of Soochow University and randomly divided into 2 groups: (1) normoxia (21.0% O2) as the control and (2) continuous hypoxic exposure (10.5% O2) from day 4 to 21 of gestation. The animals were housed individually in acrylic cages. Hypoxia was achieved and maintained by mixture of nitrogen gas and air. The flow of nitrogen was adjusted to bring the percentage of oxygen in each hypoxic chamber to 10.5%, which was continuously monitored with an oxygen analyzer (S-450; IST-AIM, Texas). The normoxia group was housed with just air flowing through the chambers. Food and water were provided as desired. Pregnant dams were anesthetized with sodium pentobarbital (100 mg/kg, intraperitoneal) at gestational day (GD) 21. A small cut was made at the middle of abdomen of maternal rats. Fetuses were removed and weighed immediately. Fetal blood samples were collected in anticoagulation tube following decapitation, then fetal kidneys were isolated and weighed. Blood samples were centrifuged, and serum was used for measurements of albumin (ALB), uric acid (UA), creatinine (CRE), and urea nitrogen (BUN) using the enzyme colorimetric method.
The renal tissue of fetal rats was homogenized with 0.9% NaCl (10 mL/g), enzyme inhibitors contained 0.3 mmol/L Na2-edetic acid, 0.3 mmol/L dimercarptanol, and 0.3 mmol/L oxine sulfate. The homogenates were boiled and centrifuged, and the supernatant extract was collected and sent to Sinouk Institute of Biological Technology (Beijing, China) for soluble FAS (sFAS) and APG5L analyses by radioimmunoassay. The assays and data were handled in a blind manner.
Histological Analysis
For tissue slide preparation, the kidneys were longitudinally divided into 2 halves and fixed in 10% formalin. The fixed kidneys were embedded in paraffin and cut in 6 μm sections, then treated with 2 changes of xylene, 10 minutes each, and rehydrated in descending alcohol (absolute alcohol for 5 minutes, 95%, 85%, and 75% alcohol for 1 minute, sequentially). After washing in distilled water, sections were stained in hematoxylin solution for 5 minutes, counterstaining was done in eosin–phloxine B solution for 2 minutes. The sections were dehydrated through alcohol solutions and cleared in phenol xylene. The slices were diagnosed with a Nikon L150 microscope (Nikon, Japan) by experienced pathologists at Pathology Lab of Soochow University in a blinded manner. Images were captured with an attached SPOT digital imaging system.
Transmitted Electron Microscopy
Renal samples for electron microscopy were fixed with 2% glutaraldehyde and dehydrated in a graded series of alcohol, then embedded in Epon 812 (sigma, USA). Ultrathin sections were cut with an ultramicrotome (Ultract N; Reichert-Nissei, Tokyo Japan), followed by addition of 2% uranyl acetate and lead citrate and then photographed under a Hitachi Hu-12A transmission electron microscope (Tokyo, Japan).
DNA Fragmentation
The 2′-deoxyuridine 5′-triphosphate nick end-labeling (TUNEL) technique was used to discriminate apoptotic nuclei by the terminal deoxynucleotidyl transferase (TdT)-mediated TUNEL technique (One Step TUNEL Apoptosis Assay Kit; Beyotime). The sections were incubated in dark moist boxes for 60 minutes at 37°C with TdT to label-free 3′-OH DNA termini with digoxigenin nucleotides, and the reaction was stopped by immersing the slide in wash buffer for 10 minutes at room temperature. After 3 phosphate-buffered saline washes, the slices were observed under fluorescence microscopy.
Western Blotting Analysis
The tissues of kidneys were cut into pieces and homogenized in lysis buffer containing 20 mmol/L hydroxyethyl piperazineethanesulfonic acid, 10 mmol/L KCl, 1.5 mmol/L MgCl2, 1 mmol/L EDTA, 1 mmol/L dithiothreitol, 1 mmol/L phenylmethylsulfonyl fluoride, and 2 g/mL aprotinin, pH 7.4, followed by incubation on ice for 30 minutes. The homogenates were ultrasonicated, followed by centrifugation (Eppendorf model 5417R, Eppendorf, Hamburg) at 12 000 revolutions/min for 15 minutes at 4°C. Samples with equal protein (80 μg) were loaded on polyacrylamide gel and separated by electrophoresis at 100 V. Proteins were then transferred onto nitrocellulose membranes.
Nonspecific binding was blocked in Tris-buffered saline + 0.2% Tween-20 containing 5% dry milk for 2 hours at room temperature. The membranes were incubated with primary polyclonal antibody LC3 (1:800; Abcam, Cambridge), p62 (1:1000; American Research Products, Belmont, Massachusetts), HIF-1α (1:1000; Abcam, Cambridge), Beclin 1 (1:500; Santa Cruz Biotech, Santa Cruz), p-S6 (1:300; Santa Cruz Biotech, Santa Cruz), B-cell lymphoma 2 (BCL-2; 1:1000; Millipore, Millipore, Temecula), protein kinase B (AKT; 1:1000; Abcam, Cambridge), and phosphorylated AKT (p-AKT; 1:1000; Abcam, Cambridge) overnight at 4°C. The membranes were then incubated with secondary horseradish peroxidase-conjugated goat antirabbit antibody (1:4000). Protein bands were visualized with enhanced chemiluminescence reagents, and the blots were exposed to Hyperfilm (Amersham Biosciences, Uppsala, Sweden). Relative density of bands was normalized to β-actin as a control. Results were quantified by the Kodak electrophoresis documentation and analysis system with Kodak ID image analysis software (Eastman Kodak company, Rochester).25
Statistical Analysis
All data from experiments were expressed as means ± standard error of the means. Differences were evaluated for statistical significance (P < .05) by t test or 2-way analysis of variance followed by Tukey test, where appropriate.
Results
Renal Function Assay
There was no difference in fetal ALB, UA, and CRE between the normoxia and hypoxia groups. However, fetal serum BUN was higher in the hypoxia group than that of the control (Table 1).
Table 1.
Fetal Serum Values.a
| Control | Hypoxia | |
|---|---|---|
| CRE, μmol/L | 61.48 ± 1.46 | 61.89 ± 1.28 |
| UA, μmol/L | 152.41 ± 11.95 | 153.2 ± 9.75 |
| BUN, mmol/L | 5.11 ± 0.328 | 6.24 ± 0.32b |
| ALB, g/L | 22.67 ± 1.90 | 22.84 ± 1.31 |
Abbreviations: ALB, albumin; BUN, urea nitrogen; CRE, creatinine; UA, uric acid.
a Control (n = 15) and hypoxia (n = 16).
b P < .05.
The Effect of Chronic Hypoxia on Fetal Kidney Weight and Body Weight
Maternal chronic hypoxia significantly decreased fetal body weight (3.741 ± 0.066 vs 2.477 ± 0.095 g, n = 90-93, from 8 mothers each group, P < .05). There was significant difference in fetal kidney weight between the control and the hypoxic animals (34.320 ± 2.338 vs 21.590 ± 1.947 mg, P < .05). The ratio of kidney-to-body weight in the hypoxia fetuses was significantly reduced (9.234 ± 0.099 vs 7.459 ± 0.144 mg/g, P < .05; Figure 1).
Figure 1.
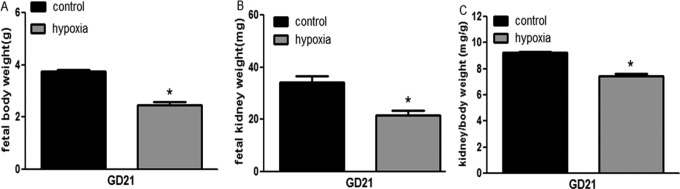
Fetal kidney, body weight, and ratio of kidney–body weight at gestation day (GD) 21 following exposure to hypoxia. *, P < .05.
Histological Changes
Compared with the control, the histological changes in the fetal kidney of the hypoxia group were mainly located in the cortical zone, including the glomeruli and interstitium. No significant changes were observed in the medullary zone of the kidneys. The notable histological changes included that the interstitium was much wider and the cells in the interstitium increased in hypoxia fetal kidneys (Figure 2A and B). In the glomeruli, the Bowman space was obviously enlarged, while the sizes of the solid parts in the glomeruli were reduced in the fetuses exposed to hypoxia (Figure 2C and D). Under microscopy, it appeared that the number of glomeruli (Figure 2A and B) and parenchymal cells in glomeruli (Figure 2C and D) was decreased in the hypoxia group.
Figure 2.

The fetal renal cortex showed immature glomeruli (nonvascularized) in the cortical periphery and mature (vascularized) glomeruli mostly in the deep cortex in all groups (A and C: control; B and D: hypoxia. A and B: ×10; C and D: ×40). The interstitium in the hypoxia group was much wider than that of the control, and cells in the interstitium was obviously increased (A and B). The Bowman space was enlarged, while the size of the solid core of the glomeruli was reduced, and the number of parenchymal cells of partial glomeruli was decreased in the fetuses exposed to hypoxia (C and D). Solid arrow: immature glomeruli; open arrow: mature glomeruli; dotted line arrow: the Bowman space. IN indicates interstitium.
The Effect of Chronic Hypoxia on Apoptosis
The chronic hypoxia-induced apoptosis was analyzed by sFAS assay, Western blotting analysis of BCL-2 protein, as well as TUNEL staining. There was no difference in fetal renal sFAS as an inhibitor of apoptosis between the normoxia and the hypoxia groups (2.44 ± 0.19 vs 2.55 ± 0.18 ng/mL, P > .05; Figure 3). Chronic prenatal hypoxia decreased BCL-2 protein (Figure 4) in the fetal kidney. The TUNEL staining showed that the positive-stained cells increased greatly, indicating an increase in dead cells (Figure 5).
Figure 3.
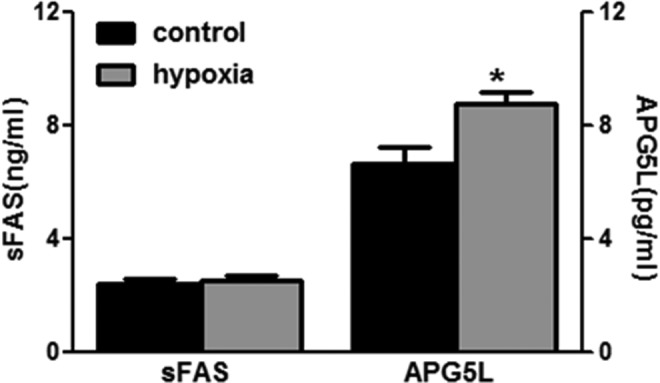
Fetal renal soluble FAS (sFAS) and APG5L. Control (n = 15) and hypoxia (n = 16). *, P < .05.
Figure 4.

The effect of chronic hypoxia on signaling proteins of autophagy and apoptosis in the fetal kidney. *, P < .05.
Figure 5.
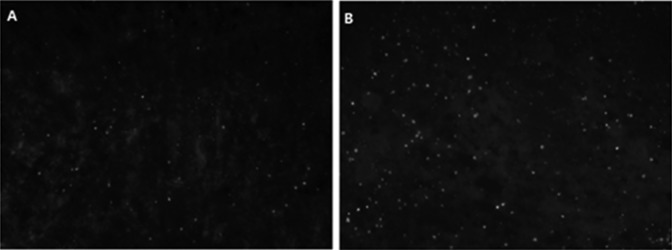
The number of apoptosis cells apparently increased with the enhanced number of positive 2′-deoxyuridine 5′-triphosphate nick end-labeling (TUNEL) staining (white dots, ×20) in the fetal kidneys following hypoxia. A, Control and (B) hypoxia.
The Effect of Chronic Hypoxia on Autophagy
Autophagic vacuoles in renal tissue with transmitted electron microscopy
Podocyte foot process was flat and decreased in the glomeruli of the hypoxic fetuses (Figure 6A and B). Transmitted electron microscopy (TEM) also showed that vacuolar structures containing cytoplasm were clearly encircled by double membrane structures, resembling autophagosomes and autophagolysosome, in podocytes in the hypoxia group. There was rare or no autophagosome or autophagolysosome in the control. The mitochondria were swollen and deformed in the hypoxic group (Figure 6C and D).
Figure 6.

High magnification of transmitted electron microscopy (TEM) showing structures of autophagosomes (AP), autolysosomes (AL), and mitochondria (M) in the fetal kidney. A and B, Glomerulus (scale bars: 2 μm); C and D, podocyte (scale bars: 0.5 μm). A and C, Control; B and D, hypoxia. Black arrow: podocyte foot process; arrow with white surrounding: autolysosomes (AL). PC indicates podocyte.
The autophagic proteins in the fetal kidney
To further determine the autophagic activity in the fetal kidney, we examined the key proteins in the renal tissue. Fetal renal LC3-II (16 KD) was increased, while LC3-I (18 KD) unchanged in the hypoxia group. The ratio of LC3-II–LC3-I was also increased (Figure 7). The expression levels of renal p62 protein, a well-known autophagic substrate, were significantly decreased in the hypoxia fetus. There was an increase in fetal renal APG5L in the hypoxia groups compared to the control (6.65 ± 0.62 vs 8.74 ± 0.42 pg/mL, P < .05; Figure 3).
Figure 7.
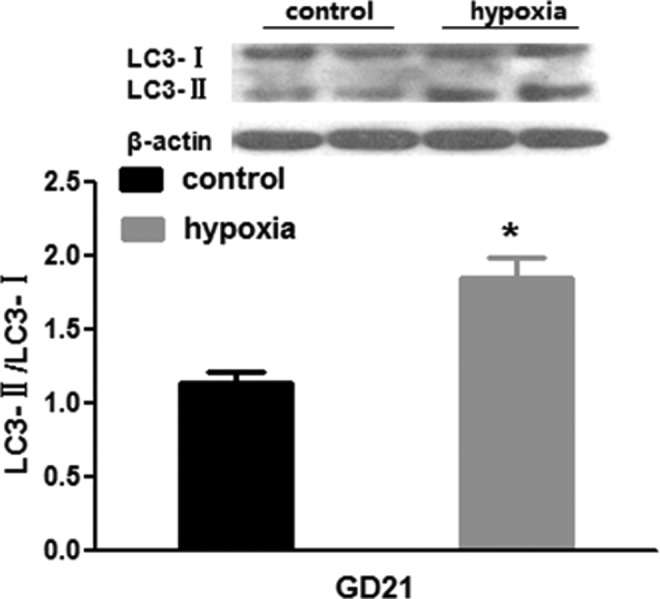
Fetal renal autophagic protein (LC3) following exposure to hypoxia. *, P < .05.
The autophagic-related signaling proteins in the fetal kidney
HIF-1α/BNIP3/Beclin 1 and PI3K/AKT/mTOR are 2 important signaling pathways of autophagy. We measured the levels of S6 phosphorylation, a downstream target of mTORC1 that is frequently used as an in vivo indicator for mTORC1 activity. Prenatal hypoxia upregulated Beclin 1 and p-S6 (Figure 4). Analysis showed that the total amount of HIF-1α protein in the fetal kidney was significantly increased following chronic exposure to hypoxia during pregnancy, while levels of renal AKT and p-AKT protein were decreased in the hypoxic fetuses (Figure 4).
Discussion
Although previous studies have shown that hypoxia in utero could result in developmental problems, including growth restriction of fetuses and fetal important organs,1–5 underlying mechanisms for hypoxia-induced renal problems are unknown. To the best of our knowledge, this study is the first to investigate renal autophagy in the fetus exposed to hypoxia and demonstrates that chronic prenatal hypoxia had a negative influence on the fetal renal development, which is likely associated with an upregulated renal autophagy in the fetal kidney, and the possible mechanism involved may include the Beclin 1 pathway.
In the present study, percentage levels of fetal Po 2 and oxygen saturation at GD21 were significantly altered in the hypoxia environment as previously reported,26 indicating fetal hypoxia occurred in utero. Hypoxia caused a significant decrease in fetal body weight. Given that maternal food intake and body weight in the hypoxic group were not significantly decreased,27 the FGR observed in the present study was likely caused by hypoxia. In the present study, the hypoxia also resulted in a decrease in fetal kidney weight and the ratio of kidney-to-body weight. It has been shown that fetal hypoxia resulted in a decrease in amniotic fluid production and redistribution of fetal blood flow accompanied with a decrease in perfusion to the kidney.28 In the present study, histological changes were observed in kidneys of the fetuses following hypoxia. Those renal changes included wider interstitium, enlarged Bowman space, flat and decreased podocyte foot process, and swelling and deformed mitochondria, suggesting an increased risk in the development of renal diseases. In addition, fetal renal functions were evaluated by determination of blood ALB, UA, BUN, and CRE. We found that fetal serum BUN was higher in the hypoxia than that of the normoxia, indicating possibility of injured renal functions.
In determination of the mechanisms for prenatal insults-induced fetal renal problems, recent studies have demonstrated that apoptosis may contribute to reduced nephron number during the early periods of development by environmental or in utero insults.23,27,29 Both Welham et al30 and Vehaskari et al29 used experimental models of low-protein diets to induce FGR and demonstrated increased renal apoptosis that may be related to the poor development of nephrons. Other study showed that uteroplacental insufficiency could cause apoptosis in the kidney in the full-term FGR.23 In mediating the formation of condensations of cells that are “committed” to differentiated structures, BCL-2 has been suggested particularly important.31 In the present study, BCL-2 protein was significantly decreased in the fetal kidney by the hypoxia, indicating hypoxia-induced apoptosis in the kidney. FAS is a widely expressed membrane-anchored protein that can induce apoptosis.32 Soluble FAS, generated by alternative messenger RNA splicing, can antagonize cell–surface FAS functions by combination with FAS ligand (FASL). The present study showed no changes in sFAS levels in the fetal kidney, which at least suggested that the possibility for sFAS/FASL pathway involved in the hypoxia-induced apoptosis in the fetal kidney was weak. It appeared that a decreased renal BCL-2 protein might play an important role in the hypoxia-induced apoptosis in the fetal kidney. The TUNEL staining showed that the positive-stained cells were significantly increased in the fetal kidney in the hypoxia fetus, indicating apoptosis in the fetal kidney, and an increase in dead cells could be one of the reasons for the observed histological changes.
There is a complex cross talk between autophagy and apoptosis.12 Recent studies showed that despite the marked differences between these 2 processes, their regulation is intimately connected, and the same regulators can sometimes control both apoptosis and autophagy.
Autophagy is a key mechanism in various pathophysiological processes, including development, tumorigenesis, cell death, and survival.33,34 When cells encounter environmental stresses, such as nutrient starvation, oxidative stress, hypoxia, radiation, pathogen infection, or anticancer drug treatments, the level of autophagy can be dramatically augmented as a cytoprotective response, resulting in adaptation and survival.33,34 However, dysregulated or excessive autophagy may lead to cell death directly. In the present study, we assayed autophagic changes in the fetal kidney following the hypoxia, using TEM and Western blot analysis. As indicated earlier, since this was the pioneering study on fetal renal autophagy caused by the hypoxia, following novel data were achieved: the hypoxia increased renal LC3-II, while decreased p62, in the fetus. LC3 is a mammalian homolog of yeast Apg8 that initially yields a cytosolic form LC3-I, which is converted to LC3-II during the formation of autophagosomes.35 LC3-II is the only known protein which is recruited to both inner and external surfaces of the expanding autophagosomal membranes and specifically associates with autophagosomes and not with any other vesicular structures. As a signaling hub, p62 coordinates the processes required for metabolic homeostasis. Recently, p62 protein has been suggested to interact with ubiquitinated proteins and LC3, which may regulate the selective autophagic clearance of protein aggregates.36 The present study showed that the hypoxia affected the fetal renal autophagic proteins. The hypothesis of upregulation of autophagy was further supported by morphological changes observed with TEM testing. Autophagosomes and autophagolysosomes of podocytes were significantly increased in the hypoxic fetus. Autophagosome is the morphological hallmark of autophagy. Transmitted electron microscopy is an effectual and important method for both qualitative and quantitative analyses of changes in various autophagic structures such as autophagosome and autolysosome.37 In the present study, hypoxia resulted in an increase in APG5L (autophagy-related gene 5 [ATG5]) in the fetal kidney. ATG5 has been characterized as a factor required for autophagy38 and demonstrated a direct interaction between Atg5 and Atg16 crucial to process of autophagy.39
HIF-1α/BNIP3/Beclin 1 and PI3K/AKT/mTOR are 2 important signaling pathways involved in the regulation of autophagy. Either the active HIF-1α/BNIP3/Beclin 1 or the inhibition of PI3K/AKT/mTOR pathways can upregulate autophagy.24 Therefore, we examined both pathways in the present study. Following exposure to hypoxia, there was a significant increase in the levels of Beclin 1 and HIF-1α. Beclin 1 (Atg6) is a key protein shown to be involved in the regulation of autophagy.40 Several studies41–44 indicated that hypoxia could selectively induce autophagy of mitochondria but not endoplasmic reticulum, and that HIF-1α-mediated expression of BNIP3 played an important role in the induction of hypoxia-induced mitochondrial autophagy by interfering the interaction of Beclin 1 with BCL-2. Another important autophagic pathway is mTOR. Mammalian target of rapamycin that downregulates autophagy45 is an conserved protein kinase and forms 2 functional complexes, termed mTOR complex (mTORC) 1 and mTORC2.46 Mammalian target of rapamycin complex 1 regulates cellular processes including cell growth, proliferation, and autophagy in response to nutrients such as amino acids, glucose, and growth factors.47 To examine mTORC1 activity in glomerular cells, we measured the levels of S6 phosphorylation, a downstream target of mTORC1 that is used as an in vivo indicator for mTORC1 activity. The activated mTOR signaling can inhibit autophagy. In the present study, p-S6 protein was increased by the hypoxia, while the upstream proteins of mTOR such as AKT and p-AKT were decreased. The decrease in AKT and p-AKT was supposed to lead to a decrease in mTOR. However, the present study showed an opposite response, a significant increase instead of decrease in p-S6, indicating a reduction in activity of mTOR pathway. To confirm this unexpected result, we repeated the experiments again and again under experimental conditions, including change in the antibodies and their working concentrations, incubation time, and temperatures. The result was still consistent and confirmed. Then we speculated that there might exist another unknown upstream signaling affected by the hypoxia and eventually upregulated mTOR. Although mTOR pathway could be excluded for the renal autophagy in the present study, it appears that the hypoxia upregulated autophagy in the fetal kidney may mainly rely on the Beclin 1 signaling pathway. The upregulated mTOR signaling, which could be against autophagy, maybe a negative-feedback loop as a cell’s self-protective mechanism. This opens new opportunities for further investigation.
Autophagy mediates degradation and recycling of cytoplasmic constituents to maintain cellular homeostasis. In response to stress, autophagy could act as a mechanism for cell survival while it may also induce cell death under certain conditions.48 Gozuacik et al49 suggested that autophagy might serve as a second cell-killing mechanism that acted in concert with apoptosis to trigger kidney damage in tunicamycin-treated mice. Under hypoxic conditions, cultured human kidney 2 (HK-2) cells showed autophagic cell death, and inhibition of autophagy by 3-methyladenine or treatment with a mixture of lysosomal inhibitors protected HK-2 cells from cell death.16 The present study demonstrated both apoptosis and autophagy involved in the developmental kidney of the fetus exposed to the hypoxia. Cross-regulation between autophagy and apoptosis raises an interesting possibility that signaling activated during autophagy may interfere with or compromise cell death pathways.19,50,51 The data gained provided opportunities to speculate that the autophagy might cooperate with apoptosis in adversely affecting renal development by the hypoxia in the fetus.
The discovery that hypoxia in utero causes hypogeneis of the kidneys, death of certain renal cells, and reduction in renal functions may have important medical implications. In humans, various pathophysiological conditions during pregnancy may cause a reduction in oxygen supply to or borderline hypoxia in the fetus. As the body ages, there are significant losses of renal mass and functions. Thus, it merits further study on longer term effects of low fetal oxygen supply using rats.
In summary, the present study demonstrated that prenatal hypoxia adversely affected the renal development in the fetus as evidenced with decreased fetal kidney weight and ratio of kidney-to-body weight, which was supported by the finding in the histological changes and renal apoptosis. Most importantly, in the determination of the underlying mechanisms, the present study showed fetal renal autophagy associated with hypoxia-induced apoptosis, and the Beclin 1 signaling pathway, not mTOR pathway, might play a critical role in the hypoxia-produced autophagy in the fetal kidney. The novel data gained provide important information for the possible targets in future study of early prevention of renal diseases induced by prenatal insults in developmental origins.
Acknowledgments
The authors thank Department of Forensic Medicine, Soochow University for Technical Assistance. We would like to thank technical assistance from Encode Genomics Bio-Technology Co., Ltd.
Footnotes
Declaration of Conflicting Interests: The author(s) declared no potential conflicts of interest with respect to the research, authorship, and/or publication of this article.
Funding: The author(s) disclosed receipt of the following financial support for the research, authorship, and/or publication of this article: Supported partly by grants (2012CB947600 and 2013BAI04B05), NSFC (81070540, 81030006, 81320108006, 81370714, 81100431, and 81370719), Jiangsu Key Discipline/Laboratory and “Chuang Xin Tuan Dui” funds, and Jiangsu Province’s Key Discipline of Human Assisted Reproduction Medicine funds.
References
- 1. Tapanainen PJ, Bang P, Wilson K, Unterman TG, Vreman HJ, Rosenfeld RG. Maternal hypoxia as a model for intrauterine growth retardation: effects on insulin-like growth factors and their binding proteins. Pediatr Res. 1994;36(2):152–158. [DOI] [PubMed] [Google Scholar]
- 2. Peyronnet J, Dalmaz Y, Ehrstrom M, et al. Long lasting adverse effects of prenatal hypoxia on developing autonomic nervous system and cardiovascular parameters in rats. Pflugers Arch. 2002;443(5-6):858–865. [DOI] [PubMed] [Google Scholar]
- 3. Ream M, Ray AM, Chandra R, Chikaraishi DM. Early fetal hypoxia leads to growth restriction and myocardial thinning. Am J Physiol Regul Integr Comp Physiol. 2008;295(2):R583–R595. [DOI] [PMC free article] [PubMed] [Google Scholar]
- 4. Xue Q, Zhang L. Prenatal hypoxia causes a sex-dependent increase in heart susceptibility to ischemia and reperfusion injury in adult male offspring: role of protein kinase C epsilon. J Pharmacol Exp Ther. 2009;330(2):624–632. [DOI] [PMC free article] [PubMed] [Google Scholar]
- 5. Rueda-Clausen CF, Dolinsky VW, Morton JS, Proctor SD, Dyck JR, Davidge ST. Hypoxia-Induced intrauterine growth restriction increases the susceptibility of rats to high-fat diet-induced metabolic syndrome. Diabetes. 2011;60(2):507–516. [DOI] [PMC free article] [PubMed] [Google Scholar]
- 6. Hickey RJ, Clelland RC, Bowers EJ. Maternal smoking, birth weight, infant death, and the self-selection problem. Am J Obstet Gynecol. 1978;131(7):805–811. [DOI] [PubMed] [Google Scholar]
- 7. Cogswell ME, Yip R. The influence of fetal and maternal factors on the distribution of birth weight. Semin Perinatol. 1995;19(3):222–240. [DOI] [PubMed] [Google Scholar]
- 8. Moore LG, Brodeur P, Chumbe O, D’Brot J, Hofmeister S, Monge C. Maternal hypoxic ventilatory response, ventilation and birth weight at 4,300 m. J Appl Physiol. 1986;60(4):1401–1406. [DOI] [PubMed] [Google Scholar]
- 9. Regnault TRH, Vrijer BD, Galan HL, Wilkening RB, Battaglia FC, Meschia G. Development and mechanisms of fetal hypoxia in severe fetal growth restriction. Placenta. 2007;28(7):714–723. [DOI] [PubMed] [Google Scholar]
- 10. Mao CP, Hou JQ, Ge JY, et al. Changes of renal AT 1/AT 2 receptors and structures in ovine fetuses following exposure to long-term hypoxia. Am J Nephrol. 2010;31(2):141–150. [DOI] [PMC free article] [PubMed] [Google Scholar]
- 11. Gonzalez-Rodriguez PJ, Tong W, Xue Q, Li Y, Hu S, Zhang LV. Fetal hypoxia results in programming of aberrant angiotensin II receptor expression patterns and kidney development. Int J Med Sci. 2013;10(5):532–538. [DOI] [PMC free article] [PubMed] [Google Scholar]
- 12. Allam HI, Rahman TA. The protective role of adrenomedullin and anti-tumor necrosis factor on some vasoregulatory factors and renal functions in hypertensive pregnant rats. Kingdom of Saudi Arabia King Abdulaziz City for Science and Technology General Directorate of Research Grants Programs LGP-10-19 final report. 2009:43–78. [Google Scholar]
- 13. Langley-Evans SC, Welham SJ, Jackson AA. Fetal exposure to a maternal low protein diet impairs nephrogenesis and promotes hypertension in the rat. Life Sci. 1999;64(11):965–974. [DOI] [PubMed] [Google Scholar]
- 14. Lloyd LJ, Foster T, Rhodes P, Rhind SM, Gardner DS. Protein-energy malnutrition during early gestation in sheep blunts fetal renal vascular and nephron development and compromises adult renal function. J Physiol. 2012;590(pt 2):377–393. [DOI] [PMC free article] [PubMed] [Google Scholar]
- 15. Koseki C, Herzlinger D, Al-Awqati Q. Apoptosis in metanephric development. J Cell Biol. 1992;119(5):1327–1333. [DOI] [PMC free article] [PubMed] [Google Scholar]
- 16. Welham SJ, Wade A, Woolf AS. Protein restriction in pregnancy is associated with increased apoptosis of mesenchymal cells at the start of rat metanephrogenesis. Kidney Int. 2002;61(4):1231–1242. [DOI] [PubMed] [Google Scholar]
- 17. Dziarmaga A, Eccles M, Goodyer P. Suppression of ureteric bud apoptosis rescues nephron endowment and adult renal function in Pax2 mutant mice. J Am Soc Nephrol. 2006;17(6):1568–1575. [DOI] [PubMed] [Google Scholar]
- 18. Narlis M, Grote D, Gaitan Y, Boualia SK, Bouchard M. Pax2 and Pax8 regulate branching morphogenesis and nephron differentiation in the developing kidney. J Am Soc Nephrol. 2007;18(4):1121–1129. [DOI] [PubMed] [Google Scholar]
- 19. Thorburn A. Apoptosis and autophagy: regulatory connections between two supposedly different processes. Apoptosis. 2008;13(1):1–9. [DOI] [PMC free article] [PubMed] [Google Scholar]
- 20. Coles HS, Burne JF, Raff MC. Large-scale normal cell death in the developing rat kidney and its reduction by epidermal growth factor. Development. 1993;118(3):777–784. [DOI] [PubMed] [Google Scholar]
- 21. Sorenson CM. Life, death and kidneys: regulation of renal programmed cell death. Curr Opin Nephrol Hypertens. 1998;7(1):5–12. [DOI] [PubMed] [Google Scholar]
- 22. Woolf AS, Welham SJ. Cell turnover in normal and abnormal kidney development. Nephrol Dial Transplant. 2002;17(suppl 9):2–4. [DOI] [PubMed] [Google Scholar]
- 23. Pham TD, MacLennan NK, Chiu CT, Laksana GS, Hsu JL, Lane RH. Uteroplacental insufficiency increases apoptosis and alters p53 gene methylation in the full-term IUGR rat kidney. Am J Physiol. 2003;285:R962–R970. [DOI] [PubMed] [Google Scholar]
- 24. He CC, Klionsky DJ. Regulation mechanisms and signaling pathways of autophagy. Annu Rev Genet. 2009;43:67–93. [DOI] [PMC free article] [PubMed] [Google Scholar]
- 25. Shi LJ, Mao CP, Wu JW, Morrissey P, Lee JX, Xu ZC. Effects of i.c.v. losartan on the angiotensin II-mediated vasopressin release and hypothalamic fos expression in near-term ovine fetuses. Peptides. 2006;27(9):2230–2238. [DOI] [PubMed] [Google Scholar]
- 26. Yang WL, Mao CP, Xia F, et al. Changed salt appetite and central angiotensin II-induced cellular activation in rat offspring following hypoxia during fetal stages. Peptides. 2010;31(6):1177–1183. [DOI] [PMC free article] [PubMed] [Google Scholar]
- 27. Murotsuki J, Challis JR, Han VK, Frahe LJ, Gagnon R. Chronic fetal placental embolization and hypoxemia cause hypertension and myocardial hypertrophy in fetal sheep. Am J Physiol. 1997;272(1 pt 2):R201–R207. [DOI] [PubMed] [Google Scholar]
- 28. Luzi G, Bori S, Iammarino G, et al. Functional aspects of the fetal urinary apparatus in relation to growth. Arch Ital Urol Androl. 1996;68(5 suppl):9–12. [PubMed] [Google Scholar]
- 29. Vehaskari VM, Aviles DH, Manning J. Prenatal programming of adult hypertension in the rat. Kidney Int. 2001;59(1):238–245. [DOI] [PubMed] [Google Scholar]
- 30. Welham SJ, Wade A, Woolf AS. Protein restriction in pregnancy is associated with increased apoptosis of mesenchymal cells at the start of rat metanephrogenesis. Kidney Int. 2002;61:1231–1242. [DOI] [PubMed] [Google Scholar]
- 31. LeBrun DP, Warnke RA, Cleary ML. Expression of bcl-2 in fetal tissues suggests a role in morphogenesis. Am J Pathol. 1993;142(3):743–753. [PMC free article] [PubMed] [Google Scholar]
- 32. Lee P, Sata M, Lefer DJ, Factor SM, Walsh K, Kitsis RN. Fas pathway is a critical mediator of cardiac myocyte death and myocardial infarction during ischemia–reperfusion in vivo. Am J Physiol Heart Circ Physiol. 2003;284(2):H456–H463. [DOI] [PubMed] [Google Scholar]
- 33. Mizushima N, Levine B, Cuervo AM, Klionsky DJ. Autophagy fights disease through cellular self-digestion. Nature. 2008;451(7182):1069–1075. [DOI] [PMC free article] [PubMed] [Google Scholar]
- 34. Rubinsztein DC. The roles of intracellular protein degradation pathways in neurodegeneration. Nature. 2006;443(7113):780–786. [DOI] [PubMed] [Google Scholar]
- 35. Mizushima N, Yoshimori T, Levine B. Methods in mammalian autophagy research. Cell. 2010;140(3):313–326. [DOI] [PMC free article] [PubMed] [Google Scholar]
- 36. Ichimura Y, Kumanomidou T, Sou YS, et al. Structural basis for sorting mechanism of p62 in selective autophagy. J Biol Chem. 2008;283(33):22847–22857. [DOI] [PubMed] [Google Scholar]
- 37. Ylä-Anttila P, Vihinen H, Jokitalo E, Eskelinen EL. Monitoring autophagy by electron microscopy in Mammalian cells. Methods Enzymol. 2009;452:143–164. [DOI] [PubMed] [Google Scholar]
- 38. Codogno P, Meijer AJ. Atg5: more than an autophagy factor. Nat Cell Biol. 2006;8(10):1045–1047. [DOI] [PubMed] [Google Scholar]
- 39. Matsushita M, Suzuki NN, Obara K, Fujioka Y, Ohsumi Y, Inagaki F. Structure of Atg5·Atg16, a complex essential for autophagy. J Biol Chem. 2007;282(9):6763–6772. [DOI] [PubMed] [Google Scholar]
- 40. Clark RS, Bayir H, Chu CT, Alber SM, Kochanek PM, Watkins SC. Autophagy is increased in mice after traumatic brain injury and is detectable in human brain after trauma and critical illness. Autophagy. 2008;4(1):88–90. [DOI] [PubMed] [Google Scholar]
- 41. Maiuri MC, Le Toumelin G, Criollo A, et al. Functional and physical interaction between Bcl-XL and a BH3-like domain in Beclin-1. EMBO J. 2007;26(10):2527–2539. [DOI] [PMC free article] [PubMed] [Google Scholar]
- 42. Oberstein A, Jeffrey PD, Shi YG. Crystal structure of the Bcl-XL-Beclin 1 peptide complex: Beclin 1 is a novel BH3-only protein. J Biol Chem. 2007;282(17):13123–13132. [DOI] [PubMed] [Google Scholar]
- 43. Maiuri MC, Criollo A, Tasdemir E, et al. BH3-only proteins and BH3 mimetics induce autophagy by competitively disrupting the interaction between Beclin-1 and Bcl-2/Bcl-X(L). Autophagy. 2007;3(4):374–376. [DOI] [PubMed] [Google Scholar]
- 44. Zhang HF, Bosch-Marce M, Shimoda LA, et al. Mitochondrial autophagy is an HIF-1-dependent adaptive etabolic response to hypoxia. J Biol Chem. 2008;283(16):10892–10903. [DOI] [PMC free article] [PubMed] [Google Scholar] [Retracted]
- 45. Noda T, Ohsumi Y. Tor, a phosphatidylinositol kinase homologue, controls autophagy in yeast. J Biol Chem. 1998;273(7):3963–3966. [DOI] [PubMed] [Google Scholar]
- 46. Wullschleger S, Loewith R, Hall MN. TOR signaling in growth and metabolism. Cell. 2006;124(3):471–484. [DOI] [PubMed] [Google Scholar]
- 47. Codogno P, Meijer AJ. Autophagy and signaling: their role in cell survival and cell death. Cell Death Differ. 2005;12 Suppl 2:1509–1518. [DOI] [PubMed] [Google Scholar]
- 48. Hay N, Sonenberg N. Upstream and downstream of mTOR. Genes Dev. 2004;18(16):1926–1945. [DOI] [PubMed] [Google Scholar]
- 49. Gozuacik D, Bialik S, Raveh T, et al. DAP-kinase is a mediator of endoplasmic reticulum stress-induced caspase activation and autophagic cell death. Cell Death Differ. 2008;15(12):1875–1886. [DOI] [PubMed] [Google Scholar]
- 50. Levine B, Yuan J. Autophagy in cell death: an innocent convict? J Clin Invest. 2005;115(10):2679–2688. [DOI] [PMC free article] [PubMed] [Google Scholar]
- 51. Maiuri MC, Zalckvar E, Kimchi A, Kroemer G. Self-eating and self-killing: crosstalk between autophagy and apoptosis. Nat Rev Mol Cell Biol. 2007;8(9):741–752. [DOI] [PubMed] [Google Scholar]