

Abstract
The view that the carotid body (CB) type I cells are direct physiological sensors of hypoglycaemia is challenged by the finding that the basal sensory neuronal outflow from the whole organ is unchanged in response to low glucose. The reason for this difference in viewpoint and how the whole CB maintains its metabolic integrity when exposed to low glucose is unknown. Here we show that, in the intact superfused rat CB, basal sensory neuronal activity was sustained during glucose deprivation for 29.1 ± 1.2 min, before irreversible failure following a brief period of excitation. Graded increases in the basal discharge induced by reducing the superfusate  led to proportional decreases in the time to the pre-failure excitation during glucose deprivation which was dependent on a complete run-down in glycolysis and a fall in cellular energy status. A similar ability to withstand prolonged glucose deprivation was observed in isolated type I cells. Electron micrographs and immunofluorescence staining of rat CB sections revealed the presence of glycogen granules and the glycogen conversion enzymes glycogen synthase I and glycogen phosphorylase BB, dispersed throughout the type I cell cytoplasm. Furthermore, pharmacological attenuation of glycogenolysis and functional depletion of glycogen both significantly reduced the time to glycolytic run-down by ∼33 and 65%, respectively. These findings suggest that type I cell glycogen metabolism allows for the continuation of glycolysis and the maintenance of CB sensory neuronal output in periods of restricted glucose delivery and this may act as a key protective mechanism for the organ during hypoglycaemia. The ability, or otherwise, to preserve energetic status may thus account for variation in the reported capacity of the CB to sense physiological glucose concentrations and may even underlie its function during pathological states associated with augmented CB discharge.
Key points
The carotid body has been proposed to be an acute sensor of hypoglycaemia, although conflicting data exist regarding the ability of hypoglycaemia to stimulate the carotid body directly. The reason for these discrepancies is not known.
In an in vitro, freshly isolated, intact rat carotid body preparation, chemoafferent function was unaffected and protected against metabolic injury for 30 min exposure to glucose deprivation.
Glycogen granules and glycogen conversion enzymes were identified in type I cells and targeting of glycogenolysis or functional glycogen depletion both caused a more rapid run-down of glycolysis during glucose deprivation.
This shows that glycogen maintains carotid body sensory neuronal output in periods of restricted glucose delivery to protect the metabolic integrity of the organ during hypoglycaemia.
The preservation of energetic status may account for the variation in the reported capacity of the carotid body to sense physiological glucose concentrations.
Introduction
The mammalian carotid body (CB) is a highly specialised, neural crest-derived, peripheral sensory organ that responds acutely to a number of important stress stimuli that have classically included hypoxia, hypercapnia and acidosis (Kumar & Prabhakar, 2012). Stimulation of the CB and activation of adjacent sensory neurones induces a series of well-characterised reflex responses including hyperventilation, tachycardia and systemic vasoconstriction that promotes corrective regulation of arterial blood gases and the maintenance of adequate metabolism in the brain and vital organs (Kumar, 2009). Chronic up-regulation of the CB sensory neuronal activity as occurs during obstructive sleep apnoea (Lesske et al. 1997) is emerging as an important driving force in establishing the raised arterial blood pressure associated with type II diabetes (Ribeiro et al. 2013) as well as chronic heart failure (Schultz et al. 2013), sleep disordered breathing (Narkiewicz et al. 1998) and spontaneous hypertension (McBryde et al. 2013).
The CB also has an important role in re-establishing normal plasma glucose concentrations in response to systemic hypoglycaemia (Alvarez-Buylla & de Alvarez-Buylla, 1988; Koyama et al. 2000; Wehrwein et al. 2010). CB regulation of glucose homeostasis is dependent on an augmentation in the sensory neuronal outflow, transmitted into the CNS, which promotes a downstream sympathetically mediated increase in adrenaline release from the adrenal medulla. Whether the CB is stimulated directly by low glucose or by a neuroendocrine factor released as a consequence of hypoglycaemia remains controversial, with a number of discrepancies reported regarding the direct low glucose sensitivity of the CB. Thus, the demonstration that CB thin slices or co-cultures of CB cells are acutely sensitive to physiological falls in glucose concentration (Pardal & Lopez-Barneo, 2002; Zhang et al. 2007; Ortega-Saenz et al. 2013) has been countered by reports of the whole organ being insensitive to modest to severe, sustained reductions in glucose (Bin-Jaliah et al. 2004; Conde et al. 2007; Gallego-Martin et al. 2012). These differences have been suggested to result from the use of different CB preparations impacting variably upon the metabolic status of the tissue (Kumar, 2007). Notwithstanding this discrepancy, precisely how this sensory organ maintains adequate energy status during periods of reduced glucose is unknown but is of interest given the well-documented detrimental impact of hypoglycaemia on neuronal cell viability (Mohseni, 2001; Ozaki et al. 2010).
No study has yet examined the functional importance of glycogen metabolism in sustaining CB type I cell viability and sensory neuronal activity during exposure to low glucose. In the CNS, astrocytic glycogen is broken down and released as lactate to fuel neuronal activity and prevent cell death during periods of increased activity (Brown et al. 2003, 2005), global ischaemia (Swanson et al. 1989) or glucose deprivation (Swanson & Choi, 1993). It is also evident that Schwann cell glycogen metabolism is necessary to support axonal function in peripheral nerves during prolonged exposure to aglycaemia (Brown et al. 2012). We therefore hypothesised that glycogen may have a valuable functional role in supporting neuronal and type I cell metabolism in the CB.
This article presents novel data demonstrating the presence of glycogen granules and glycogen conversion enzymes in the CB type I cells. On exposure to low glucose, the sensory neuronal discharge frequency is not acutely disrupted, but is sustained due to the break-down of glycogen that drives glycolysis. In acute hypoxia, the absence of extracellular glucose consumption does not significantly impair the exponential rise in neuronal outflow or the rise in type I cell [Ca2+]i. These findings therefore emphasise the importance of a highly labile and functional metabolic reserve in the CB that may provide a mechanistic explanation for the discrepancies reported in the literature regarding a role for the CB in glucose sensing. In addition, these results provide insight into how peripheral sensory neuronal tissues may respond to metabolic stress evoked by pathologies predisposing to impaired glucose homeostasis and/or hypoxia.
Methods
Surgical procedure and ethical approval
CBs were isolated from adult male (50–200 g) Wistar rats for whole organ and imaging studies and from 10- to 12-day-old Sprague Dawley rats for single cell studies (Pepper et al. 1995; Buckler & Turner, 2013). All surgery was performed under inhalation anaesthesia (2–4% isoflurane in O2). Following tissue procurement, animals were immediately killed by exsanguination or decapitation. All surgical procedures were performed in accordance with project and personal licences issued under the UK Animals (Scientific Procedures) Act 1986 and were approved by the Biomedical Services Unit at the University of Birmingham and The University of Oxford.
Extracellular recordings of CB sensory neuronal activity
Extracellular recordings of single- or few-fibre neurones were made from the cut end of the CNS using glass suction electrodes pulled from GC150-10 capillary glass (Harvard Apparatus, Kent, UK). The recorded voltage was band-pass filtered between 50 Hz and 50 kHz (NeuroLog NL125; Digitimer, Welwyn Garden City, UK) and amplified with an AC amplifier (NeuroLog 105; Digitimer). The superfusate  was continuously measured using an O2 electrode (ISO2; World Precision Instruments, Hitchin, UK) and O2 meter (OXELP; World Precision Instruments). The
  and chemoafferent-derived voltage were both recorded using a CED micro1401 (Cambridge Electronic Design, Cambridge, UK). The chemoafferent voltage signal was sampled at 15,000 Hz and the
  at 100 Hz. Using the in-built wavemark analysis in the Spike2 software (Cambridge Electronic Design), electrical activity originating from a single neurone was determined by its unique ‘wavemark’ signature based on action potential frequency, shape and amplitude.
Flow meters with high precision valves (Cole Palmer Instruments, London, UK) were used to equilibrate the superfusate with a desired gas mixture. The superfusate  was adjusted (at a fixed
  of 40 mmHg) to set a normoxic basal frequency of 0.25–1.5 Hz. This is consistent with the single unit frequency previously recorded in vivo in arterial normoxia (Vidruk et al. 2001). To monitor chemoafferent responses to graded hypoxia, the superfusate
  was gradually reduced at constant
  . During experimentation, CBs were continuously superfused with a standard bicarbonate buffered Krebs solution containing, in mm: 115 NaCl, 4.5 KCl, 1.25 NaH2PO4, 5 Na2SO4, 1.3 MgSO4, 24 NaHCO3, 2.4 CaCl2 and 11 d-glucose. All solutions were heated to 37°C and had a pH of 7.4. For glucose-free solutions, glucose was replaced with 11 mm mannitol to maintain constant osmolality.
Immunohistochemistry
Isolated CBs were fixed in 2.2% formaldehyde (TAAB Laboratories, Aldermaston, UK) in 10 mm PBS, pH 7.4, containing 2% glucose and 0.02% sodium azide (Sigma-Aldrich, Gillingham, UK). The tissue was rinsed once in PBS and left in a 30% sucrose solution for 24 h before being embedded in frozen optimal cutting temperature compound (OCT; TAAB Laboratories). Tissue sections 10 μm thick were cut using a cryostat and adhered onto charged glass slides (Thermo Scientific, Waltham, MA, USA). The tissue sections were permeabilised by incubation in PBS containing 1% Triton X-100 (Sigma-Aldrich). To limit non-specific antibody staining, tissue samples were incubated with PBS containing 1% BSA and 0.05% Tween20 (Sigma-Aldrich).
Tissue sections were incubated in a 0.1% BSA, 0.1% Tween20 PBS solution containing the appropriate primary antibodies, in a humidified chamber at 4°C for 24 h. Mouse monoclonal anti-rat tyrosine hydroxylase antibodies (Abcam, Cambridge, UK) were applied (1:20) for the positive identification of type I cells. In addition, rabbit monoclonal anti-rat glycogen synthase I (1:50; Abcam) or rabbit polyclonal anti-human glycogen phosphorylase BB (1:100; AbD Serotec, Kidlington, UK) antibodies were applied to establish the presence or absence of enzymes capable of glycogen synthesis and metabolism.
Tissue sections were washed in a 0.1% Tween20 PBS solution to remove excess primary antibodies and then incubated in a 0.1% BSA, 0.1% Tween20 PBS solution containing anti-rabbit Alexa flura 488- (green) and anti-mouse Alexa flura 594- (red) (1:250; Molecular Probes, Paisley, UK) conjugated secondary antibodies to allow for subsequent fluorescence detection of the protein–immunoglobulin complexes. Images were viewed using an epifluorescence microscope (Zeiss, Cambridge, UK).
Electron microscopy
The whole CB was rapidly fixed in a 0.1 m PBS-buffered solution containing 5% glutaraldehyde (Sigma-Aldrich) and 3% paraformaldehyde (Sigma-Aldrich), for 2–3 h. It was then post-fixed in a 1% osmium tetraoxide solution (Sigma-Aldrich) for a further 1 h. This specific staining protocol has been used previously to identify glycogen granules as ‘electron dense particles’ in mouse liver sections (Bendayan et al. 2009). The tissue was dehydrated by exposure to increasing concentrations of ethanol (50–100%) and then embedded in epoxy resin. Tissue thin sections were initially used to identify the CB under light microscopy. Ultrathin sections (30–60 nm) of the CB were cut using an ultramicrotome with a diamond knife and then stained with uranyl acetate and lead citrate. CB sections were viewed using a transmission electron microscope operating at ∼100 kV at magnifications of 6000×, 12,000× and 25,000×. Type I cells were identified within clusters containing homogenous cells, each exhibiting a circular morphology and containing a large round central nucleus with abundant mitochondria.
Type I cell isolation and measurements of [Ca2+]i
Following isolation CBs were placed in ice-cold PBS. CBs were identified, dissected free and then transferred to a HAMS F-12 nutrient mixture, containing collagenase (0.4 mg ml−1) and trypsin (0.2 mg ml−1) and incubated at 37°C, 5% CO2 and 11% O2, for 25–30 min. The tissue was then transferred to enzyme-free DMEM/F12 culture media and triturated gently through fire polished pipettes. The resultant cell suspension was plated on to poly-l-lysine-coated coverslips and maintained in an incubator at 37°C, 5% CO2 and 11% O2 for between 2 and 8 h before use. Culture media comprised ‘Advanced DMEM/F-12’ (Gibco, Paisley, UK) supplemented with 10% heat-inactivated fetal bovine serum, 2 mm l-glutamine and 4 μg ml−1 insulin.
[Ca2+]i was measured using Indo-1 loaded into cells by incubation with 2–5 μm of the acetoxymethyl ester derivative in culture media for 1 h at room temperature. Indo-1 was excited at 340 nm and fluorescence intensity measured at 405 ± 16 and 495 ± 10 nm. The fluorescence emission ratio (405/495) for Indo-1 was calibrated as previously described (Buckler & Vaughan-Jones, 1993). Fluorescence measurements were made using an inverted microscope (Nikon Diaphot 200; Nikon, Tokyo, Japan) equipped with a 100 W xenon lamp that provided the fluorescence excitation light source. Photomultiplier tubes (Thorn EMI, London, UK), cooled to −20°C, were used to detect the emitted fluorescence. The output signal was fed through a current–voltage converter and the voltage was recorded using a CED micro1401 (Cambridge Electronic Design) and visualised on a PC as an individual waveform. The voltage signal was sampled at 250 Hz. For glucose-free solutions, glucose was replaced with 11 mm mannitol to maintain constant osmolality. Normoxic/hyperoxic solutions were equilibrated with 5% CO2 and 10% O2 ( ∼ 80 mmHg). Hypoxic solutions were equilibrated with 5% CO2 and 95% N2.
Data analysis
Values are expressed as mean ± standard error of mean unless otherwise stated. Statistical analysis was performed using (i) a paired two-tailed Student's t test, (ii) an unpaired two-tailed Student's t test, (iii) one-way analysis of variance (ANOVA) or (iv) repeated-measures one-way ANOVA with Bonferroni or Dunnett's post hoc analysis where appropriate (StatView version 5, Cary, NC, USA). Significance was taken as P < 0.05.
Results
CB sensory activity during prolonged exposure to glucose deprivation
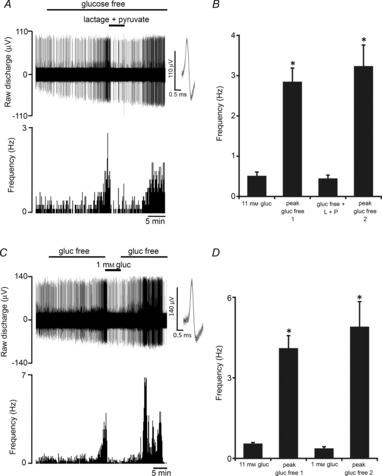
Initial experiments investigated the CB chemoafferent response to prolonged glucose deprivation. The superfusate  was adjusted, in 11 mm glucose, to set a basal single fibre discharge frequency of between 0.25 and 1.5 Hz, consistent with the level previously recorded in vivo in arterial normoxia (Vidruk et al. 2001). On exposure to zero glucose, the basal chemoafferent discharge frequency was maintained for 29.1 ± 1.2 min (n = 8 fibres) and then increased significantly for a period of up to 10 min before failing irreversibly (Fig. 1A and B). In subsequent studies, the level of stimulation evoked by prolonged glucose deprivation was compared with that produced by severe hypoxia; this is a well-defined metabolic stimulus for the CB. Examples of the peak frequencies recorded for the same fibre in response to severe hypoxia and zero glucose are shown in Fig. 1C. Paired comparisons demonstrated that the peak level of chemoafferent excitation induced by prolonged glucose deprivation was less than 15% of that generated by severe hypoxia (Fig. 1D).
Figure 1. CB sensory activity during prolonged exposure to glucose deprivation.
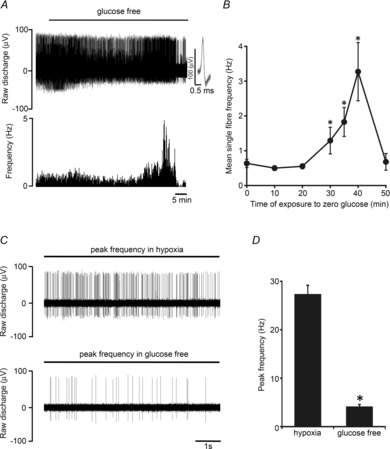
A, example trace demonstrating the impact of prolonged glucose deprivation on the neuronal output of the intact CB. Basal discharge is maintained for at least 20 min before brief stimulation and then irreversible decline. Raw discharge is shown (upper) along with single fibre frequency (lower). Overdrawn action potentials portraying single fibre discrimination are shown in the inset. B, mean discharge frequencies calculated at progressive time points during exposure to glucose deprivation. Error bars indicate ± SEM; *P < 0.05 compared with basal frequency; one-way repeated-measures ANOVA with Dunnett's post hoc comparisons test (n = 8 fibres from 8 CB preparations). C, example of the raw neuronal discharge taken from the same single fibre showing a 10 s period of maximal hypoxic (upper) and glucose-free (lower) stimulation. D, grouped data demonstrating that stimulation in response to glucose deprivation is significantly smaller than that induced by hypoxia. Error bars indicate + SEM. *P < 0.05 compared with hypoxia; paired t test (n = 12 fibres from 8 CB preparations).
We next determined whether an increase in basal action potential frequency and metabolic demand directly impacted on the time taken for the CB to respond to the glucose-free stimulus. The superfusate  was lowered to induce regulated, moderate elevations in basal discharge frequency, prior to glucose being removed from the superfusate. Example responses to glucose deprivation, recorded from fibres at three different levels of basal chemoafferent discharge frequency, are shown in Fig. 2A. Regression analysis identified a strong correlation between the level of basal action potential discharge frequency and time taken to be stimulated upon exposure to zero glucose (R2 = 0.7, P < 0.05) (Fig. 2B). This suggests that in the absence of external glucose delivery, an elevation in metabolic demand reduces the time that the CB can adequately support sensory neuronal output.
Figure 2. The time to a response in glucose deprivation is dependent on  -mediated, basal neuronal firing frequency.
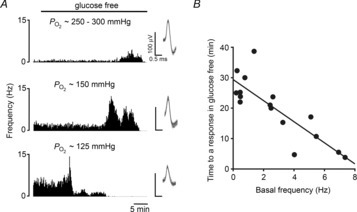
A, example traces showing the sensory neuronal responses to glucose deprivation with increasing initial basal discharge frequencies (upper to lower). Moderate neuronal stimulation was induced by lowering and maintaining the superfusate  . Single fibre raw discharge was recorded and expressed in frequency histograms. For each trace multiple action potentials have been overdrawn to show the single fibre discrimination. B, grouped data showing a correlation between basal frequency and the time taken to respond to glucose deprivation (R2 = 0.7, P < 0.05; linear regression analysis; n = 16 fibres from 13 CB preparations).
Glycogen metabolism supports CB function in the absence of external glucose delivery
The ability of the CB to sustain normal neuronal activity for up to 40 min in the absence of extracellular substrate delivery implies the presence of a considerable intracellular reserve of metabolic substrate(s). Given the important functional role of glycogen in the CNS (see Brown & Ransom, 2007) and peripheral nerves (Brown et al. 2012) it was hypothesised that glycogen may also be present in the CB and support both type I cell and neuronal activity during glucose deprivation. Immunohistochemical staining of 10 μm sections of CB tissue showed co-localisation of tyrosine hydroxylase (TH) (a classical type I cell marker) with both glycogen synthase I and the brain/neuronal isoform of glycogen phosphorylase BB in the CB (Fig. 3A). Higher magnification confirmed co-localization within type I cell cytoplasm and also revealed a degree of staining outside type I cells for both glycogen conversion enzymes (Fig. 3B). Imaging of the ultrastructure of the CB using electron microscopy detected glycogen granules abundantly dispersed throughout the cytoplasm of type I cells as well as within a neighbouring type II cell within a cluster (Fig. 3C). In these electron micrographs, glycogen was visualised as small electron-dense stained particles, up to 40 nm in diameter (Bendayan et al. 2009; Brown et al. 2012).
Figure 3. Glycogen granules and glycogen conversion enzymes are present in the rat CB.
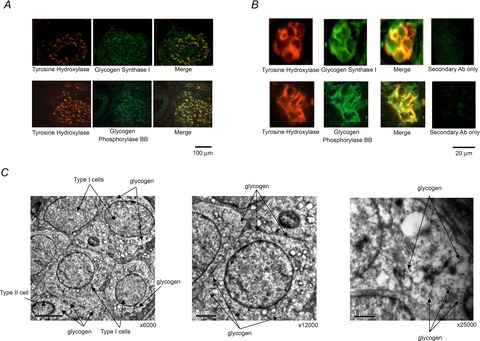
A, immunofluorescence staining of CB tissue sections showing co-localisation of tyrosine hydroxylase (TH; type I cell marker) with glycogen synthase I and neuronal glycogen phosphorylase (BB) in the type I cells, across the entire CB (scale bar = 100 μm). Staining was consistent across sections from three different CBs. B, higher magnification fluorescence images of two different type I cell clusters, demonstrating co-localisation of TH with glycogen synthase I and neuronal glycogen phosphorylase (BB), specifically in the type I cell cytoplasm. There is also a degree of staining detected outside of type I cells for both glycogen conversion enzymes. Scale bar = 20 μm. C, electron micrographs showing glycogen granules in the cytoplasm of multiple type I cells and in a neighbouring type II cell, within a single cluster. The higher magnification micrographs are of type I cells (middle and right). Scale bars = 5 μm (left), 2 μm (middle) and 1 μm (right).
To study a potential function of glycogen in the CB, experiments were performed using the glycogen phosphorylase inhibitor 1,4-dideoxy-1,4-imino d-arabinitol hydrochloride (DAB) (Andersen et al. 1999). DAB at 100 μm was initially added during superfusion with 11 mm glucose and this concentration was maintained throughout the glucose-free exposure. An example response to glucose deprivation in the presence of DAB is shown in Fig. 4A. Peak stimulation evoked in the presence of DAB was not significantly different between groups: control 5.1 ± 1.2 Hz and DAB 3.3 ± 0.7 Hz. However, partial or complete inhibition of glycogen metabolism with DAB significantly reduced the time taken to respond to glucose-free exposure by approximately 33% (Fig. 4B).
Figure 4. Glycogen supports CB sensory activity during periods of prolonged glucose deprivation.
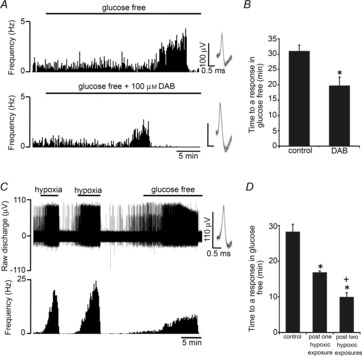
A, glycogenolysis was targeted using a pharmacological inhibitor of glycogen phosphorylase: 4-dideoxy-1,4-imino d-arabinitol hydrochloride (DAB). Example traces of the sensory neuronal response to glucose deprivation are demonstrated in control CBs (upper) and in CBs treated with DAB (lower). Single fibre raw discharge was recorded and expressed in frequency histograms. Multiple action potentials have been overdrawn to show single fibre discrimination. B, mean data showing that DAB significantly decreased the time to a response in glucose-free stimulation. Error bars indicate + SEM; *P < 0.05 compared with the time to a response in the control group; unpaired t test (n = 14 fibres from 12 CB preparations–groups combined). C, example trace showing the response to a glucose-free stimulus following two 4–5 min episodes of severe hypoxia. Severe hypoxia was applied to cause functional depletion of glycogen (see text). Raw neuronal discharge is shown (upper) along with frequency (lower). Inset: multiple overdrawn action potentials demonstrating single fibre discrimination. D, mean data showing that one or two exposures to severe hypoxia significantly decreased the time taken to respond to subsequent glucose deprivation. Error bars indicate + SEM; *P < 0.05 compared with control group, +P < 0.05 compared with the post single hypoxic episode group; one-way factorial ANOVA with Bonferroni post hoc analysis (n = 28 fibres from 19 CB preparations–groups combined).
Because of the unknown limitations of DAB diffusion, metabolism or uptake, further experiments were performed examining the chemoafferent response to glucose deprivation following exposure to hypoxia. In other tissues, hypoxia causes glycogen depletion (Niitsu et al. 1999) and increases the cellular AMP/ATP ratio (Evans et al. 2005), a key mechanism leading to allosteric activation of glycogen phosphorylase BB (Crerar et al. 1995). In the current study, the CB was subjected to either one or two periods of severe hypoxia (each lasting 4–5 min) to functionally deplete type I cell glycogen before removing the superfusate glucose. A chemoafferent response to zero glucose following two hypoxic episodes is demonstrated in Fig. 4C. The grouped results showed that one or two episodes of severe hypoxia significantly decreased the time taken to respond to glucose deprivation by approximately 40 and 65%, respectively (Fig. 4D).
Time-dependent CB activation by low glucose is dependent on a run-down in glycolysis
Inhibitory targeting of glycolysis, using sodium iodoacetate (100 μm), evoked brief CB chemoafferent excitation followed by irreversible failure, with the peak single fibre frequency measuring 8.7 ± 1.1 Hz (n = 12 fibres). This was perhaps not unexpected given that all known metabolic poisons and ATP-depleting agents are known to produce intense CB activation. However, it confirms the importance of glycolysis in maintaining type I cell and neuronal energy status under control conditions. During prolonged exposure to zero glucose, the time-dependent chemoafferent stimulation and subsequent failure was also predicted to be a consequence of a reduction in the rate of glycolysis following complete depletion of glycogen. To test this directly, 5 mm lactate and 0.5 mm pyruvate (capable of bypassing glycolysis to generate ATP) were added to the superfusate following initiation of a response to the glucose-free stimulus. In all fibres studied, addition of lactate and pyruvate rapidly restored the chemoafferent discharge frequency to basal levels within seconds (Fig. 5A and B). Additional experiments showed that adding back just 1 mm glucose also rapidly reversed the stimulation induced by glucose deprivation (Fig. 5C and D). In the knowledge that the Km of the glucose transporters and hexokinase expressed in the CB are in the micromolar range, re-activation is likely to have occurred in the presence of 1 mm glucose, causing restoration of glycolysis. These data provide strong evidence that the chemoafferent stimulation in zero glucose is due to the termination of glycolysis following exhaustion of the glycogen reserve.
Figure 5. Neuronal stimulation in glucose-free conditions is dependent on a run-down in glycolysis.
A, example trace demonstrating that 5 mm lactate and 0.5 mm pyruvate rapidly reverse the initial stimulation evoked by glucose deprivation. Raw discharge frequency from a single fibre is demonstrated (upper) along with frequency histograms (lower). Overdrawn action potentials demonstrate single fibre discrimination (inset). B, mean data showing that the response to glucose deprivation is restored to basal levels by the addition of lactate and pyruvate. Error bars indicate + SEM; *P < 0.05 compared with basal frequency in 11 mm glucose; one-way repeated-measures ANOVA with Dunnett's post hoc comparisons test (n = 9 fibres from 5 CB preparations). C, example trace showing the effect of 1 mm glucose on the response to glucose deprivation. Raw neuronal discharge is shown (upper) along with frequency histograms (lower). Inset: multiple action potentials have been overdrawn to show the single fibre discrimination. D, mean data showing that addition of 1 mm glucose abolishes the response to initial glucose free stimulation. Error bars indicate + SEM; *P < 0.05 compared with the basal frequency in 11 mm glucose; one-way repeated measures ANOVA with Dunnett's post hoc comparisons test (n = 6 fibres from 3 CB preparations). Note: for A–D experiments were performed following 5 min of severe hypoxia, to reduce the initial time to a response in glucose free solution (see earlier).
The CB response to acute hypoxia is preserved during glucose deprivation
CB glucose consumption is enhanced during hypoxia (Obeso et al. 1993). This suggests that the CB may become increasingly reliant on glucose uptake and glycolysis to counteract the hypoxia-induced impairment of mitochondrial oxidative phosphorylation (Buckler & Turner, 2013). Here, paired neuronal responses to graded hypoxia were evaluated in the presence and absence of superfusate glucose and show that the characteristic exponential rise in chemoafferent discharge during hypoxia remains intact despite complete glucose deprivation (Fig. 6A and B).
Figure 6. CB responses to hypoxia are conserved during glucose deprivation.
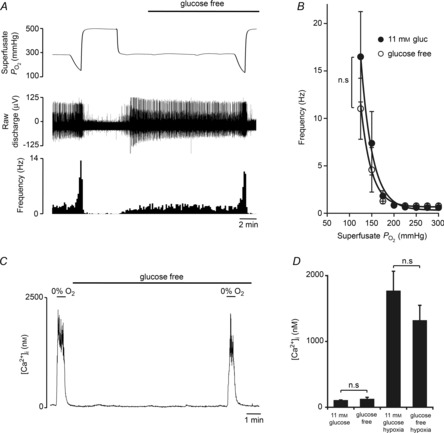
A, example recording of a CB sensory neuronal response to graded hypoxia in 11 mm glucose and glucose-free conditions. The continuous superfusate  is shown (upper) along with raw neuronal discharge (middle) and single fibre frequency histograms (lower) and demonstrate the preservation of the chemoafferent hypoxic response during glucose deprivation. Hypoxic responses were reversed before maximal discharge had been reached to restrict a run-down in the preparation. Graded hypoxia in glucose-free conditions was induced after 10–15 min to ensure complete glucose washout. This was also prior to any stimulation or failure of the basal chemoafferent activity. B, calculated mean discharge frequencies in 11 mm glucose and glucose-free conditions measured at selected levels of superfusate
  during hypoxia. Error bars indicate mean ± SEM; n = 8 fibres from 6 CB preparations. C, example recording demonstrating the impact of hypoxia and glucose-free exposure on [Ca2+]i in a dissociated type I cell cluster. D, grouped comparisons showing that glucose deprivation failed to evoke any acute type I cell excitation and had no effect on the [Ca2+]i response during hypoxia (n = 9 cellular recordings from 3 CB preparations).
In isolated type I cell clusters, zero glucose alone failed to cause any acute stimulation, showing consistency with the afferent nerve recordings, and confirming that the type I cells are able to withstand acute glucose deprivation without any disruption in energy status (Fig. 6C and D). In addition, hypoxia-induced [Ca2+]i elevations were unchanged after a 10 min period of glucose-free exposure (Fig. 6C and D), demonstrating that type I cell hypoxia chemotransduction pathways are preserved in spite of this sustained period of glucose deprivation.
Discussion
We have shown that glycogen is present in the CB type I cell and that glycogen metabolism fuels glycolysis and maintains the CB chemoafferent activity during periods of prolonged glucose starvation. Glycogen metabolism also appears to be functionally important in sustaining the increase in neuronal activity induced by hypoxia. These findings therefore emphasise a valuable functional role for glycogen metabolism and glycolysis in supporting CB function and energy status upon exposure to potentially harmful metabolic stress stimuli.
Glycogen sustains glycolysis and energy status during glucose deprivation
Exposing the CB to complete glucose deprivation failed to cause any acute disruption in either type I cell [Ca2+]i or sensory neuronal output. Chemoafferent stimulation was observed but only after at least 20 min of glucose-free exposure. We utilised a glucose-free superfusate as the stimulus in our in vitro CB preparation, rather than a hypoglycaemic one, to ensure that the stimulus presented to type 1 cells within the organ was consistent (i.e. zero). With a hypoglycaemic perfusate extracellular glucose within the organ would be likely to vary considerably with organ size and glucose consumption rate. This strategy is similar to that employed by Kholwadwala & Donnelly (1992) who used anoxia when studying the effects of oxygen deprivation in the in vitro CB preparation to avoid variation in tissue oxygenation. Note that we have found a number of factors that influence the time delay between administering aglycaemia and observing a response. This suggests that the delay is not simply an invariant wash out time for extracellular glucose but represents instead changes in the size and/or rate of utilisation of intracellular metabolic reserves.
The rise in discharge frequency was also quickly restored to control levels by adding back just 1 mm glucose. Glycolysis is closely regulated by the activity of hexokinases. The absence of glucokinase (hexokinase IV) from CB type I cells (Garcia-Fernandez et al. 2007), however, implies that glycolysis will only be impaired at very low concentrations of intracellular glucose since all other hexokinases have a very low (micromolar) Km for glucose (Lowry & Passonneau, 1964; Meglasson & Matschinsky, 1986). The return to a control level of discharge frequency in just 1 mm glucose is therefore consistent with a re-activation of glycolysis and although we cannot definitively show this through direct measure, it is highly likely that the type I cells within the whole organ were being exposed to a glucose concentration very close to zero.
A similar restoration of chemoafferent activity during glucose-free induced stimulation was achieved by adding lactate and pyruvate. These substrates are able to bypass the glycolytic pathway and rapidly enter the tricarboxylic acid cycle to drive ATP synthesis. Chemoafferent stimulation following prolonged glucose-free conditions is therefore most likely to be due to a complete run-down in glycolysis leading directly to a fall in type I cell or neuronal energy status. Whether the increase in frequency is a consequence of type I cell activation (and transmitter release) or direct neuronal stimulation (following a run-down in the Na+/K+ ATPase) was beyond the scope of this study. That said, a metabolic signalling cascade in the type I cell is well defined and alterations in [AMP]i or [ATP]i have been linked to cellular depolarisation either through activation of AMP-activated kinase (cellular energy sensor) (Wyatt et al. 2007) or following a reduction in the ATP-sensitive TASK-like channel conductance (Varas et al. 2007).
The absence of acute neuronal excitation in zero glucose does suggest that the type I cells and afferent neurones maintain glycolysis and energy status for a considerable period of time. Without external glucose uptake, it is logical to hypothesise that glycolysis could be sustained by the metabolism of stored glycogen. CB glycogen content was not measured directly because of the small CB size in the rat (∼200 μg). However, glycogen was visualised in the type I cell using electron microscopy and it appeared to be localised in considerable quantities throughout the cytoplasm. Accordingly, the type I cells also positively expressed glycogen synthase I and glycogen phosphorylase BB, suggesting the ability to metabolise and synthesise glycogen depending on the specific energetic cellular requirements. Pharmacological targeting of glycogenolysis using DAB and functional glycogen depletion by hypoxia both significantly reduced the time taken for the CB to respond (and fail) to glucose deprivation. Thus, it is proposed that glycogen metabolism supports glycolysis in the CB during acute exposure to glucose deprivation. This function mimics that of glycogen in the CNS (Swanson & Choi, 1993) and peripheral nerves (Brown et al. 2012) and offers the CB metabolic protection against severe hypoglycaemia.
We found that glycogen synthase I and glycogen phosphorylase BB were not solely limited to TH-positive, type I cells. In addition, we found evidence of glycogen within type II cells. The type II cell has often been thought to act as a glial cell (Kumar & Prabhakar, 2012), so it is possible that it could also function as an important glycogen reserve in the CB. Indeed we cannot exclude the possibility that other cellular elements within the organ, including nerve endings and vasculature, may also have glycogen reserves. These considerations make it difficult to predict the extent to which these different stores influence the response to glucose deprivation, but do not detract from our conclusion that it is the depletion of some of these stores that gives rise to sensitivity to glucose deprivation.
Interestingly, it appears that the duration of functional support offered by glycogen to chemoafferent or type I cell activity is more comparable with that seen in the CNS (∼0.3 h) than in the peripheral nervous system (∼2 h). This could be representative of a particularly high type I cell or afferent neurone metabolic rate or an alteration in mitochondrial ATP generation. Intriguingly, the type I cell mitochondria exhibit fundamental differences in O2 affinity compared with other neuronal tissues (Buckler & Turner, 2013), but whether this impairs the ability to produce ATP in normoxia remains to be evaluated.
CB energy status in hypoxia
Hypoxia causes type I cell depolarisation, [Ca2+]i elevation, neurosecretion and post-synaptic chemoafferent excitation (Kumar & Prabhakar, 2012). All of these processes would be expected to increase CB ATP utilisation and yet there is a wealth of evidence implying that the initial step in the hypoxia signalling cascade is impairment of mitochondrial energy metabolism (Duchen & Biscoe, 1992a,b; Buckler & Turner, 2013). Precisely how this tissue copes with an increase in ATP consumption despite a reduction in mitochondrial ATP generation is largely unknown. It has been observed that glucose consumption increases in hypoxia (Obeso et al. 1993) and is likely to enhance ATP generation through anaerobic glycolysis, allowing the CB to sustain a form of energetic competency. In our experiments, the absence of extracellular glucose for 10–15 min failed to restrict either the rise in chemoafferent discharge frequency or the increase in type I cell [Ca2+]i evoked by acute hypoxia. However, one or two episodes of severe and sustained (5 min) hypoxia made the CB significantly less tolerant to subsequent zero glucose exposure, causing a more rapid run-down in glycolysis, energy status and organ failure. In view of these findings it is likely that in hypoxia, an increase in glycogen metabolism is important in supporting a rise in glycolysis and allows for sufficient ATP to be generated to sustain type I cell depolarisation, [Ca2+]i elevation, neurosecretion and re-uptake, even though oxidative phosphorylation is compromised. Selective manipulation of CB glycogen metabolism or glucose consumption may prove to be beneficial in restricting the heightened CB neuronal output and in patients with sleep disordered breathing or chronic heart failure. Whether glycogen storage or glucose metabolism is altered in the CB following chronic exposure to intermittent hypoxia or catecholamines may be an intriguing area for future examination.
The CB in glucose homeostasis
Our observations clearly suggest that the CB is not acutely or directly stimulated by low glucose. They thus confirm previous findings in the whole organ (Bin-Jaliah et al. 2004; Conde et al. 2007; Gallego-Martin et al. 2012) but contradict reports that the CB is activated during acute glucose shortage in reduced preparations, i.e. CB slices or isolated cells that were maintained in culture for at least 24 h (Pardal & Lopez-Barneo, 2002; Zhang et al. 2007; Ortega-Saenz et al. 2013). We have, however, investigated both intact CBs and isolated type I cells and have found no evidence of acute glucose sensitivity in either so do not ascribe the contradictory nature of these data simply to the use of intact organs vs. reduced preparations. We would also exclude animal age as a factor; glucose sensitivity has been reported in preparations from both neonatal and adult rats (Pardal & Lopez-Barneo, 2002; Garcia-Fernandez et al. 2007; Zhang et al. 2007) whereas we found no glucose sensitivity in either adult CBs or neonatal Type 1 cells. Cell/tissue culture may, however, be an issue given that Gallego-Martin et al. (2012) reported that aglycaemia can augment secretory responses to hypoxia in intact rat CBs maintained in culture for 1 day but not in freshly isolated CBs which are acutely glucose insensitive. Whilst our main study has been conducted on acutely isolated organs and cells, we have also found that incubation of the whole CB in hyperoxia for a prolonged period (up to 24 h) significantly reduced the time taken for the CB to respond to zero glucose (data not shown).
Although we have no mechanism to account for these discrepancies, our data suggest that the reason for the difference may lie with a run-down of glycogen, or an inability to utilise glycogen, in reduced CB models that require incubation over a period of days following excision, such as thin CB slices and co-culture preparations. Alternatively, prolonged anoxia during the surgical procedures or within experimental protocols may induce an augmented glucosensitivity following exhaustion of type I cell glycogen. Indeed, in the whole in vitro, superfused cat CB, the only evidence of a response to zero glucose, as observed by an increase in the absolute level of acetylcholine release, was following and concomitant with a substantial exposure to severe hypoxia (Fitzgerald et al. 2009). In contrast, and somewhat in agreement with our findings, in the superfused and perfused in vitro cat CB preparation, responses to flow interruption were not augmented for at least 15 min of exposure to zero glucose (Spergel et al. 1992). A high level of superfusate  used in our experiments does not appear to be the reason for the differences noted, as we were careful with the in vitro whole organ preparation to use a level of
  that was related to physiological normoxia in vivo as evidenced by the basal chemodischarge as recorded by Vidruk et al. (2001). Furthermore, isolated type I cells were bathed in a
  of around 80 mmHg which was similar or slightly less than that used by both Pardal & Lopez-Barneo (2002) and Zhang et al. (2007).
In addition, the CB appears to be required for the restoration of normal plasma glucose concentrations in response to hypoglycaemia, both in animals (Alvarez-Buylla & de Alvarez-Buylla, 1988; Koyama et al. 2000) and in humans (Ward et al. 2009; Wehrwein et al. 2010). Whilst the suggestion, based on a correlative relation (Wehrwein et al. 2010), has been made that the stimulus to the CB during hypoglycaemia is most likely the fall in blood glucose concentration, there are other possibilities. For example, a number of counter-regulatory endocrine or neuroendocrine factors are released into the systemic circulation during hypoglycaemia, including adrenaline, noradrenaline, cortisol and glucagon (Cryer, 1993; Ward et al. 2007) or, indeed, insulin (Ribeiro et al. 2013) and any or all of these could be the stimulus that drives the observed increased ventilation (Bin-Jaliah et al. 2004, 2005) or corrective neuroendocrine reflexes (Koyama et al. 2000; Wehrwein et al. 2010). Consistent with the results identified in this article it is hypothesised therefore that one of these factors released as a consequence of hypoglycaemia may stimulate the CB rather than low glucose per se. Thus, whilst our data suggest that the intact CB may not act a direct glucosensor, we do not discount and fully support a key role for the organ in systemic glucose homeostasis. Future experiments may aim to fully characterise the importance of hormones in activating the CB and augmenting ventilation in hypoglycaemia.
Concluding remarks
The CB sustains normal sensory neuronal activity during prolonged exposure to glucose deprivation due to metabolism of stored glycogen that supports glycolysis and energy status. These findings therefore provide the first evidence of a physiological role for glycogen in the mammalian CB and question the ability of the in vivo CB to act as a sensor of acute changes in physiological blood glucose concentration. Disruption of glycogen or glucose metabolism in CB during pathology remains to be evaluated.
Acknowledgments
None to declare.
Glossary
- CB
carotid body
- DAB
1,4-dideoxy-1,4-imino d-arabinitol hydrochloride
- TH
tyrosine hydroxylase
Additional Information
Competing interests
The authors declare no competing interests.
Author contributions
A.P.S.H. helped devise the original hypothesis and experimental designs, researched data, analysed and interpreted data, wrote the manuscript and edited/reviewed the manuscript. P.J.T. researched data and contributed to analysis of data. P.C. researched data and contributed to the discussion. W.L. researched data and edited/reviewed the manuscript. C.R. contributed with the interpretation of data and the discussion. D.H. contributed in devising the original hypothesis and experimental designs. K.J.B. researched data and reviewed/edited the manuscript. P.K. contributed in devising the original hypothesis and experimental designs, contributed with the analysis and interpretation of data and edited/reviewed the manuscript.
Funding
This work was supported financially by the College of Medical and Dental Sciences, University of Birmingham, UK. A.P.S.H. was supported by the A. E. Hills Scholarship awarded by the Postgraduate School, University of Birmingham, UK.
References
- Alvarez-Buylla R, de Alvarez-Buylla ER. Carotid sinus receptors participate in glucose homeostasis. Respir Physiol. 1988;72:347–359. doi: 10.1016/0034-5687(88)90093-x. [DOI] [PubMed] [Google Scholar]
- Andersen B, Fosgerau K, Kristiansen M, Lundgren K, Westergaard N. Inhibition of glycogen phosphorylase and glycogenolysis in primary rat hepatocytes by 1,4-dideoxy-1,4-imino-d-arabinitol. Diabetes. 1999;48:A447–A447. [PMC free article] [PubMed] [Google Scholar]
- Bendayan M, Londono I, Kemp BE, Hardie GD, Ruderman N, Prentki M. Association of AMP-activated protein kinase subunits with glycogen particles as revealed in situ by immunoelectron microscopy. J Histochem Cytochem. 2009;57:963–971. doi: 10.1369/jhc.2009.954016. [DOI] [PMC free article] [PubMed] [Google Scholar]
- Bin-Jaliah I, Maskell PD, Kumar P. Indirect sensing of insulin-induced hypoglycaemia by the carotid body in the rat. J Physiol. 2004;556:255–266. doi: 10.1113/jphysiol.2003.058321. [DOI] [PMC free article] [PubMed] [Google Scholar]
- Bin-Jaliah I, Maskell PD, Kumar P. Carbon dioxide sensitivity during hypoglycaemia-induced, elevated metabolism in the anaesthetized rat. J Physiol. 2005;563:883–893. doi: 10.1113/jphysiol.2004.080085. [DOI] [PMC free article] [PubMed] [Google Scholar]
- Brown AM, Evans RD, Black J, Ransom BR. Schwann cell glycogen selectively supports myelinated axon function. Ann Neurol. 2012;72:406–418. doi: 10.1002/ana.23607. [DOI] [PMC free article] [PubMed] [Google Scholar]
- Brown AM, Ransom BR. Astrocyte glycogen and brain energy metabolism. Glia. 2007;55:1263–1271. doi: 10.1002/glia.20557. [DOI] [PubMed] [Google Scholar]
- Brown AM, Sickmann HM, Fosgerau K, Lund TM, Shousboe A, Waagepetersen HS, Ransom BR. Astrocyte glycogen metabolism is required for neural activity during aglycemia or intense stimulation in mouse white matter. J Neurosci Res. 2005;79:74–80. doi: 10.1002/jnr.20335. [DOI] [PubMed] [Google Scholar]
- Brown AM, Tekkok SB, Ransom BR. Glycogen regulation and functional role in mouse white matter. J Physiol. 2003;549:501–512. doi: 10.1113/jphysiol.2003.042416. [DOI] [PMC free article] [PubMed] [Google Scholar]
- Buckler KJ, Turner PJ. Oxygen sensitivity of mitochondrial function in rat arterial chemoreceptor cells. J Physiol. 2013;591:3549–3563. doi: 10.1113/jphysiol.2013.257741. [DOI] [PMC free article] [PubMed] [Google Scholar]
- Buckler KJ, Vaughan-Jones RD. Effects of acidic stimuli on intracellular calcium in isolated type I cells of the neonatal rat carotid body. Pflugers Arch. 1993;425:22–27. doi: 10.1007/BF00374499. [DOI] [PubMed] [Google Scholar]
- Conde SV, Obeso A, Gonzalez C. Low glucose effects on rat carotid body chemoreceptor cells’ secretory responses and action potential frequency in the carotid sinus nerve. J Physiol. 2007;585:721–730. doi: 10.1113/jphysiol.2007.144261. [DOI] [PMC free article] [PubMed] [Google Scholar]
- Crerar MM, Karlsson O, Fletterick RJ, Hwang PK. Chimeric muscle and brain glycogen phosphorylases define protein domains governing isozyme-specific responses to allosteric activation. J Biol Chem. 1995;270:13748–13756. doi: 10.1074/jbc.270.23.13748. [DOI] [PubMed] [Google Scholar]
- Cryer PE. Glucose counterregulation – prevention and correction of hypoglycemia in humans. Am J Physiol. 1993;264:E149–E155. doi: 10.1152/ajpendo.1993.264.2.E149. [DOI] [PubMed] [Google Scholar]
- Duchen MR, Biscoe TJ. Mitochondrial function in type I cells isolated from rabbit arterial chemoreceptors. J Physiol. 1992a;450:13–31. doi: 10.1113/jphysiol.1992.sp019114. [DOI] [PMC free article] [PubMed] [Google Scholar]
- Duchen MR, Biscoe TJ. Relative mitochondrial membrane potential and [Ca2+]i in type I cells isolated from the rabbit carotid body. J Physiol. 1992b;450:33–61. doi: 10.1113/jphysiol.1992.sp019115. [DOI] [PMC free article] [PubMed] [Google Scholar]
- Evans AM, Mustard KJ, Wyatt CN, Peers C, Dipp M, Kumar P, Kinnear NP, Hardie DG. Does AMP-activated protein kinase couple inhibition of mitochondrial oxidative phosphorylation by hypoxia to calcium signalling in O2-sensing cells? J Biol Chem. 2005;280:41504–41511. doi: 10.1074/jbc.M510040200. [DOI] [PubMed] [Google Scholar]
- Fitzgerald RS, Shirahata M, Chang I, Kostuk E. The impact of hypoxia and low glucose on the release of acetylcholine and ATP from the incubated cat carotid body. Brain Res. 2009;1270:39–44. doi: 10.1016/j.brainres.2009.02.078. [DOI] [PubMed] [Google Scholar]
- Gallego-Martin T, Fernandez-Martinez S, Rigual R, Obeso A, Gonzalez C. Effects of low glucose on carotid body chemoreceptor cell activity studied in cultures of intact organs and in dissociated cells. Am J Physiol Cell Physiol. 2012;302:C1128–1140. doi: 10.1152/ajpcell.00196.2011. [DOI] [PubMed] [Google Scholar]
- Garcia-Fernandez M, Ortega-Saenz P, Castellano A, Lopez-Barneo J. Mechanisms of low-glucose sensitivity in carotid body glomus cells. Diabetes. 2007;56:2893–2900. doi: 10.2337/db07-0122. [DOI] [PubMed] [Google Scholar]
- Kholwadwala D, Donnelly DF. Maturation of carotid chemoreceptor sensitivity to hypoxia: in vitro studies in the newborn rat. J Physiol. 1992;453:461–473. doi: 10.1113/jphysiol.1992.sp019239. [DOI] [PMC free article] [PubMed] [Google Scholar]
- Koyama Y, Coker RH, Stone EE, Lacy DB, Jabbour K, Williams PE, Wasserman DH. Evidence that carotid bodies play an important role in glucoregulation in vivo. Diabetes. 2000;49:1434–1442. doi: 10.2337/diabetes.49.9.1434. [DOI] [PubMed] [Google Scholar]
- Kumar P. How sweet it is: sensing low glucose in the carotid body. J Physiol. 2007;578:627. doi: 10.1113/jphysiol.2006.126250. [DOI] [PMC free article] [PubMed] [Google Scholar]
- Kumar P. Systemic effects resulting from carotid body stimulation-invited article. Adv Exp Med Biol. 2009;648:223–233. doi: 10.1007/978-90-481-2259-2_26. [DOI] [PubMed] [Google Scholar]
- Kumar P, Prabhakar NR. Peripheral chemoreceptors: function and plasticity of the carotid body. Compr Physiol. 2012;2:141–219. doi: 10.1002/cphy.c100069. [DOI] [PMC free article] [PubMed] [Google Scholar]
- Lesske J, Fletcher EC, Bao G, Unger T. Hypertension caused by chronic intermittent hypoxia – influence of chemoreceptors and sympathetic nervous system. J Hypertens. 1997;15:1593–1603. doi: 10.1097/00004872-199715120-00060. [DOI] [PubMed] [Google Scholar]
- Lowry OH, Passonneau JV. The relationships between substrates and enzymes of glycolysis in brain. J Biol Chem. 1964;239:31–42. [PubMed] [Google Scholar]
- McBryde FD, Abdala AP, Hendy EB, Pijacka W, Marvar P, Moraes DJ, Sobotka PA, Paton JF. The carotid body as a putative therapeutic target for the treatment of neurogenic hypertension. Nat Commun. 2013;4:2395. doi: 10.1038/ncomms3395. [DOI] [PubMed] [Google Scholar]
- Meglasson MD, Matschinsky FM. Pancreatic islet glucose metabolism and regulation of insulin secretion. Diabetes Metab Rev. 1986;2:163–214. doi: 10.1002/dmr.5610020301. [DOI] [PubMed] [Google Scholar]
- Mohseni S. Hypoglycemic neuropathy. Acta Neuropathol. 2001;102:413–421. doi: 10.1007/s004010100459. [DOI] [PubMed] [Google Scholar]
- Narkiewicz K, van de Borne PJH, Montano N, Dyken ME, Phillips BG, Somers VK. Contribution of tonic chemoreflex activation to sympathetic activity and blood pressure in patients with obstructive sleep apnea. Circulation. 1998;97:943–945. doi: 10.1161/01.cir.97.10.943. [DOI] [PubMed] [Google Scholar]
- Niitsu Y, Hori O, Yamaguchi A, Bando Y, Ozawa K, Tamatani M, Ogawa S, Tohyama M. Exposure of cultured primary rat astrocytes to hypoxia results in intracellular glucose depletion and induction of glycolytic enzymes. Brain Res Mol Brain Res. 1999;74:26–34. doi: 10.1016/s0169-328x(99)00245-4. [DOI] [PubMed] [Google Scholar]
- Obeso A, Gonzalez C, Rigual R, Dinger B, Fidone S. Effect of low O2 on glucose uptake in rabbit carotid body. J Appl Physiol. 1993;74:2387–2393. doi: 10.1152/jappl.1993.74.5.2387. [DOI] [PubMed] [Google Scholar]
- Ortega-Saenz P, Pardal R, Levitsky K, Villadiego J, Munoz-Manchado AB, Duran R, Bonilla-Henao V, Arias-Mayenco I, Sobrino V, Ordonez A, Oliver M, Toledo-Aral JJ, Lopez-Barneo J. Cellular properties and chemosensory responses of the human carotid body. J Physiol. 2013;591:6157–6173. doi: 10.1113/jphysiol.2013.263657. [DOI] [PMC free article] [PubMed] [Google Scholar]
- Ozaki K, Sano T, Tsuji N, Matsuura T, Narama I. Insulin-induced hypoglycemic peripheral motor neuropathy in spontaneously diabetic WBN/Kob rats. Comp Med. 2010;60:282–287. [PMC free article] [PubMed] [Google Scholar]
- Pardal R, Lopez-Barneo J. Low glucose-sensing cells in the carotid body. Nat Neurosci. 2002;5:197–198. doi: 10.1038/nn812. [DOI] [PubMed] [Google Scholar]
- Pepper DR, Landauer RC, Kumar P. Postnatal development of CO2–O2 interaction in the rat carotid body in vitro. J Physiol. 1995;485:531–541. doi: 10.1113/jphysiol.1995.sp020749. [DOI] [PMC free article] [PubMed] [Google Scholar]
- Ribeiro MJ, Sacramento JF, Gonzalez C, Guarino MP, Monteiro EC, Conde SV. Carotid body denervation prevents the development of insulin resistance and hypertension induced by hypercaloric diets. Diabetes. 2013;62:2905–2916. doi: 10.2337/db12-1463. [DOI] [PMC free article] [PubMed] [Google Scholar]
- Schultz HD, Marcus NJ, Del Rio R. Role of the carotid body in the pathophysiology of heart failure. Curr Hypertens Rep. 2013;15:356–362. doi: 10.1007/s11906-013-0368-x. [DOI] [PMC free article] [PubMed] [Google Scholar]
- Spergel D, Lahiri S, Wilson DF. Dependence of carotid chemosensory responses on metabolic substrates. Brain Res. 1992;596:80–88. doi: 10.1016/0006-8993(92)91535-m. [DOI] [PubMed] [Google Scholar]
- Swanson RA, Choi DW. Glial glycogen stores affect neuronal survival during glucose deprivation in vitro. J Cereb Blood Flow Metab. 1993;13:162–169. doi: 10.1038/jcbfm.1993.19. [DOI] [PubMed] [Google Scholar]
- Swanson RA, Sagar SM, Sharp FR. Regional brain glycogen stores and metabolism during complete global ischaemia. Neurol Res. 1989;11:24–28. doi: 10.1080/01616412.1989.11739856. [DOI] [PubMed] [Google Scholar]
- Varas R, Wyatt CN, Buckler KJ. Modulation of TASK-like background potassium channels in rat arterial chemoreceptor cells by intracellular ATP and other nucleotides. J Physiol. 2007;583:521–536. doi: 10.1113/jphysiol.2007.135657. [DOI] [PMC free article] [PubMed] [Google Scholar]
- Vidruk EH, Olson EB, Jr, Ling L, Mitchell GS. Responses of single-unit carotid body chemoreceptors in adult rats. J Physiol. 2001;531:165–170. doi: 10.1111/j.1469-7793.2001.0165j.x. [DOI] [PMC free article] [PubMed] [Google Scholar]
- Ward DS, Voter WA, Karan S. The effects of hypo- and hyperglycaemia on the hypoxic ventilatory response in humans. J Physiol. 2007;582:859–869. doi: 10.1113/jphysiol.2007.130112. [DOI] [PMC free article] [PubMed] [Google Scholar]
- Ward DS, Voter WA, Karan S. The role of the carotid bodies in the counter-regulatory response to hypoglycemia. Adv Exp Med Biol. 2009;648:273–280. doi: 10.1007/978-90-481-2259-2_31. [DOI] [PubMed] [Google Scholar]
- Wehrwein EA, Basu R, Basu A, Curry TB, Rizza RA, Joyner MJ. Hyperoxia blunts counterregulation during hypoglycaemia in humans: possible role for the carotid bodies. J Physiol. 2010;588:4593–4601. doi: 10.1113/jphysiol.2010.197491. [DOI] [PMC free article] [PubMed] [Google Scholar]
- Wyatt CN, Mustard KJ, Pearson SA, Dallas ML, Atkinson L, Kumar P, Peers C, Hardie DG, Evans AM. AMP-activated protein kinase mediates carotid body excitation by hypoxia. J Biol Chem. 2007;282:8092–8098. doi: 10.1074/jbc.M608742200. [DOI] [PMC free article] [PubMed] [Google Scholar]
- Zhang M, Buttigieg J, Nurse CA. Neurotransmitter mechanisms mediating low-glucose signalling in cocultures and fresh tissue slices of rat carotid body. J Physiol. 2007;578:735–750. doi: 10.1113/jphysiol.2006.121871. [DOI] [PMC free article] [PubMed] [Google Scholar]