

Abstract
Infrared (IR) spectroscopic imaging systems are a powerful tool for visualizing molecular microstructure of a sample without the need for dyes or stains. Table-top Fourier transform infrared (FT-IR) imaging spectrometers, the current established technology, can record broadband spectral data efficiently but requires scanning the entire spectrum with a low throughput source. The advent of high-intensity, broadly tunable quantum cascade lasers (QCL) has now accelerated IR imaging but results in a fundamentally different type of instrument and approach, namely, discrete frequency IR (DF-IR) spectral imaging. While the higher intensity of the source provides a higher signal per channel, the absence of spectral multiplexing also provides new opportunities and challenges. Here, we couple a rapidly tunable QCL with a high performance microscope equipped with a cooled focal plane array (FPA) detector. Our optical system is conceptualized to provide optimal performance based on recent theory and design rules for high-definition (HD) IR imaging. Multiple QCL units are multiplexed together to provide spectral coverage across the fingerprint region (776.9 to 1904.4 cm–1) in our DF-IR microscope capable of broad spectral coverage, wide-field detection, and diffraction-limited spectral imaging. We demonstrate that the spectral and spatial fidelity of this system is at least as good as the best FT-IR imaging systems. Our configuration provides a speedup for equivalent spectral signal-to-noise ratio (SNR) compared to the best spectral quality from a high-performance linear array system that has 10-fold larger pixels. Compared to the fastest available HD FT-IR imaging system, we demonstrate scanning of large tissue microarrays (TMA) in 3-orders of magnitude smaller time per essential spectral frequency. These advances offer new opportunities for high throughput IR chemical imaging, especially for the measurement of cells and tissues.
Obtaining high-quality structural and molecular information from biological samples is an analytical challenge in many clinical and research studies. Traditionally, optical microscopy or fluorescence techniques have been used with a variety of dyes and labels to improve contrast, but these external contrast agents can perturb biological samples and are limited to imaging known molecular species. Vibrational spectroscopic imaging techniques, such as using mid-infrared (IR) absorption, allow for the nonperturbing molecular study of micrometer-thick samples. As many molecular functional groups have resonant frequencies in this spectral range, the mid-IR absorption spectrum provides image contrast as well as uniquely identifies a sample’s chemistry without the need for dyes or prior analytical knowledge of its composition.1 These factors have led to a significant number of potential biomedical applications of IR chemical imaging.2−7 Today, the most popular configuration for IR chemical imaging is the Fourier transform infrared (FT-IR) imaging spectrometer which employs multiplex detection of wavelengths via interferometry. In its most common form, an interferometer is coupled to a multichannel, liquid nitrogen-cooled mercury cadmium telluride (MCT) detector. The detector in commercial imaging spectrometers is typically a linear array (LA)8 or a focal plane array (FPA).9 FT-IR imaging instruments use a globar thermal source, which has a broadband emission profile with sufficient intensity for data recording but limits further improvement due to the trade-offs between spectral and spatial performance.10 For instance, while larger format detectors with smaller active elements could yield faster imaging, their implementation is difficult as the total flux of the globar source must be divided among each pixel. As the individual detector elements get smaller, the signal decreases proportionally to the area of the detector, adversely affecting the recorded signal-to-noise ratio (SNR). Additionally, due to the nature of the interferometer, the scanning mirror must travel further in order to increase in spectral resolution, which in turn requires closing down the input aperture to maintain a certain level of collimation of the beams passing through the interferometer arms. This dramatically reduces the available flux requiring more sample coadditions to preserve the SNR.11 Thus, commercial FT-IR instruments are typically limited to ∼4 cm–1 resolution with ∼5 μm pixels in order to ensure sufficient SNR from the thermal source.12
Higher flux sources can offer numerous advantages toward faster high-definition IR imaging. The most dramatic example is the development of high-definition imaging13 that provided high quality data using a synchrotron source14 and significantly noisier data using a globar. The recent availability of quantum cascade lasers (QCL) has now made the same advances feasible, albeit in a discrete frequency (DF) configuration that contrasts with the prevalent FT-IR and filter-based DF-IR technology.15 QCLs are a type of semiconductor laser commonly packaged in an external cavity (EC) configuration with an approximate 200 cm–1 tunable range.16−18 In recent years, they have become commercially viable in multiplexed configurations spanning the fingerprint region.19 With narrowband line widths at intensities unmatched by globar sources, QCLs have been incorporated into DF instrumentation for chemical sensors,20−22 cavity ringdown spectroscopy,23 and analysis of aqueous samples,24,25 as well as microscopy.26−31 This combination of QCLs with custom designed instrumentation for microspectroscopy provides the unique option of collecting data sets at high SNR. In implementations reported to date, however, the potential of QCLs has not been fully realized. While an uncooled array detector-based instrument was shown to be feasible and is now commercially available, the challenge of using QCLs with high performance cooled FPAs has not been addressed. Here, we demonstrate the feasibility of using high-performance, cooled FPA detectors with fast readout speeds in conjunction with a rapidly tunable QCL. We first describe methods to overcome challenges in instrumentation for this configuration. Second, we compare the performance of our setup against commercial high performance systems. Both high spectral quality (LA) and high spatial quality (high-definition (HD) FPA) imaging spectrometers are compared. Finally, we demonstrate the advantages of using our approach for biomedical tissue imaging.
Experimental Section
QCL Microscopy
We have developed a custom IR microscope, as shown in Figure 1A, built for integration with commercial QCL sources. The net magnification of the microscope is 20× and 43× with effective pixel sizes of 2.02 and 0.95 μm, respectively, resulting in 259 and 122 μm corresponding linear fields of view. While the setup is similar to conventional IR microscopes, additional care must be taken during setup and alignment to minimize back reflections which will appear as a flickering ripple effect across the field of view. This behavior can be minimized by slightly closing the condenser’s back aperture (AC) and the windowing aperture (AI). Beam shaping reflective optics, a pair of off-axis parabolic mirrors (OAP) with 2× magnification, direct the QCL emission to fill the back aperture of a 0.56 NA BD-2 glass (Ge28Sb12Se60) AR coated condenser (LightPath Technologies, Orlando, FL, USA). The inverted transmission microscope uses interchangeable BD-2 glass AR coated 0.56 and 0.85 NA objectives in conjunction with a 250 mm focal length (FL) image forming mirror (F1). Planar mirrors (M) are placed to direct the beam at small incident angles to minimize the off-axis aberrations from spherical mirrors (F1 and F2). The intermediate image at AI is then focused with a 150 mm FL mirror (F2) onto a SBF161 128 × 128 pixel focal plane array (FPA) mercury cadmium telluride (MCT) detector (Lockheed Martin Corporation, Santa Barbara Focal Plane, Santa Barbara, CA, USA). These FPA MCT detectors have microsecond response times that allow for scanning speeds far faster than uncooled IR cameras that can only operate in the millisecond regime. MCT detectors also have the highest noise-equivalent power (NEP) ratings among broadband IR detectors which allow the instrument to maintain sufficient SNR even in areas of lower QCL power output. While uncooled FPAs and bolometers are available in much larger formats, their readout rates are currently limited to standard video rates of tens of frames per second and insufficient for implementation with fast tuning QCLs.
Figure 1.
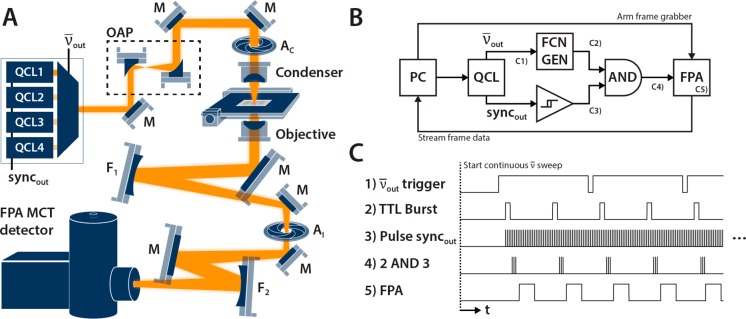
(A) Schematic of the QCL-based wide field imaging microscope configured in inverted transmission mode. The microscope is coupled to a 4 chip widely tunable QCL and a 128 × 128 FPA MCT detector. (B) Wiring diagram showing the primary control components of the system (stage omitted). The timing structure on the annotated trigger lines are then shown (not to scale). (C) A generalized synchronization protocol. The real-time wavenumber monitoring line output from the QCL controls an external oscillator that triggers the FPA depending on the specified spectral resolution and scan speed.
The microscope was paired with a widely tunable QCL source (LaserTune from Block Engineering, Marlborough, MA, USA) that contains 4 individual QCL chips with a combined tuning range of 776.9 to 1904.4 cm–1 that can be scanned at up to 25 cm–1/ms with emission powers between 0.5 and 15 mW. We have set the laser to pulse at 2 MHz with a 31 ns pulse width corresponding to a 6.2% duty cycle. The sweep speed is limited by the maximum 1612 Hz frame rate of the FPA (fFPA), the desired spectral resolution, and number of in-scan coadditions. The wiring diagram of the various control signals in the system is illustrated in Figure 1B. While sweeping, the laser outputs a TTL synchronization pulse as it crosses every 0.5 cm–1 for real-time wavenumber monitoring to correct for any nonlinearities in the tuning grating motion (Figure 1C1). This is used to trigger an external oscillator (Figure 1C2) that either: (a) bursts NB pulses per wavenumber trigger at the fFPA rate for NB ≥ 1 or (b) counts 1/NB wavenumber triggers for each pulse sent. The pulse train from the oscillator is used to trigger the FPA frame grabber after it is synchronized to the QCL’s pulse sync output (Figure 1C3). The sync output from this laser has a shark-fin wave shape, so it is first threshold with a Schmitt trigger and then combined via a logical AND gate with the pulse train from the external oscillator (Figure 1C4). The FPA acquires a frame when the trigger line is high; any additional triggers during the integration and refractory periods are ignored. The synchronization ensures that the laser fires an identical number of times within the FPA’s integration period (Figure 1C5) provided that the time jitter in the electronics is sufficiently small. Finally, the data from the FPA is streamed directly to a RAID disk array.
We have configured the laser to sweep across its entire 1127.5 cm–1 range at 0.38 cm–1/ms with an oscillator burst rate of 1500 Hz. This allows us to acquire a 128 × 128 pixel image with 4512 spectral bands at 0.25 cm–1 resolution in less than 3 s. Several postprocessing steps are conducted subsequently, especially to handle the noise in the QCL power output (Figure 2). The sharp intensity fluctuations in the 1500 cm–1 region, due to atmospheric water vapor absorption, are minimized as much as possible by containing the entire instrument within a nitrogen purged enclosure that brings the air humidity to approximately 5%. Using custom scripts written in MATLAB (The MathWorks, Nantucket, MA, USA), the dark current (IDC) is first subtracted from the raw FPA data to get the AC signal (IAC) (eq 1). We filter the data using a low pass FFT filter (FLP) with a sweep speed dependent cutoff frequency of 15 Hz (eq 2). The spectral data is then averaged by in-scan coaddition of every 16 bands (N) (eq 3), to yield a 4 cm–1 spectral resolution (Δv̅) data set containing 282 bands. The same procedure is performed on both the sample (IS) and background (I0) images prior to calculating absorbance (eq 4). The resulting single beam spectrum demonstrates the improvement over raw data.
| 1 |
| 2 |
| 3 |
| 4 |
Figure 2.
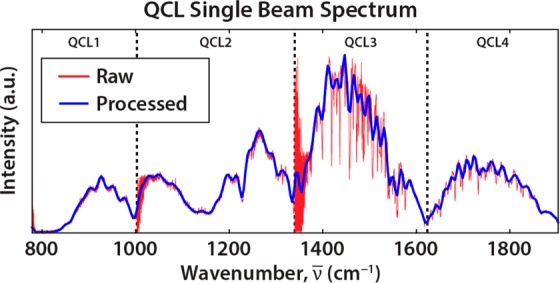
QCL raw power output is noisy when rapidly sweeping across the spectrum (red). The recorded single beam spectrum is noise reduced via postacquisition processes to yield a high-quality spectrum (blue). The crossover frequencies for each QCL chip are indicated and result in decreased signal intensity and increased spectral noise.
Our ultimate goal was to image tissue microarray (TMA) sections, which are standard tools for high throughput IR microscopy today. To image tissue samples 1.1 mm in diameter with the available field of view, we stitch a 5 × 5 or an 11 × 11 mosaic with a 10% frame overlap for the 0.56 and 0.85 NA objectives, respectively. An OptiScan microscope stage (Prior Scientific, Rockland, MA, USA) controls sample positioning while frame alignment and offsets are calibrated using an USAF 1951 optical resolution target. The adjacent frames are then merged per wavenumber with a linear weighted edge blend over the overlapping regions. Finally, the spectral images are processed in ENVI+IDL (ITT Visual Information Solutions, Boulder, CO, USA) using a minimum noise fraction (MNF) algorithm32 that removes the noise dominated principal components. The comparison images illustrated in this manuscript are displayed using a linear 2% stretch, followed by color and scale matching in ENVI and ImageJ (National Institutes of Health, Bethesda, MD, USA).
FT-IR Microscopy
Absorption reference images are acquired using a Varian Stingray 620-IR imaging microscope with a 680-IR FT-IR spectrometer (Agilent Technologies, Santa Clara, CA, USA) and a Spotlight 400 FT-IR imaging system with a Spectrum One spectrometer (PerkinElmer, Waltham, MA, USA). The Varian is also equipped with a liquid nitrogen cooled 128 × 128 pixel FPA. The microscope is configured with a 0.62 NA reflective Schwarzschild objective and matching condenser resulting in a total magnification of 40×. With image pixel sizes of 1.05 μm, it requires an 11 × 11 mosaic to image 1.1 mm diameter tissue cores. Images were collected with 16 coadditions, 102 μs detector integration time, and an undersampling ratio (UDR) of 4 where data points are acquired on every fourth zero crossing of the FT-IR’s internal laser reference. Interferograms were processed with a Blackman-Harris apodization function and then ratioed to a 128 coaddition background. The final truncated spectrum is stored with a 900–3800 cm–1 range at 4 cm–1 resolution. Images were stitched using the same weighted blending method described previously as well as MNF noise reduced in ENVI+IDL.
The Spotlight instrument uses a 16 element linear array (LA) detector to raster scan the sample. This instrument has a 15× 0.6 NA reflective Schwarzschild objective and a 6.25 μm image pixel size. This linear array is able to acquire spectra at higher SNR than an FPA so data is taken with only 2 coadditions and stored using a truncated 750–3800 cm–1 region at 4 cm–1 resolution. In addition to MNF noise reduction, the data is also corrected using PerkinElmer’s proprietary algorithm designed to eliminate CO2 and H2O vapor contributions.
Sample Specification and Preparation
In this study, we imaged an unstained breast tissue microarray (TMA) (BRC1501, US Biomax Inc. Rockville, MD, USA) containing 148 cores of various stages and grades of cancer placed on BaF2 substrate. Immunohistochemistry (IHC) stains of consecutive sections of the TMA were also imaged using an Axio Imager.M2 microscope (Carl Zeiss AG, Jena, Germany).
USAF 1951 optical resolution targets were also imaged for system characterization. Targets were patterned with SU-8 polymer (MicroChem, Westborough, MA, USA) on a polished 1 in. diameter barium fluoride (BaF2) substrate (ISP Optics, Irvington, NY, USA). The substrate was first cleaned with acetone and isopropyl alcohol (IPA) and then rinsed with distilled water. A 5 μm thick layer of SU-8 polymer was spun coat on BaF2 at 3000 rpm for 40 s. The sample was then baked in two steps to harden the SU-8 polymer: prebake at 65 °C for 1 min followed by a soft bake at 95 °C for 3 min. A lithography mask was contact aligned, and SU-8 was exposed to i-line UV radiation (365 nm) at 9 mW/cm2 for 10 s. After baking at 65 °C for 1 min and at 95 °C for 1 min, respectively, the SU-8 targets were developed in SU-8 developer for 1 min and rinsed with IPA.
Results and Discussion
The performance of the QCL microscope is demonstrated by imaging SU-8, a photoresist polymer that has a distinctive spectrum with multiple peaks throughout the fingerprint region, on an IR-transparent BaF2 substrate. It is patterned as a USAF 1951 resolution target which is commonly used to test the resolving power of imaging systems. Each group of bars, vertically arranged, contains 6 elements of decreasing size where each successive group is half the size of the previous one. The fifth group has features with sizes on the same order as the incident wavelength. We use this target to serve as a well characterized analog for tissue microarrays. Since both the tissue samples and SU-8 target are roughly the same thickness with features of comparable size, this type of target allows us to test these imaging systems under realistic conditions. The morphology of the sample has been shown to affect the recorded spectra.33,34 Especially when imaging with a coherent source where scattering and edge effects can cause unwanted artifacts in both the spatial and spectral domains, unstructured samples, such as commonly available chrome on glass targets, would result in an overestimation of real world optical performance. Furthermore, these target calibration images are 1.2 mm wide, and the area coverage of groups 4 and 5 is similar to a single tissue core. Through filtering, MNF processing, and mosaic blending, we show that the background nonuniformity and image tiling artifacts are barely noticeable which allows for clean large area TMA scans. To our knowledge, this data quality has not previously been reported.
The QCL microscope was configured to scan the SU-8 BaF2 target at 4 cm–1 spectral resolution across the fingerprint region 776.9 to 1904.4 cm–1. The same target was imaged using the two FT-IR instruments to serve as a standard for comparison. Here, in Figure 3A, we see a selection of images from the full spectral data set representing SU-8 polymer on an absorbing peak at 1248 cm–1. On a nonabsorbing wavenumber at 1552 cm–1 on the spectral baseline, we see minimal absorbance and only intensity due to edge scattering from features on the sample. The QCL microscope, however, surpasses both the FT-IR systems in terms of resolving power as shown by Figure 3B. These images show the absorbance of the sixth element of group 5 at 1248 cm–1, marked by the red arrows in Figure 3A. Alongside each image is the vertical absorbance profile of the horizontal set bars, marked by the red line. Each bar is 8.77 μm wide, which is approximately the same width as the incident wavelength. An interesting feature is clearly visible in the high magnification QCL image. Scattering from the edges of the SU-8 bar results in a loss in energy that is manifested as a sharp increase in the recorded absorbance at that spectral element. This is quite similar to the images of edges as seen in optical microscopy. The edge scattering is well-known in IR imaging but is likely amplified here by the high spatial coherence of the QCL source. As can be seen in Figure 3A, scattering-induced features are also present in the FT-IR data, although much less pronounced. As the size of the bars decrease and approach the wavelength of light, the scattering-enhanced edge signals merge with the central absorbance values.
Figure 3.

(A) SU-8 patterned USAF 1951 optical resolution target on BaF2 substrate imaged with the QCL microscope and two commercial FT-IR imaging systems. Images displayed are from an absorption band (1248 cm–1) and nonabsorbing region (1552 cm–1). The resolving limit of each system is tested with group 5 element 6 (red arrow). (B) Enlarged images of group 5 element 6 at 1248 cm–1, which has an 8.77 μm bar width, with y-profiles across the horizontal set of bars (red line) are plotted. Both QCL images are well resolved, the LA FT-IR image is unresolved, and the FPA FT-IR images are at the threshold of the Rayleigh criterion. (C) A comparison between the SU-8 absorption spectra between the QCL and FPA FT-IR imaging systems at 4 cm–1 resolution. The white scale bars displayed in all images are 100 μm in length.
The lateral resolution of each system is physically dependent on the diffraction limit. As per the Rayleigh resolution, the optical system is considered diffraction limited if able to distinguish objects separated by 0.61λ/NA. The two bars can be considered separable, per the Rayleigh criterion, if the intensity dip between them is at least 20–30% of the peak intensity. Furthermore, in order to satisfy the Nyquist criterion, the magnification of the image must be sufficient in order to achieve a spatial sampling rate at least twice the Rayleigh resolution at all mid-IR frequencies.35 Both objectives on the QCL system are able to clearly resolve these group 5 element 6 bar, reading near zero absorbance levels between the bars. The effective pixel sizes of 2.02 and 0.95 μm, respectively, for the 0.56 and 0.85 NA objectives result in a slight spatial oversampling at the lowest QCL emission wavenumber. Neither of the other instruments has the same resolving power. The bars are barely distinguishable when imaged by the LA FT-IR instrument due to its larger 6.25 μm pixel sizes. The FPA-equipped instrument has higher magnification optics with smaller 1.05 μm pixel sizes and is just able to resolve these bars; the absorbance dip of approximately 26% is at the Rayleigh criterion threshold. While the spatial fidelity using QCLs is seen to be excellent, as noted by us and other investigators, a spectral examination has not previously been provided.
Maintaining accuracy in the spectral domain of multiplexed QCL systems is a nontrivial process. Unlike a typical broadband FT-IR source which has a blackbody spectral profile and interferometrically determined spectral scale, each QCL unit is only tunable to roughly 200–300 cm–1 around its center wavenumber. When multiplexed together, depending on the manufacturer, these instruments can span large ranges but also have areas of low signal strength between center wavenumbers or discontinuities at crossover frequencies as seen in Figure 2. Errors typically manifest as low frequency baseline oscillations from laser pulse-to-pulse power fluctuations or sudden absorbance spikes in the case of tuning mismatches between the sample and background scans. In order to maintain spectral accuracy during a sweeping scan across a large wavenumber range, the switching time between QCL units, as well as the acceleration and deceleration of each tuning grating, however small, should still be accounted for. A simple interpolation to derive an image’s corresponding wavenumber from acquisition timestamps by assuming a linear tuning speed is not accurate. Therefore, the ability to monitor the emission wavenumber in real-time with a TTL trigger output is critical. This allows us to record the sample and background spectra sequentially. If real-time monitoring is not available, the SNR drops drastically in sweep mode; we have found that discretely stepping through each wavenumber is more beneficial despite the significant cost in scan speed.
One-hundred percent lines from randomly selected pixels are shown in Figure 4A for the linear array and FPA-based FT-IR imaging spectrometers and the QCL-based DF-IR instrument. A 100% line is often used to estimate the noise in FT-IR spectrometers. The use of the 100% is often to observe spectrum-to-spectrum consistency (flatness of the line) as well as to estimate the spectral noise. The response of the QCL-based instrument is flat but is significantly noisier than the other two. Specifically, we observed ∼4-fold higher noise for equivalent scans in the QCL system. Noise in the 100% line can be safely assumed to be the analytical noise at any wavenumber in an FT-IR spectrometer as each spectral point contributes to the noise at every point. Thus, temporal variance at a wavenumber is the same as spectral variance around that wavenumber. The spectral variance, however, is not a useful measure of the noise in a QCL-based system at a given wavenumber. By averaging 100% lines from 1000 pixels in Figure 4B, we see the noise in FT-IR imaging systems is reduced according to the well-known trading rules of FT-IR spectroscopy, but structure still remains in the QCL spectrum. This shows that there is both a random and a shot noise component, which also is not constant over the spectrum. This raises an interesting question on how variance at each wavenumber should be quantified in DF-IR systems, for example, to provide error bounds for measured absorbance. We recommend extracting that data from a time series and calculating the variance to obtain the error bounds. However, for static samples, it is known that the absorbance is invariant and the use of filtering techniques is well-justified (just as Fourier frequency bandpass filtering is employed in FT-IR spectroscopy). Thus, the issue of characterizing noise in a DF-IR system is much more complicated than the FT-IR case and best examined in detail with methods to obtain high quality data.
Figure 4.
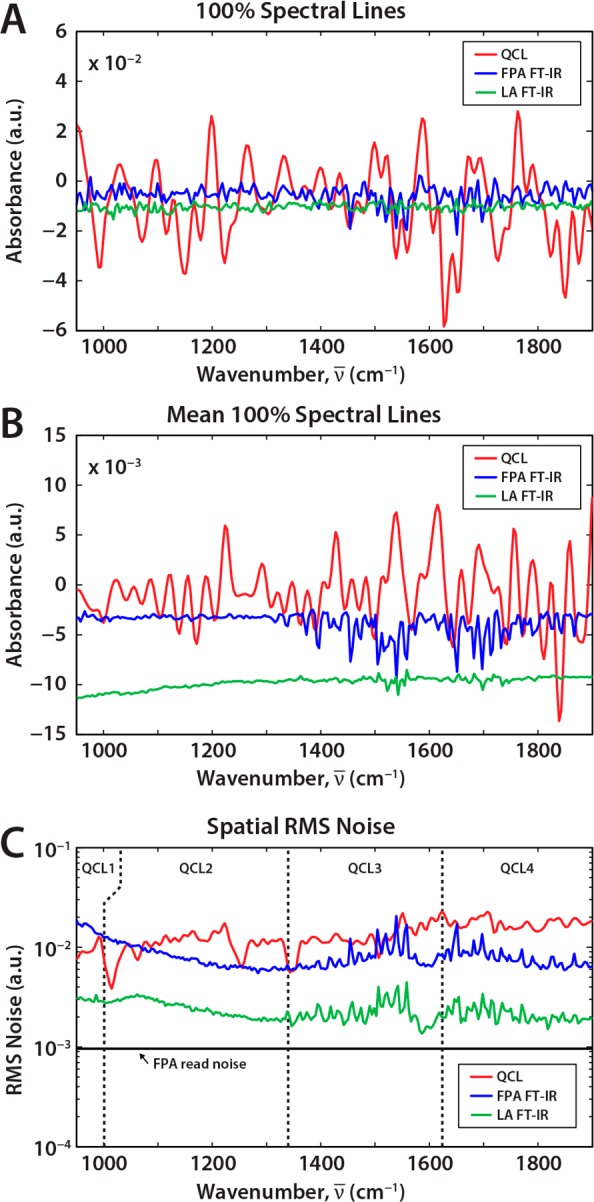
(A) 100% spectral lines extracted from randomly selected pixels on the sample substrate for the three imaging systems, all normalized to a single scan. (B) Averaged 100% spectral lines shows that the source (shot) noise persisting in QCL systems does not result in the same noise reduction as seen for the FT-IR (random noise) systems. (C) Spatial root-mean-square (RMS) variation in the 100% line shows that the random component of the FPA systems are the same while the LA-based system is significantly less noisy. The noise in an FPA frame from the detector is much smaller (FPA read noise), pointing to the significant potential for improvement in QCL-based systems.
We recognize that the performance of our system can be improved significantly over this first prototype and efforts are underway to do the same by a systematic analysis of noise. Here, it suffices to state that the spectral and temporal domains, in contrast to FT-IR spectroscopy, are not coupled. For any DF-IR spectrum, the spatial variation of the 100% line is not affected by shot-to-shot noise. Hence, we calculated the root-mean-square (RMS) absorbance for each wavenumber as shown in Figure 4C. This should provide the detector-dominated random noise for all cases. The noise contribution of the FPA to both the QCL and FT-IR imaging cases can be seen to be similar and both are significantly worse than the AC-coupled and filtered linear array. Note that there is potential for improvement as the FPA noise floor is significantly lower. Should innovative methods be developed to improve the performance of the QCL-FPA system, it may well rival the LA system’s performance. The data presented in Figure 4C were all normalized for a single scan and do not take the actual scanning time into account. These numbers are simply raw performance measures and differences in optical configuration, spectral range, and throughput need to be accounted for to accurately compare per pixel performance. For each setup, hence, we employ the typical experimental parameters (integration time, scanning rate) we use for biomedical tissue imaging. Under the parameters specified previously, a SNR of up to 260 was recorded for the QCL instrument for a single scan while imaging each tissue core in a tissue microarray (TMA) in approximately 2 min; in comparison, the FPA FT-IR spectrometer achieved a calculated SNR of 727 (16 coadditions, 2.5 h/core), and the LA-equipped system reached an even higher SNR of 1034 (2 coadditions, 1 h/core). Later in the manuscript, we discuss both the quality of the data as well as the SNR and speed implications to acquire data from tissue samples.
The spectra recorded by the QCL and FT-IR systems can also differ due to interference effects in using a spatially coherent source. The scattered light from each sample point interferes with others within a certain coherence area, thus encoding the sample structure in the signal intensity measured by the detector. In Figure 5, we compare the breast tissue images acquired from each instrument and examine the spectra from the marked location. Each spectrum has been linearly baseline corrected and normalized to the amide I peak at 1656 cm–1. We see that the spectra are well-matched between the DF-IR system and their FT-IR counterparts while the improvements in resolution are clearly evident.
Figure 5.
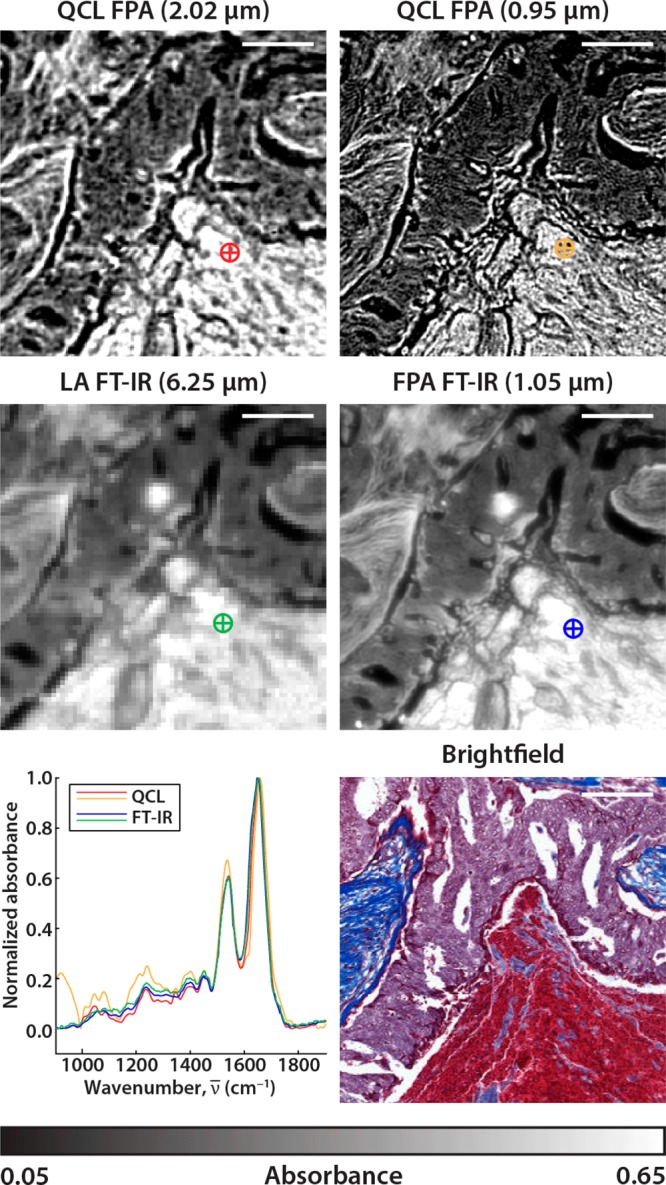
Images corresponding to the amide I absorption band at 1656 cm–1 from the C2 tissue core on the BRC1501 TMA are acquired by QCL and FT-IR instruments. A brightfield microscopy image of a Masson’s trichrome-stained serial section from the same core is included. The 4 cm–1 resolution fingerprint region spectra from a single pixel, baseline corrected and normalized to the amide I band at the marked location on the images are compared between each system. The scale bars represent 100 μm.
The advantage of the QCL instrument is the ability of the DF-IR system to scan through large sample areas quickly at single wavelengths. Scans at a discrete frequency are only limited by the time it takes for the microscope stage to reposition. For any biological sample, multiple bands are required for tissue classification, so the limit in imaging speed involves the retuning time of the QCL instrument as well. To test the system for long-term consistency regarding wavenumber tuning and pulse-to-pulse power output, we scan through all the cores available on a breast tissue microarray. The full BRC1501 TMA was acquired with the QCL microscope using the 0.56 NA objective (Figure 6A), resulting in a set of 55.3 Megapixel (9408 × 5880) images for each of the 282 wavenumber positions. The full scan area is approximately 1.5 cm by 2.5 cm so positional markers were assigned to each core to skip imaging empty space. This specific image is displayed at 1656 cm–1 on the amide I absorption band. Each tissue core is 1.1 mm in diameter and is scanned as a 5 × 5 frame mosaic in about 2 min with our parameters. In total, there are 148 tissue cores on this TMA, representing a scan time of roughly 5 h. Three select cores are imaged at 2-fold increased resolution with the high numerical aperture objective in under 10 min each (Figure 6B).
Figure 6.

(A) Absorbance data of 148 tissue cores from the BRC1501 TMA acquired by the QCL microscope with the 0.56 NA (2.02 μm) objective. The net scan time of the fingerprint ranging from 776.9 to 1904.4 cm–1 at 4 cm–1 resolution was approximately 5 h. Only the amide I absorbance band at 1656 cm–1 from the full spectral data set is displayed. Selected tissue cores (C2, C7, G5) are also imaged by the (B) QCL with the 0.85 NA (0.95 μm) objective, (C) LA FT-IR (6.25 μm), and (D) FPA FT-IR (1.05 μm). (E) A brightfield image of a serial core section treated with Masson’s trichrome stain as performed in traditional histological studies. The scale bars in all images represent 500 μm.
The LA FT-IR instrument scans 1 core per hour but at a 10-fold larger pixel size and a ∼4-fold higher SNR as noted previously. As may be surmised, there is no simple way to compare these systems. We believe each is suited to its specific use: the QCL system for fast scanning at high spatial quality but limited spectral range, the FPA FT-IR system for HD full spectrum imaging, and the LA FT-IR system for collecting very high quality spectra. Nevertheless, it is interesting to theoretically compare the systems by normalizing performance as per the trading rules of IR imaging where the pixel rate ratio (R) is proportional to the number of pixels (n), the acquisition time (t), and the resulting SNR.8
Since SNR has a time-squared dependence, we can normalize each of these benchmarks for equivalent SNR, implying that the QCL system can provide the high quality of the LA system slightly faster (2-fold), albeit with 10-fold smaller pixels and the smaller spectral range. Hence, to a crude approximation, the QCL system can be approximated to be ∼20-fold faster than a hypothetical LA FT-IR system. For another comparison, the FPA FT-IR instrument scanned at a rate of 2.5 h per core with an FPA representing a 75-fold increase in time. When we normalize for the FPA FT-IR instrument’s 3-fold higher SNR and its quarter pixel size, this implies that the QCL system is still ∼2-fold faster per pixel in this case. These discussions demonstrate that the QCL microscope provides us the option of fast spectral scans at rates competitive with current FT-IR instruments.
The major advantage, however, of the DF-IR approach lies in the reduced spectral scanning. Should only a few frequencies be required, the QCL system advantage will increase proportionally. The line width of our laser is less than 2 cm–1, and unlike FT-IR systems, the spectral resolving power does not diminish with scan time. The QCL data at 2 cm–1 contains ∼550 bands and is presented undersampled by a factor of 2 such that it matches the 4 cm–1 resolution FT-IR systems. To examine a single vibrational mode, the FT systems do have to collect the entire spectrum whereas the QCL system will collect a single frequency, raising its speed advantage further by ∼550-fold. This represents a net speed increase of over ∼1100-fold per wavenumber over the fastest available HD FT-IR system. A major shortcoming of present QCLs is the truncated wavelength range. Should laser systems be developed to cover the full midrange, it would only require 2-fold higher scanning times. Thus, the analytical advantages of using QCL-based systems are likely to persist. For scanning full spectral ranges, the advantage will be significant but will be impossible to match by FT systems for recording a few discrete frequencies.
We have demonstrated an initial design for a chemical imaging microscope employing a QCL source for DF-IR wide-field imaging. This QCL microscope consists of three primary subsystems that must be developed in tandem for optimal performance. Current implementations of multiplexed QCLs are still in their first generation and could improve with respect to wavenumber tuning range as well as power output and pulse-to-pulse stability. With the higher flux of QCLs, this opens up the possibility of cameras with larger pixel formats, faster readout rates, shorter integration times, and deeper charge wells. MCT detectors, while being sensitive, also have drawbacks in linearity and background. Linearizing the photometric response of MCT detectors is likely to be important to account for the strong intensity variations of QCLs, but we have refrained from examining this for now. For conventional MCT detectors, numerous strategies have been proposed,10,36 including incorporating linearized preamplifier circuits calibrated for the given detector.37 The optical performance of QCL-based microscopes is limited by the lack of commercially available high NA aspheric and achromatic microscope objectives in the mid-IR. IR reflective optics are not well suited toward tunable laser sources, and the majority of IR refractive optics are singlets prone to various aberrations. AR coatings typically run from either 3–5 or 8–12 μm while broad band AR coatings covering the full mid-IR are still limited to custom production optics. Innovations in optical design will likely be needed and spurred by the emergence of DF-IR microscopes. Lastly, a careful analysis of the data acquisition process and data is required to develop new signal processing techniques to handle the unique effects of laser coherence on the recorded spectral data as well as eliminate noise.
Conclusions
In our current implementation of the QCL microscope, the spatial resolving power surpasses that of the best commercial FT-IR imaging instruments while improvements in spectral quality have reached competitive levels. The QCL approach offers higher speeds for scanning large tissue arrays, but the nature of the DF-IR system is such that much smaller times become accessible for certain types of measurements. The complexities of working with a coherent source are ongoing issues, but the data demonstrate little difference from traditional globar sources to a first approximation. Using careful integration and postprocessing, we were able to achieve ∼(1100/N)-fold speedup for measuring the N essential spectral features of tissue. This enabled very large images (>50 Megapixels) to be acquired rapidly at high quality. These improvements in DF QCL imaging instrumentation, combined with further ongoing developments, will greatly enhance our ability to perform fast and efficient chemical imaging in cells and tissues.
Acknowledgments
We are grateful to Agilent Technologies for retrofitting our existing system with a prototype of their new high-performance imaging optics and especially to Dr. Mustafa Kansiz for his technical help. This work was supported in part by the National Institutes of Health via grant numbers 1R01CA138882 and 2R01EB009745.
The authors declare no competing financial interest.
Funding Statement
National Institutes of Health, United States
References
- Baker M. J.; Trevisan J.; Bassan P.; Bhargava R.; Butler H. J.; Dorling K. M.; Fielden P. R.; Fogarty S. W.; Fullwood N. J.; Heys K. A.; Hughes C.; Lasch P.; Martin-Hirsch P. L.; Obinaju B.; Sockalingum G. D.; Sulé-Suso J.; Strong R. J.; Walsh M. J.; Wood B. R.; Gardner P.; Martin F. L. Nat. Protoc. 2014, 9, 1771–1791. [DOI] [PMC free article] [PubMed] [Google Scholar]
- Fernandez D. C.; Bhargava R.; Hewitt S. M.; Levin I. W. Nat. Biotechnol. 2005, 23, 469–474. [DOI] [PubMed] [Google Scholar]
- Paschalis E. P.; Verdelis K.; Doty S. B.; Boskey A. L.; Mendelsohn R.; Yamauchi M. J. Bone Miner. Res. 2001, 16, 1821–1828. [DOI] [PubMed] [Google Scholar]
- Lasch P.; Haensch W.; Naumann D.; Diem M. Biochim. Biophys. Acta 2004, 1688, 176–186. [DOI] [PubMed] [Google Scholar]
- Matthäus C.; Boydston-White S. Appl. Spectrosc. 2006, 60, 1–8. [DOI] [PMC free article] [PubMed] [Google Scholar]
- Petibois C.; Déléris G. Trends Biotechnol. 2006, 24, 455–462. [DOI] [PubMed] [Google Scholar]
- Gazi E.; Dwyer J.; Gardner P.; Ghanbari-Siahkali A.; Wade A. P.; Miyan J.; Lockyer N. P.; Vickerman J. C.; Clarke N. W.; Shanks J. H.; Scott L. J.; Hart C. A.; Brown M. J. Pathol. 2003, 201, 99–108. [DOI] [PubMed] [Google Scholar]
- Bhargava R.; Levin I. W.. Spectrochemical Analysis Using Infrared Multichannel Detectors; Sheffield Analytical Chemistry Series; Wiley: New York, 2008. [Google Scholar]
- Lewis E. N.; Treado P. J.; Reeder R. C.; Story G. M.; Dowrey A. E.; Marcott C.; Levin I. W. Anal. Chem. 1995, 67, 3377–3381. [DOI] [PubMed] [Google Scholar]
- Griffiths P.; de Haseth J. A.. Fourier transform infrared spectrometry, 2nd ed.; John Wiley & Sons: Hoboken, NJ, 2007; p 560. [Google Scholar]
- Bhargava R.; Levin I. W. Anal. Chem. 2001, 73, 5157–5167. [DOI] [PubMed] [Google Scholar]
- Bhargava R. Appl. Spectrosc. 2012, 66, 1091–1120. [DOI] [PMC free article] [PubMed] [Google Scholar]
- Nasse M. J.; Walsh M. J.; Mattson E. C.; Reininger R.; Kajdacsy-Balla A.; Macias V.; Bhargava R.; Hirschmugl C. J. Nat. Methods 2011, 8, 413–416. [DOI] [PMC free article] [PubMed] [Google Scholar]
- Hirschmugl C. J.; Gough K. M. Appl. Spectrosc. 2012, 66, 475–491. [DOI] [PubMed] [Google Scholar]
- Kodali A.; Schulmerich M.; Ip J.; Yen G.; Cunningham B. T.; Bhargava R. Anal. Chem. 2010, 82, 5697–5706. [DOI] [PMC free article] [PubMed] [Google Scholar]
- Faist J.; Capasso F.; Sivco D. L.; Sirtori C.; Hutchinson A. L.; Cho A. Y. Science 1994, 264, 553–556. [DOI] [PubMed] [Google Scholar]
- Luo G. P.; Peng C.; Le H. Q.; Pei S. S.; Hwang W.-Y.; Ishaug B.; Um J.; Baillargeon J. N.; Lin C.-H. Appl. Phys. Lett. 2001, 78, 2834. [Google Scholar]
- Capasso F. Opt. Eng. 2010, 49, 111102. [Google Scholar]
- Wysocki G.; Curl R. F.; Tittel F. K.; Maulini R.; Bulliard J. M.; Faist J. Appl. Phys. B: Laser Opt. 2005, 81, 769–777. [Google Scholar]
- Kosterev A. A.; Tittel F. K. IEEE J. Quantum Electron. 2002, 38, 582–591. [Google Scholar]
- Namjou K.; Cai S.; Whittaker E. A.; Faist J.; Gmachl C.; Capasso F.; Sivco D. L.; Cho A. Y. Opt. Lett. 1998, 23, 219–221. [DOI] [PubMed] [Google Scholar]
- Rao G. G. N.; Karpf A. Appl. Opt. 2011, 50, A100–A115. [DOI] [PubMed] [Google Scholar]
- Paldus B. A.; Harb C. C.; Spence T. G.; Zare R. N.; Gmachl C.; Capasso F.; Sivco D. L.; Baillargeon J. N.; Hutchinson A. L.; Cho A. Y. Opt. Lett. 2000, 25, 666–668. [DOI] [PubMed] [Google Scholar]
- Kölhed M.; Haberkorn M.; Pustogov V.; Mizaikoff B.; Frank J.; Karlberg B.; Lendl B. Vib. Spectrosc. 2002, 29, 283–289. [Google Scholar]
- Brandstetter M.; Koch C.; Genner A.; Lendl B. SPIE Proc. 2013, 8993, 89931U. [Google Scholar]
- Kole M. R.; Reddy R. K.; Schulmerich M. V.; Gelber M. K.; Bhargava R. Anal. Chem. 2012, 84, 10366–10372. [DOI] [PMC free article] [PubMed] [Google Scholar]
- Bassan P.; Weida M. J.; Rowlette J.; Gardner P. Analyst 2014, 139, 3856–3859. [DOI] [PubMed] [Google Scholar]
- Yeh K.; Schulmerich M.; Bhargava R. Proc. SPIE 2013, 8726, 87260E. [Google Scholar]
- Phillips M. C.; Ho N. Opt. Express 2008, 16, 1836–1845. [DOI] [PubMed] [Google Scholar]
- Guo B.; Wang Y.; Peng C.; Luo G. P.; Le H. Q. Appl. Spectrosc. 2003, 57, 811–822. [DOI] [PubMed] [Google Scholar]
- Kröger N.; Egl A.; Engel M.; Gretz N.; Haase K.; Herpich I.; Kränzlin B.; Neudecker S.; Pucci A.; Schönhals A.; Vogt J.; Petrich W. J. Biomed. Opt. 2014, 19, 111607. [DOI] [PubMed] [Google Scholar]
- Reddy R. K.; Bhargava R. Analyst 2010, 135, 2818–2825. [DOI] [PubMed] [Google Scholar]
- Davis B.; Carney P.; Bhargava R. Anal. Chem. 2010, 82, 3474–3486. [DOI] [PubMed] [Google Scholar]
- Davis B.; Carney P.; Bhargava R. Anal. Chem. 2010, 82, 3487–3499. [DOI] [PubMed] [Google Scholar]
- Reddy R. K.; Walsh M. J. M.; Schulmerich M. V.; Carney P. S.; Bhargava R. Appl. Spectrosc. 2013, 67, 93–105. [DOI] [PMC free article] [PubMed] [Google Scholar]
- Cazes J.Analytical instrumentation handbook; CRC Press: Boca Raton, FL, 2004. [Google Scholar]
- Hoult R. A.; Ragusa R. P.. Detector preamplifier for use with a MCT detector. US4682022 A, 1987.