Abstract
Summary: Protein function prediction (PFP) is an automated function prediction method that predicts Gene Ontology (GO) annotations for a protein sequence using distantly related sequences and contextual associations of GO terms. Extended similarity group (ESG) is another GO prediction algorithm that makes predictions based on iterative sequence database searches. Here, we provide interactive web servers for the PFP and ESG algorithms that are equipped with an effective visualization of the GO predictions in a hierarchical topology.
Availability: PFP/ESG servers are freely available at http://kiharalab.org/web/pfp.php and http://kiharalab.org/web/esg.php, or access both at http://kiharalab.org/pfp_esg.php
Contact: dkihara@purdue.edu
Supplementary information: Supplementary data are available at Bioinformatics online.
1 INTRODUCTION
The rapid growth of genomics and proteomics technologies has posed a major challenge of large-scale automatic annotations of newly sequenced data that awaits functional interpretation. Advanced algorithms can often provide more accurate annotations with a larger coverage than conventional function prediction methods that use homology as the source of information. Here we developed web servers for our two sequence-based function prediction algorithms, protein function prediction (PFP) and extended similarity group (ESG).
PFP extends traditional PSI-BLAST (Altschul et al., 1997) search by extracting and scoring Gene Ontology (GO) annotations from distantly similar sequences and by applying contextual associations of GO terms observed in the annotation database to the scoring scheme (Hawkins et al., 2006, 2009). PFP was ranked the best in the function prediction category in the Critical Assessment of Techniques for Protein Structure Prediction (López et al., 2007).
ESG performs an iterative sequence database search and assigns a probability score to GO terms based on its relative similarity scores to the multiple-level neighbors in a protein similarity graph (Chitale et al., 2009). ESG was shown to outperform conventional methods in a thorough benchmark study. In the large-scale community-based critical assessment of protein function annotation experiment, ESG was ranked fourth in predicting Molecular Function GO terms among 54 participating groups (Radivojac et al., 2013). Thus, both PFP and ESG have been rigorously benchmarked both in the original papers and in objective assessments by the community. Predictive performance of the two methods is discussed in Supplementary Data.
2 METHODS
2.1 PFP algorithm
The PFP algorithm uses PSI-BLAST to obtain sequences hits for a target sequence and predicts GO terms. PFP computes the score for GO term fa, s(fa), as follows:
where N is the number of sequence hits considered in the PSI-BLAST hits, Nfunc(i) is the number of GO annotations for the sequence hit i, E_value(i) is the PSI-BLAST E-value for the sequence hit i, fj is the j-th annotation of the sequence hit i, and constant b takes value 2 (= log10100). The conditional probabilities P(fa|fj) consider co-occurrence of GO terms observed in sequence annotations. To take into account the hierarchical structure of the GO, PFP transfers the raw score to parental terms by computing the proportion of proteins annotated with fa relative to all proteins that belong to the parental GO term in the database.
2.2 ESG algorithm
The ESG algorithm recursively performs PSI-BLAST searches using sequences that are retrieved by the initial search from the query sequence. Each sequence hit in a search is assigned a weight that is computed as the proportion of the -log(E_value) of the sequence relative to the sum of the weights from all the sequence hits of the same search round. This weight is assigned to GO terms annotating the sequence hit. Weights for GO terms found in the second iteration search are computed in the same fashion. Finally, the score for a GO term is computed as the sum of weights from the two levels of searches.
PFP and ESG have different characteristics: PFP is designed to have a larger coverage by retrieving annotations widely from even weakly similar sequences, while ESG is for better specificity by taking consistently predicted GO terms in an iterative search. This is further discussed in Supplementary Data.
2.3 Input
Input of PFP and ESG is one or more query protein sequences in the FASTA format. Users can submit sequences separated by line breaks or upload a file containing sequences.
2.4 Output
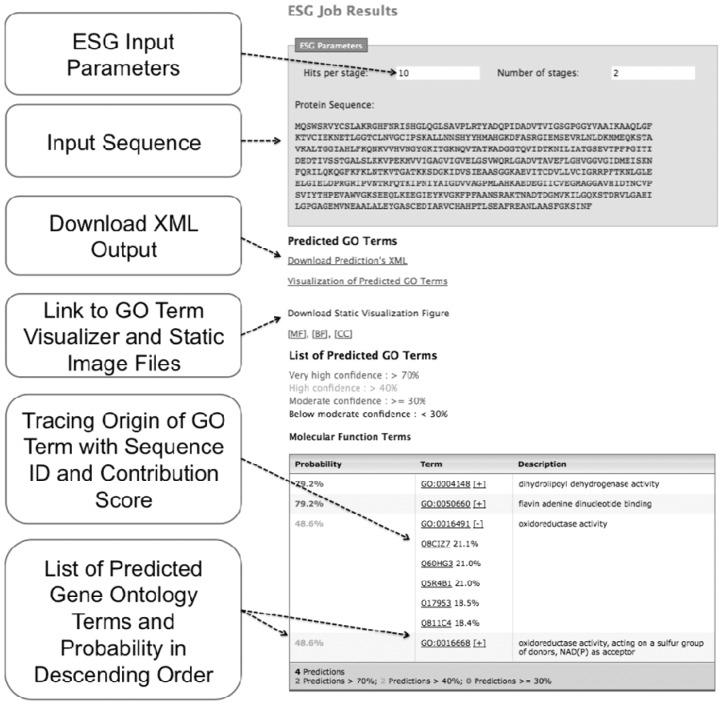
Both PFP and ESG algorithms predict GO terms for a given protein sequence. ESG outputs a score that ranges from [0,1]. Predicted GO terms are listed on the result page (Fig. 1). Predictions are classified into four confidence levels: very high, high, moderate and the rest. In addition, an XML file is provided that summarizes the prediction. Moreover, predicted GO terms are visualized as discussed below. Submitted jobs are tracked and kept in a MySQL database so that the user can retrieve the results later. Average computational time for PFP and ESG is 40.1 s and 7.5 min, respectively (Supplementary Fig. S1).
Fig. 1.
Output page of ESG. A result page of PFP is essentially the same
2.4.1 Tracing origin of predicted GO terms
The servers provide sequence IDs indicating the source of each predicted GO term. Since PFP and ESG often retrieve GO annotations from distantly related sequences that are not obvious homologs to the query, the tracing function will clarify how predictions are computed and can provide insights into the function of the query protein. For each predicted GO term, clicking a [+] sign will open a list of sequence IDs that contributed scores to the GO term. The contribution of each sequence is shown as the percentage of the score that originates from the sequence.
2.4.2 GO term visualization
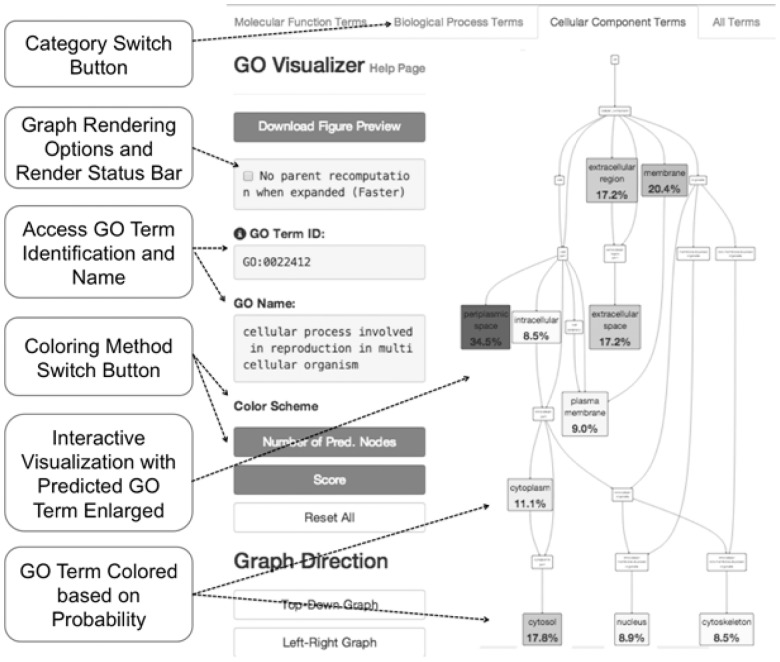
The GO term visualizer intuitively shows predicted GO terms in the GO hierarchy (Fig. 2). A visualized GO graph can be zoomed in and out or further expanded to see sub-nodes of a branch. GO terms are colored based on their assigned probability. GO terms can be also colored based on the number of child nodes under them that are directly predicted. In addition, visualization in Cytoscape allows three modes of GO hierarchy visualization (tree, radial and circle) and enables users to select and drag around groups of GO terms.
Fig. 2.
GO term visualization. Predicted GO terms are shown in colors on the GO hierarchy
3 SUMMARY
Web servers of two sequence-based function prediction methods, PFP and ESG, are developed. The servers are equipped with a GO visualization tool, which can intuitively show predicted GO terms on the GO hierarchy.
Funding: This work was supported partly by the National Institutes of Health (R01GM097528), the National Science Foundation (IIS1319551, DBI1262189, IOS1127027) and National Research Foundation of Korea (NRF-2011-220-C00004).
Conflict of interest: none declared.
Supplementary Material
REFERENCES
- Altschul SF, et al. Gapped BLAST and PSI-BLAST: a new generation of protein database search programs. Nucleic Acids Res. 1997;25:3389–3402. doi: 10.1093/nar/25.17.3389. [DOI] [PMC free article] [PubMed] [Google Scholar]
- Chitale M, et al. ESG: extended similarity group method for automated protein function prediction. Bioinformatics. 2009;25:1739–1745. doi: 10.1093/bioinformatics/btp309. [DOI] [PMC free article] [PubMed] [Google Scholar]
- Hawkins T, et al. Enhanced automated function prediction using distantly related sequences and contextual association by PFP. Protein Sci. 2006;15:1550–1556. doi: 10.1110/ps.062153506. [DOI] [PMC free article] [PubMed] [Google Scholar]
- Hawkins T, et al. PFP: automated prediction of Gene Ontology functional annotations with confidence scores using protein sequence data. Proteins. 2009;74:566–582. doi: 10.1002/prot.22172. [DOI] [PubMed] [Google Scholar]
- López G, et al. Assessment of predictions submitted for the CASP7 function prediction category. Proteins. 2007;69:165–174. doi: 10.1002/prot.21651. [DOI] [PubMed] [Google Scholar]
- Radivojac P, et al. A large-scale evaluation of computational protein function prediction. Nat. Meth. 2013;10:221–227. doi: 10.1038/nmeth.2340. [DOI] [PMC free article] [PubMed] [Google Scholar]
Associated Data
This section collects any data citations, data availability statements, or supplementary materials included in this article.


