

Summary
It is unknown if the white matter properties associated with specific visual networks selectively affect category-specific processing. In a novel protocol we combined measurements of white matter structure, functional selectivity, and behavior in the same subjects. We find two parallel white matter pathways along the ventral temporal lobe connecting to either face-selective or place-selective regions. Diffusion properties of portions of these tracts adjacent to face- and place-selective regions of ventral temporal cortex correlate with behavioral performance for face or place processing, respectively. Strikingly, adults with developmental prosopagnosia (face blindness) express an atypical structure-behavior relationship near face-selective cortex, suggesting that white matter atypicalities in this region may have behavioral consequences. These data suggest that examining the interplay between cortical function, anatomical connectivity, and visual behavior is integral to understanding functional networks and their role in producing visual abilities and deficits.
Introduction
The human ventral temporal cortex (VTC) contains spatially segregated regions that process faces (Kanwisher et al., 1997; Weiner and Grill-Spector, 2010) and places (Aguirre et al., 1998; Epstein and Kanwisher, 1998). These regions have been linked to the perception of stimuli from these categories, as responses are higher when these stimuli are perceived as compared to when they are present but not perceived (Allison et al., 1994; Grill-Spector et al., 2004; Moutoussis and Zeki, 2002 ; Tong et al., 1998) and perturbing responses in these regions by electrical stimulation disrupts perception (Allison et al., 1994; Megevand et al., 2014; Parvizi et al., 2012; Rangarajan et al., 2014). These category-selective regions follow a regular arrangement relative to cortical folding: the mid-fusiform sulcus (MFS) predicts the location of face-selective regions (Weiner et al., 2014; Weiner and Grill-Spector, 2010) as well as cytoarchitectonic regions in the fusiform gyrus (FG, Weiner et al., 2014), and the collateral sulcus (CoS) predicts the location of place-selective regions (Nasr et al., 2011; Weiner and Grill-Spector, 2010). This orderly organization suggests that anatomical factors such as white matter connectivity may also constrain this functional topology (Tallinen et al., 2014; Zeki and Shipp, 1988). However, the role of white matter in perceptual processing and in shaping the functional topology of VTC is not as well understood.
Diffusion-weighted imaging (DWI) combined with tractography has been used to examine the organization of white matter in the ventral temporal lobe (VTL) and its role in behavior. Several studies have reported that properties of the inferior longitudinal fasciculus (ILF), a large white matter tract interconnecting the occipital and temporal lobes, are correlated with behavior. However, findings vary with respect to the behavior that is coupled with ILF diffusion properties, as well as the direction of the correlation. For example, Thomas et al., (2008) reported that typical subjects have higher FA in the ILF than developmental prosopagnosic (DP) subjects, while Tavor et al. (2013) found that lower values of FA in typical subjects are associated with better face recognition. Other studies report that the FA of the ILF also correlates negatively with reading ability (Yeatman et al., 2012a) and recognition memory of places (Tavor et al. 2013), but correlates positively with social cognition (De Pisapia et al., 2013), and pitch perception (Dohn et al., 2013).
The apparently nonspecific role of the ILF in a variety of behaviors may not be surprising considering the ILF is a large fasciculus reaching up to 12cm in length. This white matter highway courses from the occipital to the temporal lobe (Catani et al., 2003), passing along its extent early, intermediate, and high-level visual regions, any one of which may be a rich source contributory projections (Figure 1A). Although it is clear from prior studies that the ILF is important for behavior, understanding how white matter relates to functional regions or relays category-specific information is limited through such large-scale investigations.
Figure 1. The inferior longitudinal fasciculus (ILF) traverses many functional regions of interest (fROIs) in the occipital and temporal lobes.

(A) An example ILF (cyan) in the right hemisphere of an adult passes many fROIs including low-level (V1-hV4) regions in the occipital lobe to high-level category-selective regions in ventral temporal cortex (VTC). These fROIs are by no means an exhaustive list of regions connecting to the ILF, further underscoring the nature of the ILF as a large axonal highway relaying information between the occipital and temporal lobes. (B) Three possible organizations of functionally defined white matter (FDWM) connecting place- or face-selective cortex (green and red, respectively) to the anterior temporal lobe relative to the ILF (blue). Top: Subsection model— mFus-fibers and CoS-fibers are overlapping subsets of the core ILF. Middle: Separate tract model— mFus- and CoS-fibers are parallel tracts separate from the ILF. Bottom: Local segregation model— mFus- and CoS-fibers are spatially distinct close to functional regions and partially converge in the anterior temporal lobe.
Recent studies have examined white matter in the occipital and temporal lobes at a finer scale, with results suggesting the existence of specific white matter connections associated with face- and place-selective regions. Gschwind, Pyles, and colleagues reported higher connectivity among face-selective regions compared to surrounding cortex (Gschwind et al., 2012; Pyles et al., 2013). Additionally, Saygin and colleagues showed that unique white matter connectivity fingerprints differentiate face- and place-selective regions in VTC (Saygin et al., 2012). These findings suggest that face- and place-selective regions communicate through separable white matter pathways. However, the relationship of these fine-scale tracts to behavior and to large-scale fasciculi such as the ILF remains unclear.
While structure and function are likely inextricable in the organization of VTC, we address two open questions in this paper. First, what is the anatomical arrangement of white matter tracts in the VTL associated with category-specific regions? Second, if there are separate tracts for different regions, do their white matter properties relate to category-specific behavior?
In each subject, we identified white matter tracts connecting face- or place-selective regions with the anterior temporal lobe (Figure 2; Wakana et al., 2004). This approach allowed us to examine the arrangement of white matter tracts relative to cortical anatomy and to the ILF. We explored three possible schemes of white matter connections associated with functional regions in VTC. Axons associated with face- and place-selective regions may be part of a large interconnected network in the VTL. That is, they may merge with the ILF like ramps to a highway (Figure 1b-top), consistent with studies showing that the structural properties of the ILF are important for both face and place recognition. Conversely, axons associated with face- and place-selective regions may be parts of segregated networks arranged laterally-medially for face and place processing, respectively, and may remain segregated throughout the VTL (Figure 1b-middle) as suggested by previous findings (Gschwind et al., 2012; Pyles et al., 2013; Saygin et al., 2012). As an intermediate scheme, there may be a lateral-medial segregation of white matter close to functional regions, and convergence of these in anterior sections of the temporal lobe where associative knowledge combining information across domains is generated (Figure 1b-bottom) (Haskins et al., 2008).
Figure 2. Functionally defining white matter tracts by combing fMRI and DWI.

(A) Example adult cortical surface depicting mFus-faces/FFA-2 (red, faces> places & objects, p< 0.001, voxel level) and CoS-places/PPA (green, places> faces & objects, p<0.001, voxel level). Boundaries of retinotopic regions are indicated in black. Dashed-white: Mid fusiform sulcus (MFS). (B) A coronal slice from a different example adult indicating the mFus-faces/FFA-2, CoS-places/PPA as well as 6mm spheres extending into white matter that were expanded from the center of each fROI to define mFus- and CoS-fibers. (C) Functionally defined white matter (FDWM) was defined as all fibers intersecting the spheres as illustrated in B with the anterior anatomical plane where the temporal and frontal lobes separated (gray rectangular plane). Resulting mFus- and CoS-fibers of a representative subject with the average location of the mFus and CoS spheres across all subjects marked on the scale bar (zero is anterior commissure).
Second, we examined whether diffusion properties of the white matter associated with face- and place-selective regions correlate with category-specific performance in both typical adults and adults with developmental prosopagnosia (DP) (McConachie, 1976). DP is a high-level visual deficit characterized by a specific impairment in recognizing faces despite having normal vision, intelligence, and socio-cognitive abilities (Behrmann M., 2011; Duchaine, 2011). Comparing structure-behavior correlations in DPs versus typical adults allows examination of how these relationships may differ in subjects with deficits in face perception. We used the Benton Face Recognition task (Benton et al., 1983) to assess face processing ability and a scene recognition memory task (Golarai et al., 2010) to assess place processing ability.
White matter properties were estimated through diffusion-weighted imaging (DWI), which is sensitive to the diffusion of water. Free-diffusing water in white matter voxels can be summarized by the degree of directionality of diffusion in a single direction versus all possible directions, known as fractional anisotropy (FA). FA reflects a ratio between axial diffusivity (AD), which is parallel to the main diffusion direction, and radial diffusivity (RD), which is perpendicular (Basser and Pierpaoli, 1996; Beaulieu, 2002). Changes in either radial or axial diffusivity can affect FA and may have behavioral consequences. For example, FA can increase because of greater diffusion along the main direction (e.g. from tighter axonal spacing), or from lowered diffusion in other directions (e.g. from greater myelination). Either can improve information relay and result in a positive correlation with behavior. A reduction in FA, however, does not necessarily imply compromised axonal properties (Jones, 2008). For instance, if a voxel close to cortex has a main diffusion axis that runs parallel to the cortical surface, then increases in the myelination or number of axons diving into the nearby cortex would actually reduce FA. Thus, a meaningful correlation between FA and behavior can be either positive or negative, and depends not only on the degree of myelination and axon density, but also on local environmental factors such as the orientation of axons of interest relative to the main diffusion axis.
We also examined the relationship between FA and face and place processing at two spatial scales: the level of the entire tract and the level of white matter local to face- and place-selective regions. Finding that a behavioral measure is associated with fiber properties along the entire length of a tract would suggest that the connectivity between distal cortical regions might be important for that behavior. Alternatively, finding that a behavioral measure is associated with properties of white matter in the local vicinity of a specific functional region would suggest that the local connectivity of that region is likely key to that behavior. Indeed, examining local white matter properties maximizes the probability of measuring from axons belonging to category-selective neurons in the neighboring cortical sheet.
Results
Separate white matter tracts are associated with face- and place-selective regions
We first identified the white matter tracts associated with regions of VTC selective for faces or places in nine typical adults. We used fMRI and a standard localizer (Golarai et al., 2010) to functionally define in each subject a face-selective region (mFus-faces/FFA-2) on the lateral fusiform gyrus (FG) overlapping the anterior tip of the MFS (Weiner et al., 2014; Weiner and Grill-Spector, 2010), and a place-selective region (CoS-places/PPA) medial to mFus-faces on the collateral sulcus (CoS) (Epstein and Kanwisher, 1998; Nasr et al., 2011) (Figure 2A). We then used probabilistic tractography to create a whole-brain connectome in each subject using constrained spherical deconvolution (Tournier et al., 2007) to model crossing fibers and track closer to cortex (Experimental Procedures).
Standard practice in tractography is to generate a connectome (Sporns et al., 2005) from diffusion measurements without validating the resulting tracts. We used modern probabilistic fiber tracking methods (Tournier et al., 2012), which have been shown to more accurately represent human white matter (Pestilli et al., 2014). In addition, we employed a recently developed method Linear Fascicle Evaluation (LiFE; see Experimental Procedures) to evaluate our fiber tracking results (Pestilli et al., 2014). LiFE eliminates false alarm fibers and tests the strength of evidence in support of tracts of interest. To do so, LiFE builds a model of diffusion measurements from the candidate probabilistic connectome and then tests how well each fiber predicts the actual diffusion measurements from which the connectome was derived. In doing so, it eliminates the false alarm fibers that do not predict diffusion measurements. Applying LiFE to our data generated an optimized connectome that contained 40.6% ± 1.6% fewer fibers than the candidate connectome.
From the optimized connectome we extracted the white matter tracts that traverse the VTL from posterior to anterior that intersect with either mFus-faces/FFA-2 or CoS-places/PPA and an anatomical plane in the anterior temporal lobe used to define the anterior end of the ILF (see Experimental Procedures, Figure 2C). We refer to these tracts as functionally defined white matter (FDWM) as they are defined based on their intersection with functional regions of interest (fROI). Using this FDWM procedure, we found two white matter tracts arranged from posterior to anterior along the VTL. One tract was located laterally and inferiorly, intersecting with mFus-faces (mFus-fibers). The other tract was located more medially and superiorly, intersecting with CoS-places (CoS-fibers; Figure 2C). Notably, this medial-lateral separation in the FDWM of face- and place-selective cortex was visible in every subject and hemisphere (Figure 3A).
Figure 3. FDWM mFus- and CoS-fibers in individual subjects.

(A) mFus-fibers (red) and CoS-fibers (green). First 9 panels illustrate typical adults from group 1, the rest are developmental prosopagnosics (DP). (B) Validation of mFus-fibers and CoS-fibers using the virtual lesion method implemented in the Linear Fascicle evaluation (LiFE) software. Root-mean-square error (RMSE) was significantly lower (p<0.05) when mFus and CoS fiber tracts were included in the connectome model than in the model in which these tracts were virtually lesioned. There were no significant difference between typical adults (red) and DP subjects (gray). (C) In posterior regions, the bifurcation of the mFus and CoS fiber tracts is systematically arranged relative to the mid-fusiform sulcus (MFS). Top: a coronal slice of a typical subject depicting the topology of the CoS, MFS, and occipitotemporal sulcus (OTS). Bottom: center of mFus- (red) and CoS-fibers (green) relative to the anterior fundus of the MFS. Each point is a subject.
Because this is the first study to identify mFus- and CoS-fibers, we validated these tracts using a virtual lesion method implemented in LiFE, in which we evaluated the strength of evidence supporting the identified tracts (Experimental Procedures). This is accomplished by examining the effect of a virtual lesion of an identified tract on the ability to predict diffusion measurements in an independent DWI dataset. In other words, we (1) computed for both the lesioned and unlesioned connectome a cross-validated root mean square error (RMSE) between the diffusion measurements predicted by the connectome model and actual diffusion measurements in a second independent DWI set and (2) compared the RMSE of the lesioned and unlesioned connectomes. A positive difference in the RSME between the unlesioned and lesioned model would provide evidence that the unlesioned model is a better model of connectivity. We found that the connectome including mFus-fibers and CoS-fibers had significantly lower RMSE in predicting the diffusion measurements in the second DWI dataset than a connectome in which the tracts had been virtually lesioned (Figure 3B). These results indicate that the separate tracts that we identified associated with mFus-faces and CoS-places, respectively, are reliable because they significantly improve modeling the underlying structure of VTL white matter.
The anatomy of mFus- and CoS-fibers shows that they are arranged along an anterior-posterior axis in VTL and are largely non-overlapping. They formed distinct tracts in their posterior halves, where the percent of shared voxels between each tract was relatively small (mFus-fibers: 3.2% ± 2.1%; CoS-fibers: 1.9% ± 2.4%). In their anterior halves, where tracts partially converged, the overlap was more than five times greater (mFus-fibers: 14.1% ± 4.4%; CoS-fibers: 12% ± 7.8%). In addition, CoS-fibers were on average 2.8 times closer to cortex (2.5mm ± 1.2mm) than mFus-fibers (4.1mm ± 2mm), t(30)=2.58, p=0.01. We found little evidence of white matter tracts directly connecting mFus-faces to CoS-places. There were no tracts interconnecting mFus-faces and CoS-places in 75% of hemispheres. In the remaining hemispheres, these tracts did not survive cross-validation testing by LiFE (ΔRMSE not significantly > 0; right hemisphere: t(3)=1.4, p=0.17; left hemisphere: t(3)=0.59, p=0.56), suggesting that direct connectivity from mFus-faces to CoS-places may not exist. Interestingly, the bifurcation of mFus-fibers and CoS-fibers was arranged in a consistent manner relative to cortical folding. Tracts associated with mFus-faces pass above the mid-fusiform sulcus (MFS), a sulcus that longitudinally bisects the fusiform gyrus (Weiner et al., 2014), and tracts associated with CoS-places are located 1cm more medially (Figure 3C).
Examining the location of the mFus-fibers and CoS-fibers relative to the ILF shows that they lie ventral to, and are largely separate from, the ILF (Figure 4A, Movie S1). We quantified their spatial relationship with respect to the ILF in two ways. First, we calculated the Euclidean center of the ILF by deriving the mean coordinate of its constituent fibers within coronal planes at various nodes along its extent, as well as the spread (standard deviation). 95% of the ILF’s fibers lie within 2 standard deviations (STD) of its center. However, all mFus- and CoS-fibers are more than 2 STDs away from the ILF (Figure 4B). In fact, a majority of mFus-fibers (65.5% ± 14.8%) and CoS-fibers (81.5% ± 11.5%) are more than 3 STDs from the ILF center (Figure 4B). Second, we calculated the percent of FDWM fibers overlapping with voxels that also include ILF fibers. In their posterior third, only 35.1% ± 12.8% of mFus-fibers and 28.2% ± 16.5% of CoS-fibers share voxels with the ILF. In their anterior third, the overlap increases, with 46.2% ± 15.3% of mFus-fibers and 39.5% ± 17.1% of CoS-fibers sharing voxels with the ILF. Together, these analyses reveal that FDWM tracts associated with face- and place-selective regions in VTC are consistent with a local segregation model of connectivity within VTC (Figure 1B, bottom): they are segregated from one another and from the ILF near category-selective regions, partially converge in the anterior temporal lobe, and are largely ventral to the ILF.
Figure 4. Arrangement of mFus-fibers and CoS-fibers relative to the ILF.
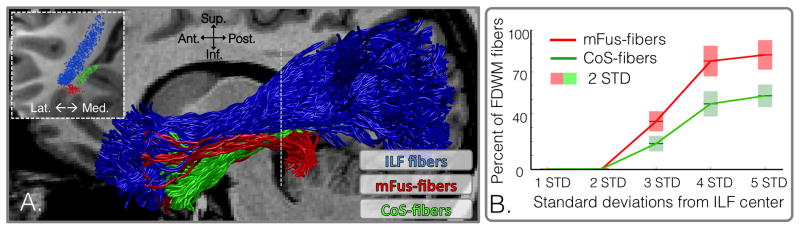
(A) A typical right ILF (blue) from an example subject alongside the tracts of mFus- (red) and CoS- (green) fibers. (B) The percentage of mFus- and CoS-fibers encountered as a function of distance from the Euclidean center of the ILF. 95% of ILF fibers are within 2 standard deviations (STD) of its center and 99.7% of the fibers are 3 STD from the center. Shaded areas indicate 2 STDs across subjects.
Local FDWM exhibits a category-specific relationship with behavior
Using DWI, we next sought to test the hypothesis that properties of white matter tracts associated with category-selective regions relate to category-specific behavior. We examined this relationship at two spatial scales – white matter local to fROIs (within 10mm) and the scale of entire mFus- and CoS-fibers tracts. Our data reveal a clear relationship between category-specific performance in typical adults and properties of FDWM local to category-selective fROIs (Figure 5).
Figure 5. Correlations between the fractional anisotropy (FA) of local FDWM voxels and performance in face- and place-processing tasks in typical adults.

Each point represents a subject’s performance on a behavioral task vs. mean FA of local FDWM (within 10mm) centered above a fROI. Red dots: FDWM local to mFus-faces/FFA-2 in the right hemisphere; Green dots: FDWM local to CoS-places/PPA in the left hemisphere. Group 1 subjects are shown in lighter colors, and Group 2 subjects are shown in darker colors. Correlation results combining both groups are reported in black, and results within each group are shown in their respective group colors. Dashed lines: the line-of-best-fit for each FDWM-behavior correlation using all subjects. Thick dashed lines: statistically significant correlations.
First, accuracy on the Benton was positively correlated with FA of FDWM local to mFus-faces in the right hemisphere (r(9) = 0.64, p = 0.06, Figure 5, top-left, red). Because we tested a small number of subjects, we obtained an additional group of subjects to validate these findings. As with the original subjects, in each of the subjects of this new group, we successfully extracted the mFus-faces and CoS-places FDWM tracts (Figure S1). Notably, we found a significantly positive correlation between accuracy on the Benton and FA local to right mFus-faces in the second subject group (r(8) =0.75, p < 0.05; Figure 5, top-left, dark red), replicating the positive correlation in the first group. Since there were no significant between-group differences in FA values (t(15) = 0.2, p = 0.85) or Benton scores (t(15) = 0.1 p = 0.93), we combined all subjects into a single correlation analysis relating Benton accuracy and right mFus-fibers FA, resulting in a significant correlation (r(17) = 0.7, p = 0.0017, Bonferroni corrected threshold of p=0.05/16=0.00313). Further examination revealed that this correlation was driven by axial diffusivity (AD) next to mFus-faces (r(17) = 0.7, p < 0.005), but not radial diffusivity (RD, r(17) = −0.11, p = 0.3). It is also interesting to note that regression coefficients of the Benton–FA correlation extracted from one subject group predicted Benton scores based on FA measurements in the second group. Indeed, a model based on one set of measurement predicts 47% of the variance in the other group, which is comparable to the amount of variance explained by the within-group regression (49%).
Notably this structure-behavior relationship was specific. There was no significant correlation between the same FA measurements and scene recognition ability (Figure 5, top right, r(17)=.12, p>0.05). Furthermore, the Benton–FA correlation was significantly higher than the scene recognition–FA correlation (Fisher transform, p < 0.01).
We also found a significant negative correlation between place processing and FA in FDWM local to left CoS-places. This correlation was significant in each of the subject groups (Figure 5, bottom right). While there was a significant between-group difference in the average FA of the fibers local to left CoS-places (t(15) = 2.85, p = 0.01), there was also a significant between-group difference in scene recognition scores (t(15) = 2.23, p = 0.04). Thus, when combing all subjects into a single pool, the correlation between FA local to left CoS-fibers and scene recognition became more significant (r(17) = −0.75, p = 0.0004, Bonferonni corrected threshold 0.00313). Here, the correlation between place processing and FA was driven largely by RD (r(17) = 0.6, p = 0.27), compared to AD (r(17) = −0.21, p = 0.35). Examining how well this relationship can predict data in an independent set, we found that regression coefficients from one group of subjects explained 16% of the variance in the second group of subjects, which is about a third of variance (50%) explained by the within-group regression models.
In contrast, there was no significant correlation between the FA local to CoS-places and face processing (r(18) = −0.07, p = 0.79, Figure 5, bottom left). Furthermore, the correlation between FA in left CoS-fibers and scene recognition was significantly different than the correlation between the same FA and Benton scores (Fisher transform, p < 0.01). No other correlations between FA and behavior were significant; these remaining correlations are reported in Table S1.
We next examined whether or not the diffusion properties of entire tracts also predict behavior by averaging FA over the entire mFus-fibers, CoS-fibers, or ILF in each hemisphere. While the whole left CoS-fibers tract correlated with scene processing (r(17) = −0.67, p=0.003), we found no other significant correlations between behavior and white matter properties across entire FDWM tracts. In addition, properties of the ILF had no significant correlation with behavior (Table S1). These results suggest that the white matter local, and the tracts specific, to a category-selective region are better predictors of category-specific behaviors rather than the average properties of a large fasciculus. This may in turn suggest that individual differences in the input/output projections of cortical regions processing faces and places are behaviorally relevant.
Atypical FDWM-behavior relationship in DPs near face-selective cortex
Given the observation of a specific relationship between white matter and behavior, a strong test of this hypothesis would be to examine this relationship in a group of subjects with a selective perceptual deficit. Thus, we repeated these measurements in a group of developmental prosopagnosics (DPs). We examined three possible outcomes in which DPs could deviate from typical adults: (1) FDWM tracts in the VTL of DPs may be qualitatively different, i.e. absent or abnormal in their anatomy, (2) there may be quantitative differences in diffusion properties of FDWM tracts between DPs and typical adults and (3) there may be quantitative differences between DPs and typical adults in the correlation between face processing and FDWM local to face-selective regions.
We identified 8 adults with developmental prosopagnosia as assessed by the Cambridge Face Memory Test (CFMT) (Duchaine and Nakayama, 2006). DPs scored 55.6% ± 10.9% (mean ± 1 STD) on the CFMT which was significantly (t(14)=6.9, p<0.0001) lower than the scores of the typical adults (90.8% ± 9.5%; Figure S2). In every DP subject we localized category-selective mFus-faces and CoS-places fROIs in each hemisphere and defined FDWM tracts associated with mFus-faces/FFA-2 and CoS-places/PPA (as in Figure 2). The functional topology of category selective responses was the same in DPs and typical adults. Like in typical subjects, face-selective activations in DPs were located on the lateral fusiform gyrus, with a cluster overlapping the MFS, and place-selective responses were found in the CoS. In DPs, mFus-faces was significantly smaller compared to typical adults bilaterally (F(1,48) = 18.66, p < 0.0005), but there were no significant differences across groups in the size of CoS-places (F(1,48) = 3.02, p > 0.05).
We found no qualitative differences in FDWM tracts associated with face and place-selective regions between DPs and typical adults. As in typical adults, we found separate tracts organized posterior-to-anterior associated with mFus-faces and CoS-places, which converged in the anterior temporal lobe (Figure 3A). Using LiFE we found that these FDWM explained a significant amount of variance of the diffusion data in an independent dataset (Figure 3B) indicating that they are valid tracts.
We found, however, quantitative differences between DPs and typical adults in the diffusivity of mFus-fibers. Because changes in DWI sequences can affect the apparent diffusivity constants measured (AD, RD) more than their ratio (FA) we compare these metrics across DP subjects and typical adults for data that was collected on the same scanner using the same DWI sequence. For each diffusivity measure, we performed an analysis of variance (ANOVA) comparing DP and typical adults locally and across whole FDWM tracts. For any F-statistic that passed a Bonferroni-corrected threshold of 0.05/6 = 0.008, we computed a t-test to assess if properties of a tract significantly varied across DPs and typical adults. DP subjects demonstrate lower mean diffusivity (MD) values in the mFus-fibers tract locally in both hemispheres (right: t(14)=3.95, p=0.001; left: t(14)=2.5, p=0.02) and across the whole mFus-fibers tract in the right hemisphere (t(14)=3.95, p=0.007) (Figure 6). Such diffusivity differences were not visible in CoS-fibers. There were also no significant between-group differences in (i) other diffusivity measures, (ii) the volume of CoS- or mFus-fibers (F(1,59) = 0.36, p=0.55), or (iii) the volume of the ILF (ts < 1.6, ps > 0.13). Importantly, differences in diffusivity patterns cannot be attributed to differences in the SNR of DWI data, with no significant difference in the non-diffusion-weighted images of DP and typical adult datasets (t(14)=0.82, p=0.42; Figure S2).
Figure 6. White matter characteristics in typical and DP adults.

White matter properties measured by average fractional anisotropy (FA), mean diffusivity (MD), axial diffusivity (AD), and radial diffusivity (RD) are shown for FDWM local to fROIs (right columns) and averaged across entire FDWM tracts (left columns). Volume (cm3): volume of voxels occupied by a FDWM tract. Each row is a different fiber tract. Red: typical adults; Gray: DPs; Horizontal bold red line: group mean; Shaded areas: 2 standard deviations demarcation. Two-way ANOVAs with factors of group and tract comparing DP and typical adults were conducted per white matter property separately for whole tracts and local tracts. Asterisks: significant differences between typical and DP adults based on t-tests, performed if the ANOVA was significant (bolded).
Focusing on the relationship between FA and behavior, the Benton-FA correlation in DPs was significantly different from the correlation in typical adults (Fisher transform, p=0.01; Figure 7A) and showed a negative trend (r(8) = −0.5, p = 0.2). This atypical correlation between behavior and white matter was restricted to mFus-faces, as DPs demonstrated no significant differences compared to typical adults in any other correlations (Fisher transform, p > 0.05; see Table S1). To verify that this atypical structure-behavior relationship in DP is associated with deficits in face processing more generally, we examined if this differential relationship extends to another test of face processing: the CFMT. Again, we observe in typical adults a significantly positive correlation between CFMT scores and FA local to mFus-faces (r(15)=.71, p< 0.003, Figure 7B). Additionally, this correlation was significantly different than the FA-CMFT correlation in DPs (Fisher transform, p=0.04; Figure 7B), who instead exhibit a negative trend.
Figure 7. Correlations between the fractional anisotropy (FA) of local FDWM voxels and performance in face processing tasks in DPs and typical adults.

(A) Each point represents a subject’s performance on the Benton face recognition task vs. mean FA of FDWM voxels local to of right mFus-faces/FFA-2. Dashed lines: the line-of-best-fit plotted for DPs (gray) and typical adults (red). The Fisher transform indicates a significant difference among correlations in typical adults and DPs. (B) Same as (A) but for CFMT scores.
Overall, comparing DPs to typical adults revealed no qualitative differences in VTL white matter tracts associated with face or place processing, but instead revealed significant differences in the mean diffusivity and the structure-behavior relationship specifically in white-matter local to mFus-faces.
Discussion
The interplay between structure, function, and behavior
Our data suggests that properties of white matter either local or specific to a fROI, rather than properties of entire fasciculi, can have a category-specific relationship to behavior. We found that white matter properties local to mFus-faces in the right hemisphere specifically correlated with face processing ability and white matter properties of fibers interconnecting CoS-places in the left hemisphere were significantly correlated with place processing ability. These findings are in line with the observation that face-selective regions are directly involved in the perception of faces (Parvizi et al., 2012; Rangarajan et al., 2014) and place-selective regions with the perception of places (Megevand et al., 2014; Tong et al., 1998). Importantly, our findings extend this relationship into the neighboring white matter.
Notably, the correlations between FA in mFus-fibers and behavior were observed in the right hemisphere where dominance for face processing has been suggested by larger size (Allison et al., 1994; Golarai et al., 2007; Kanwisher et al., 1997; Yovel et al., 2008), higher probability of occurrence (Peelen and Downing, 2005; Weiner and Grill-Spector, 2010), and higher anatomical localization consistency of face-selective regions (Weiner et al., 2014) compared to the left. FA of left CoS-fibers was correlated with scene recognition ability both locally and across the entire CoS-fibers tract. This may imply that not only local connections to CoS-places, but also distal connections between the CoS-places and the anterior temporal lobe are important for scene recognition. Together, these results advance previous research linking white matter properties of the ILF to behavior (Tavor et al., 2013) in that they (1) substantially increase the spatial resolution of measurements linking the role of white matter in behavior by an order of magnitude, (2) specify the source of behaviorally-predictive white matter to those connections local and specific to functionally-selective cortex, and (3) suggest that white matter associated with a particular cortical region is a better predictor of behavioral abilities than properties of large fasciculi.
The physiological factors underlying the diffusivity properties of our reported fiber tracts are likely diverse (Beaulieu, 2002) and difficult to directly link to microscopic tissue properties (Jones et al., 2013). Since we found a correlation between behavior and local white matter properties that is opposite in sign between mFus-faces and CoS-places, it may be useful to consider the orientation of the white matter relative to these cortical regions and its influence on the sign of the observed correlations (Figure 8). MFus-faces lies on the crown of a gyrus (Figure 2B), where tractography close to cortex is difficult due to axons fanning sharply into the surrounding cortical walls (Jbabdi and Johansen-Berg, 2011; McNab et al., 2013). Consequently, resultant tracts may be well aligned but further from cortex, therefore containing relatively fewer axons oriented towards gyral walls (Figure 8). Here, one might hypothesize that increased local connectivity would increase FA. The situation may be reversed near CoS-places, which rests in a fundus (Figure 2B). The CoS is relatively exposed to longitudinal tracts in the temporal lobe, which travel parallel and close to cortex (Figure 8). Here, one might hypothesize that increased local connectivity into CoS-places (more diving axons) would reduce FA. In line with this hypothesis, we observed that the distance between the fROI and the center of the FDWM tract immediately superior to it was significantly greater in mFus-fibers than CoS-fibers. Given that in typical adults, the correlation between face processing and FA was due to the local AD, our data suggest the possibility that properties of axons that are aligned with mFus-fibers (such as axon quantity or myelination) may be relevant to face processing. However, in CoS-fibers, the correlation between behavior and FA was negative, and largely driven by RD, suggesting the possibility that properties of axons perpendicular to CoS-fibers, or those oriented towards cortex, may be relevant for place processing. Future experiments using higher resolution DWI (McNab et al., 2013) or postmortem brains (Axer et al., 2011) can elucidate the direction of fibers diving into cortex relative to the dominant diffusion direction in a voxel and test these hypotheses.
Figure 8. Local axonal environment and its relationship to tractography and FA.

Upper left: A coronal section of the VTC. Upper right: A sagittal section taken at the fundus of the collateral sulcus. Red: Face selective cortex on the lateral fusiform gyrus; Green: place selective cortex on the collateral sulcus (CoS). Bottom left: an enlarged view of the dotted rectangle from the coronal section. Voxels within a gyrus will contain axons in multiple directions, lowering FA and making tractography near the cortical surface difficult. Increases in local connectivity to the crown of the gyrus will likely result in higher FA. Bottom right: enlarged view of the dotted rectangle from the sagittal slice. The fundus of the collateral sulcus is exposed to longitudinal running axons. Because these tracts are closer to cortex, increased local connectivity to cortex would lower FA.
Atypical development of the structure-function relationship and behavioral deficits
Supporting the idea that visual behavior relies on both the processing in a functional region and its connectivity were the striking differences in FDWM properties of subjects with face processing deficits. While DP subjects had the same large-scale organization of white matter tracts in the VTL as typical subjects (Figure 3), DPs presented with atypical white matter properties in tracts associated with face selective cortex. DPs showed restricted diffusion (lower MD) near face-selective cortex, and the FA values local to right mFus-faces showed a significantly different relationship to behavior than typical adults. This is consistent with previous research suggesting a difference in VTL white matter properties in DP subjects relative to controls (Thomas et al., 2008). Finding an atypical relationship between FA and face processing local to mFus-faces in DP is important for two reasons. First, it demonstrates that a face-selective processing deficit is associated with atypical diffusion patterns specific to the face processing network. Second, it provides a developmental homologue to neuropsychological findings suggesting higher rates of acquired prosopagnosia resulting from insult to occipitotemporal gray and white matter in the right hemisphere (Barton, 2008). In other words, our findings of a differential white matter environment around mFus-faces between typical and DP adults might suggest a maldevelopment of structure-function relationships. Future research using larger sample sizes of DP subjects will be important for explicating the atypical trend we observe between white matter and face processing in DP. It is also interesting to consider if the atypical white matter properties in DPs may affect functional or anatomical properties such as their thinner gray matter in the anterior fusiform gyrus compared to controls (Behrmann et al., 2007). Future studies combining novel quantitative MRI scans (Mezer et al., 2013), with DWI and fMRI will allow investigating the interplay between connectivity, cortical characteristics, and functional properties.
Parallel processing streams in human ventral temporal cortex
We found evidence for two parallel tracts in the VTL, each specifically associated with face or place processing. Notably, we not only identified these tracts, but we validated their existence on an independent dataset using LiFE (Pestilli et al., 2014) (Figure 3B). These tracts are consistent with a local segregation model of connectivity in VTL (Figure 1B): they are inferior to the ILF, are spatially segregated near face and place-selective regions of VTC, and partially converge in the anterior temporal lobe. While mFus-fibers and CoS-fibers are likely not the only tracts associated with mFus-faces and CoS-places, respectively, our observation of specific tracts associated with face- and place-selective cortex is consistent with prior results showing unique connectivity fingerprints for these regions (Saygin et al., 2012). The present study extends our understanding of this fingerprint by directly specifying the arrangement of connective tissue within the VTL. The existence of longitudinal mFus-fibers and CoS-fibers arranged lateral-medially and consistently with respect to the MFS (Figure 3C) mirrors the lateral-medial functional and cytoarchitectonic gradient in VTC, where the dividing boundary of these gradients aligns with the MFS (Nasr et al., 2011; Weiner et al., 2014). This suggests, in turn, that the interplay between neural hardware, connectivity, and function may determine brain networks (Tallinen et al., 2014; Van Essen et al., 1992; Witthoft et al., 2013; Zeki and Shipp, 1988).
Measurements in macaque inferior temporal cortex suggest the existence of parallel processing streams that are defined based on cortical function and white matter connectivity (Kornblith et al., 2013; Kravitz et al., 2013; Moeller et al., 2008) some of which form interconnected category-specific networks (Kornblith et al., 2013; Moeller et al., 2008). Our finding that distinct white matter tracts are associated with face- and place-selective cortex offer evidence that human VTL is similarly organized into multiple parallel processing streams at the level of anatomical connectivity. It would be interesting to determine in future studies if the lateral-medial arrangement of mFus-fibers and CoS-fibers tracts in humans is related to the lateral-medial topology of the dorsolateral-inferior and ventromedial-inferior tracts identified in macaque temporal lobe with axonal tracing (Kravitz et al., 2013).
The fact that mFus-fibers and CoS-fibers are initially segregated in posterior portions and then partially overlapping in anterior regions (Figure 1B, Figure 3A) has implications for information segregation and integration within the temporal lobe (Kravitz et al., 2013; Van Essen et al., 1992; Zeki and Shipp, 1988). Spatial separation, or divergence, provides a physical mechanism by which to parallelize the processing of independent information. In contrast, overlapping connections provide a mechanism to integrate information. We note that in the anterior temporal lobe some mFus- and CoS-fibers remain spatially separated, while others converge (Figure 3A). The former tracts are consistent with reports revealing unique connections within the face processing network between regions in the fusiform gyrus and anterior temporal lobe (Moeller et al., 2008; Pyles et al., 2013). Thus, the tracts that remain spatially segregated in anterior temporal (AT) may convey network specific information, whereas the mFus- and Cos-fibers that overlap in AT may allow integration of face and place information. These hypotheses can be tested in future research combining whole brain functional and diffusion measurements.
In sum, human ventral visual cortex relies on a network of functionally selective and intricately wired regions to produce relevant computations and functions. Our findings reveal that the functional organization of VTC is intimately coupled with patterns of white matter connectivity. Moreover, our data indicate that this relationship supports specific visual abilities, such as face and place processing. Thus, focal disruption of the relationship between white matter and functional cortex in development may result in selective visual deficits such as developmental prosopagnosia. Future neuroimaging seeking to relate connectivity of the brain to behavior should focus on white matter defined by local cortical functions, as the present findings indicate that such fine-scale connectivity is behaviorally relevant in both health and deficit.
Experimental Procedures
Participants
18 typical adults ages 18–40 years (8 females, mean age 26.4±7.1), and 8 adults ages 24–53 years (2 females, mean age 34±10) with developmental prosopagnosia (DP) participated in this study. These adults were included as DP if they scored lower than 2 standard deviations on the Cambridge Face Memory Test (Duchaine et al., 2007) compared to a control group of typical adult subjects matched in age (t(1,15) = 1.89, p > 0.05) and education (Figure S2). Subjects had normal or corrected-to-normal vision and were screened to have no prior or current neurological or psychiatric conditions. Subjects provided written informed consent prior to the experiment, and all procedures were approved to be in accordance with the Institutional Review Board of Stanford University.
Behavioral Testing
Subjects underwent behavioral testing outside the scanner by completing the Benton Facial Recognition Test (Benton et al., 1983), an old/new scene recognition memory test (Golarai et al., 2010), and the Cambridge Face Recognition Test (Duchaine and Nakayama, 2006). Details can be found in the Supplemental Experimental Procedures.
MRI
9 typical adults and 7 DPs were scanned on a 3-Tesla GE Signa MRI scanner at the Lucas Imaging Center, Stanford University. Another group of 9 typical adults and one DP were scanned on a 3-Tesla GE scanner at the CNI, Stanford University. Whole brain anatomicals were acquired using a head coil using a 3D Fast SPGR scan (166 sagittal slices, resolution: 0.938mm × 0.983mm × 1.5mm). Data were resampled to 1mm isotropic voxels and aligned to the AC-PC plane. Functional MRI was obtained with a 16 channel surface coil using a T2*-sensitive gradient echo spiral pulse sequence (Glover & Law, 2001) with a TR=2000 ms, TE=30ms, flip angle=76°, FOV=200mm, resolution: 3.125mm × 3.125mm × 3mm. We also collected inplane T1-weighted anatomicals at the same prescription as the functionals to align the data to the whole brain volume.
Localizer experiment: is identical to that used in our previous publication (Golarai et al., 2010). Data analysis and functional regions of interest were defined as in our prior studies (Weiner et al., 2014; Weiner and Grill-Spector, 2010), see Supplemental Experimental Procedures for details.
Diffusion-weighted imaging (DWI)
9 typical adults and 7 DP participants were scanned on a 3-Tesla GE Signa MRI scanner at the Lucas Imaging Center, Stanford University. We acquired two whole brain diffusion-weighted, single-shot echo-planar imaging sequence (60 slices, TE=80ms, TR=6500ms, 30 diffusion directions, b0=900s/mm2, voxel size=2×2×2mm). Each scan contained ten non-diffusion-weighted images equally distributed between diffusion-weighted images. To test the robustness of results, another group of 9 typical adult and one DP participants were scanned on a 3-Tesla GE scanner at the CNI, Stanford University. We acquired two whole brain diffusion-weighted, dual-spin echo sequences (60 slices, TE = 96.8ms, TR=8000ms, 96 diffusion directions, b0=2000s/mm2, voxel size = 2×2×2mm). Ten non-diffusion-weighted images were collected at the beginning of each scan. We note that changing the diffusion parameters across subject groups may affect MD, RD or AD values, but not FA, which should stay stable. In our data there were no significant differences across groups in FA values in the mFus-fibers or ILF.
Data analysis: was done using mrDiffusion (http://white/stanford.edu/software/). Non-diffusion-weighted images were averaged, and diffusion-weighted (DW) images were registered to this mean image using a two-stage model with a coarse-to-fine approach that maximized mutual information. DWI were motion and eddy-current corrected and aligned to each subject’s whole brain anatomy using SPM5 (fil.ion.ucl.ac.uk/spm). Tensors were fit to each voxel using a least-squares algorithm that removes outliers (Chang et al., 2005). From the tensor we calculated fractional anisotropy (FA), axial diffusivity (AD), and radial diffusivity (RD) (Basser and Pierpaoli, 1996).
Tractography
We performed whole-brain white matter tractography in one DWI dataset applying a constrained spherical deconvolution (CSD) model of diffusion (Tournier et al., 2007), using a probabilistic tractography algorithm implemented in the MRtrix software package (Tournier et al., 2012). Tracking used 300,000 seed points and a maximum harmonic envelope value of 6 to model for multiple crossing fibers.
Selection and validation of white matter connectomes
Linear Fascicle Evaluation (LiFE) (Pestilli et al., 2014), http://github.com/francopestilli/life (version 0.1), was used to validate the whole-brain tractography model. After deriving a whole-brain candidate connectome from one diffusion data set we used LiFE to build a model of the measured diffusion MRI signal given this candidate connectome. This was performed by evaluating the Stejskal-Tanner equation (Stejskal and Tanner, 1965) along the path of each individual fascicle. We employed a least squares method to fit the LiFE model to find the contribution (weight) of each fascicle in predicting the diffusion data. False alarm fascicles, those making no contribution to the diffusion signal (zero weight), are eliminated. This procedure produces an optimized connectome with the smallest number of fascicles that best explain the diffusion data.
The Virtual Lesion Method: Validating mFus- and CoS-fibers
After generating the LiFE-optimized connectome, we identified the mFus- and CoS-fibers in the optimized connectome. Then for each hemisphere and tract (mFus and CoS) we created two connectomes reduced to the path-neighborhood (namely, all voxels through which the tract traverses). One connectome included the tract of interest and the other excluded it—the lesioned connectome. We then computed the RMSE between the predicted and measured diffusion signals in the second dataset for the lesioned and unlesioned connectomes. Finally, we subtracted the RMSE of the unlesioned from the lesioned connectome (Figure 3B).
Functionally Defined White Matter (FDWM)
To extract white matter tracts associated with fROIs, we generated in each subject constant-sized spheres of 6mm radius at the center coordinate of their face- and place-fROIs. We used spheres to (1) extend fROIs to white matter to generate a seed region for tracking and (2) generate constant-sized regions to measure white matter properties across subjects, as the size of fROIs varies across subjects. We extracted pathways from the LiFE-corrected connectome that intersected or passed within 1mm of one fROI sphere, but not the other. To identify white matter tracts specific to the VTL, we further restricted the fibers to those who passed through an anatomically-defined plane in the anterior temporal lobe, located at the coronal slice where the frontal and temporal lobes separate. This plane is commonly used to localize fibers that have at least one terminal unique to the temporal lobe (Catani et al., 2003; Wakana et al., 2004; Yeatman et al., 2012b). Local FDWM was defined as the 10mm segment of a FDWM tract centered above its defining fROI.
Defining the ILF: we used an open-source automated fasciculus extraction method (AFQ, https://github.com/jyeatman/AFQ) (Yeatman et al., 2012b) to define the ILF. ILF was defined as the white matter tracts that intersected with two planes: one plane encompassing one hemisphere of the occipital lobe on a coronal slice posterior to the splenium of the corpus callosum, and the second plane is the anterior temporal plane described above.
Relating mFus- and CoS-fibers to the ILF (Figure 4)
In order to relate our FDWM tracts to the ILF, we first determined the ILF center using AFQ. The center is calculated as the mean of the volume (x,y,z) coordinates of all ILF fibers at each node. The spread of fibers is calculated by computing the covariance among the tracts’ fibers coordinates at each node. Fibers that are more than 4 standard deviations away from the core are not considered to be part of the tract (Yeatman et al., 2012b). We then calculated the Euclidean distance of our FDWM fibers as a function of the standard deviation of the ILF’s fibers.
Supplementary Material
Figure S1: Functionally-defined white matter tracts mFus-fibers (red) and CoS-fibers (green) for the 9 additional typical adults scanned with an updated diffusion-weighted sequence, related to Figure 3. The left half are FDWM tracts in each subject’s left hemisphere, the right half show the right hemisphere tracts. All tracts were successfully extracted in each hemisphere except for one subject whose especially deep and thin fusiform gyrus did not enable white matter voxels to be distinguished from cortex within 6mm of the center of the mFus-faces fROI in the right hemisphere.
Figure S2: Behavior and signal-to-noise ratio (SNR) of typical adults and DP subjects, related to Figure 6. Scores of DP subjects (gray bars) are compared to those of typical adults (red bars), with the mean of the typical adults shown in a solid black line. Dotted black lines indicate the 2 standard deviation (STD) cut-off determined from the typical adults. In the Cambridge face memory task (CFMT), all DP scores were 2 STDs lower from the typical adults’ mean and this difference is statistically significant (t(14)=6.9, p<0.0001). For comparison purposes, the red dotted line indicates the original cut-off point from Duchaine & Nakayama 2006b used to diagnose 6 adults with DP from a control population of 50 typical adults. Notably, many of our DP subjects fall below this original cut-off as well. Similarly for performance on the Benton test, many of the DP subjects were 2 STDs below the typical adult mean, and as a group scored significantly lower than typical adults (t(14)=5.52, p<0.0001). Many of the DPs, however, were above the Benton’s cut-off definition for “severely impaired” face recognition, indicated here by the red dotted line. Duchaine & Nakayama 2006b discuss the general ability of DP adults to pass the Benton test, which is why we used the CFMT to diagnose subjects with DP, and used the Benton as a test of general face-processing ability. For scene recognition, all DP subjects were well above the 2 STD cut-off, with no significant difference between groups (t(14)=1.5, p=0.16). DP subjects were also impaired on a standard test of identifying famous faces (t(11) = 3.81, p = 0.003), but were similar to controls in identifying famous places (t(11) = 0.02, p =0.98). Lastly, there was no significant difference in the SNR of the non-diffusion-weighted images across subject groups (t(14)=0.82, p=0.42).
Table S1: Correlations between FA values of FDWM and behavioral scores, related to Figures 5 and 7. Local WM correlations: correlation between average FA in FDWM voxels located within a 10mm expanse centered on the fROI sphere defining either mFus-fibers or CoS-fibers and %-correct scores on the Benton Facial Recognition Test, or an Old/New Scene Recognition test, respectively. Whole Bundle correlations: correlation between FA was averaged over the entire FDWM tract and the same behavioral scores. This analysis was done for the entire mFus-fibers, CoS-fibers, and the inferior longitudinal fasciculus (ILF). Significant correlations (passing a Bonferroni-corrected threshold of .05/16 = 0.003125) are bolded. Correlations were done separately across all 18 typical adults, and all 8 DP adults.
This movie illustrates that mFus-fibers (red) and CoS-fibers (green) have a lateral-medial relationship, and are largely ventral to the inferior longitudinal fasciculus. While primarily parallel in nature, mFus-fibers and CoS-fibers are especially divergent in their posterior extents to one another and to the ILF. All pathways tended to converge in the anterior temporal lobe.
Acknowledgments
Thanks to Jason Yeatman for his enlightening discussions on this project, and to the Vision and Perception Neuroscience Lab for their feedback comments. This research was funded by NSF GRFP grant DGE-114747 to JG and NIH 1 RO1 EY 02231801A1 grant to KGS.
Footnotes
Publisher's Disclaimer: This is a PDF file of an unedited manuscript that has been accepted for publication. As a service to our customers we are providing this early version of the manuscript. The manuscript will undergo copyediting, typesetting, and review of the resulting proof before it is published in its final citable form. Please note that during the production process errors may be discovered which could affect the content, and all legal disclaimers that apply to the journal pertain.
References
- Aguirre GK, Zarahn E, D’Esposito M. An area within human ventral cortex sensitive to “building” stimuli: evidence and implications. Neuron. 1998;21:373–383. doi: 10.1016/s0896-6273(00)80546-2. [DOI] [PubMed] [Google Scholar]
- Allison T, Ginter H, McCarthy G, Nobre AC, Puce A, Luby M, Spencer DD. Face recognition in human extrastriate cortex. Journal of neurophysiology. 1994;71:821–825. doi: 10.1152/jn.1994.71.2.821. [DOI] [PubMed] [Google Scholar]
- Axer M, Grassel D, Kleiner M, Dammers J, Dickscheid T, Reckfort J, Hutz T, Eiben B, Pietrzyk U, Zilles K, Amunts K. High-resolution fiber tract reconstruction in the human brain by means of three-dimensional polarized light imaging. Frontiers in neuroinformatics. 2011;5:34. doi: 10.3389/fninf.2011.00034. [DOI] [PMC free article] [PubMed] [Google Scholar]
- Barton JJ. Structure and function in acquired prosopagnosia: lessons from a series of 10 patients with brain damage. Journal of neuropsychology. 2008;2:197–225. doi: 10.1348/174866407x214172. [DOI] [PubMed] [Google Scholar]
- Basser PJ, Pierpaoli C. Microstructural and physiological features of tissues elucidated by quantitative-diffusion-tensor MRI. Journal of magnetic resonance Series B. 1996;111:209–219. doi: 10.1006/jmrb.1996.0086. [DOI] [PubMed] [Google Scholar]
- Beaulieu C. The basis of anisotropic water diffusion in the nervous system - a technical review. NMR in biomedicine. 2002;15:435–455. doi: 10.1002/nbm.782. [DOI] [PubMed] [Google Scholar]
- Behrmann MAG, Thomas C, Nishimura M. Impairments in face perception. Oxford University Press; 2011. [Google Scholar]
- Benton A, Sivan A, Hamsher K, Varney N, Spreen O. Contributions to Neuropsychological Assessment: A Clinical Manual. Oxford University Press; 1983. [Google Scholar]
- Catani M, Jones DK, Donato R, Ffytche DH. Occipito-temporal connections in the human brain. Brain : a journal of neurology. 2003;126:2093–2107. doi: 10.1093/brain/awg203. [DOI] [PubMed] [Google Scholar]
- Chang LC, Jones DK, Pierpaoli C. RESTORE: robust estimation of tensors by outlier rejection. Magnetic resonance in medicine. 2005;53:1088–1095. doi: 10.1002/mrm.20426. [DOI] [PubMed] [Google Scholar]
- De Pisapia N, Serra M, Rigo P, Jager J, Papinutto N, Esposito G, Venuti P, Bornstein M. Interpersonal Comptenece in Young Adulthood and Right Laterality in White Matter. Journal of cognitive neuroscience. 2013 doi: 10.1162/jocn_a_00534. [DOI] [PMC free article] [PubMed] [Google Scholar]
- Dohn A, Garza-Villarreal EA, Chakravarty MM, Hansen M, Lerch JP, Vuust P. Gray- and White-Matter Anatomy of Absolute Pitch Possessors. Cerebral cortex. 2013 doi: 10.1093/cercor/bht334. [DOI] [PubMed] [Google Scholar]
- Duchaine B. Developmental prosopagnosia: cognitive, neural, and developmental investigations. Oxford University Press; 2011. [Google Scholar]
- Duchaine B, Nakayama K. The Cambridge Face Memory Test: results for neurologically intact individuals and an investigation of its validity using inverted face stimuli and prosopagnosic participants. Neuropsychologia. 2006;44:576–585. doi: 10.1016/j.neuropsychologia.2005.07.001. [DOI] [PubMed] [Google Scholar]
- Epstein R, Kanwisher N. A cortical representation of the local visual environment. Nature. 1998;392:598–601. doi: 10.1038/33402. [DOI] [PubMed] [Google Scholar]
- Golarai G, Ghahremani DG, Whitfield-Gabrieli S, Reiss A, Eberhardt JL, Gabrieli JD, Grill-Spector K. Differential development of high-level visual cortex correlates with category-specific recognition memory. Nature neuroscience. 2007;10:512–522. doi: 10.1038/nn1865. [DOI] [PMC free article] [PubMed] [Google Scholar]
- Golarai G, Liberman A, Yoon JM, Grill-Spector K. Differential development of the ventral visual cortex extends through adolescence. Frontiers in human neuroscience. 2010;3:80. doi: 10.3389/neuro.09.080.2009. [DOI] [PMC free article] [PubMed] [Google Scholar]
- Grill-Spector K, Knouf N, Kanwisher N. The fusiform face area subserves face perception, not generic within-category identification. Nature neuroscience. 2004;7:555–562. doi: 10.1038/nn1224. [DOI] [PubMed] [Google Scholar]
- Gschwind M, Pourtois G, Schwartz S, Van De Ville D, Vuilleumier P. White-matter connectivity between face-responsive regions in the human brain. Cerebral cortex. 2012;22:1564–1576. doi: 10.1093/cercor/bhr226. [DOI] [PubMed] [Google Scholar]
- Haskins AL, Yonelinas AP, Quamme JR, Ranganath C. Perirhinal cortex supports encoding and familiarity-based recognition of novel associations. Neuron. 2008;59:554–560. doi: 10.1016/j.neuron.2008.07.035. [DOI] [PubMed] [Google Scholar]
- Jbabdi S, Johansen-Berg H. Tractography: where do we go from here? Brain connectivity. 2011;1:169–183. doi: 10.1089/brain.2011.0033. [DOI] [PMC free article] [PubMed] [Google Scholar]
- Jones DK. Studying connections in the living human brain with diffusion MRI. Cortex; a journal devoted to the study of the nervous system and behavior. 2008;44:936–952. doi: 10.1016/j.cortex.2008.05.002. [DOI] [PubMed] [Google Scholar]
- Jones DK, Knosche TR, Turner R. White matter integrity, fiber count, and other fallacies: the do’s and don’ts of diffusion MRI. NeuroImage. 2013;73:239–254. doi: 10.1016/j.neuroimage.2012.06.081. [DOI] [PubMed] [Google Scholar]
- Kanwisher N, McDermott J, Chun MM. The fusiform face area: a module in human extrastriate cortex specialized for face perception. The Journal of neuroscience. 1997;17:4302–4311. doi: 10.1523/JNEUROSCI.17-11-04302.1997. [DOI] [PMC free article] [PubMed] [Google Scholar]
- Kornblith S, Cheng X, Ohayon S, Tsao DY. A network for scene processing in the macaque temporal lobe. Neuron. 2013;79:766–781. doi: 10.1016/j.neuron.2013.06.015. [DOI] [PMC free article] [PubMed] [Google Scholar]
- Kravitz DJ, Saleem KS, Baker CI, Ungerleider LG, Mishkin M. The ventral visual pathway: an expanded neural framework for the processing of object quality. Trends in cognitive sciences. 2013;17:26–49. doi: 10.1016/j.tics.2012.10.011. [DOI] [PMC free article] [PubMed] [Google Scholar]
- McConachie HR. Developmental prosopagnosia. A single case report. Cortex; a journal devoted to the study of the nervous system and behavior. 1976;12:76–82. doi: 10.1016/s0010-9452(76)80033-0. [DOI] [PubMed] [Google Scholar]
- McNab JA, Polimeni JR, Wang R, Augustinack JC, Fujimoto K, Stevens A, Triantafyllou C, Janssens T, Farivar R, Folkerth RD, et al. Surface based analysis of diffusion orientation for identifying architectonic domains in the in vivo human cortex. NeuroImage. 2013;69:87–100. doi: 10.1016/j.neuroimage.2012.11.065. [DOI] [PMC free article] [PubMed] [Google Scholar]
- Megevand P, Groppe DM, Goldfinger MS, Hwang ST, Kingsley PB, Davidesco I, Mehta AD. Seeing scenes: topographic visual hallucinations evoked by direct electrical stimulation of the parahippocampal place area. The Journal of neuroscience. 2014;34:5399–5405. doi: 10.1523/JNEUROSCI.5202-13.2014. [DOI] [PMC free article] [PubMed] [Google Scholar]
- Mezer A, Yeatman JD, Stikov N, Kay KN, Cho NJ, Dougherty RF, Perry ML, Parvizi J, Hua le H, Butts-Pauly K, Wandell BA. Quantifying the local tissue volume and composition in individual brains with magnetic resonance imaging. Nature medicine. 2013;19:1667–1672. doi: 10.1038/nm.3390. [DOI] [PMC free article] [PubMed] [Google Scholar]
- Moeller S, Freiwald WA, Tsao DY. Patches with links: a unified system for processing faces in the macaque temporal lobe. Science. 2008;320:1355–1359. doi: 10.1126/science.1157436. [DOI] [PMC free article] [PubMed] [Google Scholar]
- Moutoussis K, Zeki S. The relationship between cortical activation and perception investigated with invisible stimuli. Proceedings of the National Academy of Sciences of the United States of America. 2002;99:9527–9532. doi: 10.1073/pnas.142305699. [DOI] [PMC free article] [PubMed] [Google Scholar]
- Nasr S, Liu N, Devaney KJ, Yue X, Rajimehr R, Ungerleider LG, Tootell RB. Scene-selective cortical regions in human and nonhuman primates. The Journal of neuroscience. 2011;31:13771–13785. doi: 10.1523/JNEUROSCI.2792-11.2011. [DOI] [PMC free article] [PubMed] [Google Scholar]
- Parvizi J, Jacques C, Foster BL, Witthoft N, Rangarajan V, Weiner KS, Grill-Spector K. Electrical stimulation of human fusiform face-selective regions distorts face perception. The Journal of neuroscience. 2012;32:14915–14920. doi: 10.1523/JNEUROSCI.2609-12.2012. [DOI] [PMC free article] [PubMed] [Google Scholar]
- Peelen MV, Downing PE. Within-subject reproducibility of category-specific visual activation with functional MRI. Human brain mapping. 2005;25:402–408. doi: 10.1002/hbm.20116. [DOI] [PMC free article] [PubMed] [Google Scholar]
- Pestilli F, Yeatman J, Rokem A, Kay KN, Wandell B. Evaluation and statistical inference for living connectomes. Nature Methods. 2014 doi: 10.1038/nmeth.3098. [DOI] [PMC free article] [PubMed] [Google Scholar]
- Pyles JA, Verstynen TD, Schneider W, Tarr MJ. Explicating the face perception network with white matter connectivity. PloS one. 2013;8:e61611. doi: 10.1371/journal.pone.0061611. [DOI] [PMC free article] [PubMed] [Google Scholar]
- Rangarajan V, Hermes D, Foster BL, Weiner KS, Jacques C, Grill-Spector K, Parvizi J. Electrical stimulation of the left and right human fusiform gyrus causes different effects in conscious face perception. Journal of Neuroscience. 2014 doi: 10.1523/JNEUROSCI.0527-14.2014. [DOI] [PMC free article] [PubMed] [Google Scholar]
- Saygin ZM, Osher DE, Koldewyn K, Reynolds G, Gabrieli JD, Saxe RR. Anatomical connectivity patterns predict face selectivity in the fusiform gyrus. Nature neuroscience. 2012;15:321–327. doi: 10.1038/nn.3001. [DOI] [PMC free article] [PubMed] [Google Scholar]
- Sporns O, Tononi G, Kotter R. The human connectome: A structural description of the human brain. PLoS computational biology. 2005;1:e42. doi: 10.1371/journal.pcbi.0010042. [DOI] [PMC free article] [PubMed] [Google Scholar]
- Stejskal E, Tanner J. Spin diffusion measurements: Spin echoes in the presence of a time dependent field gradient. The Journal of Chemical Physics. 1965;42:288–292. [Google Scholar]
- Tallinen T, Chung JY, Biggins JS, Mahadevan L. Gyrification from constrained cortical expansion. Proceedings of the National Academy of Sciences of the United States of America; 2014. [DOI] [PMC free article] [PubMed] [Google Scholar]
- Tavor I, Yablonski M, Mezer A, Rom S, Assaf Y, Yovel G. Separate parts of occipito-temporal white matter fibers are associated with recognition of faces and places. NeuroImage. 2013 doi: 10.1016/j.neuroimage.2013.07.085. [DOI] [PubMed] [Google Scholar]
- Tong F, Nakayama K, Vaughan JT, Kanwisher N. Binocular rivalry and visual awareness in human extrastriate cortex. Neuron. 1998;21:753–759. doi: 10.1016/s0896-6273(00)80592-9. [DOI] [PubMed] [Google Scholar]
- Tournier JD, Calamante F, Connelly A. Robust determination of the fibre orientation distribution in diffusion MRI: non-negativity constrained super-resolved spherical deconvolution. NeuroImage. 2007;35:1459–1472. doi: 10.1016/j.neuroimage.2007.02.016. [DOI] [PubMed] [Google Scholar]
- Tournier JD, Calamante F, Connelly A. MRtrix: diffusion tractography in crossing fibre regions. Internation Journal of Imaging Systems and Technology 2012 [Google Scholar]
- Van Essen DC, Anderson CH, Felleman DJ. Information processing in the primate visual system: an integrated systems perspective. Science. 1992;255:419–423. doi: 10.1126/science.1734518. [DOI] [PubMed] [Google Scholar]
- Wakana S, Jiang H, Nagae-Poetscher LM, van Zijl PC, Mori S. Fiber tract-based atlas of human white matter anatomy. Radiology. 2004;230:77–87. doi: 10.1148/radiol.2301021640. [DOI] [PubMed] [Google Scholar]
- Weiner KS, Golarai G, Caspers J, Chuapoco MR, Mohlberg H, Zilles K, Amunts K, Grill-Spector K. The mid-fusiform sulcus: A landmark identifying both cytoarchitectonic and functional divisions of human ventral temporal cortex. NeuroImage. 2014;84:453–465. doi: 10.1016/j.neuroimage.2013.08.068. [DOI] [PMC free article] [PubMed] [Google Scholar]
- Weiner KS, Grill-Spector K. Sparsely-distributed organization of face and limb activations in human ventral temporal cortex. NeuroImage. 2010;52:1559–1573. doi: 10.1016/j.neuroimage.2010.04.262. [DOI] [PMC free article] [PubMed] [Google Scholar]
- Witthoft N, Nguyen ML, Golarai G, Larocque KF, Liberman A, Smith ME, Grill-Spector K. Where Is Human V4? Predicting the Location of hV4 and VO1 from Cortical Folding. Cerebral cortex. 2013 doi: 10.1093/cercor/bht092. [DOI] [PMC free article] [PubMed] [Google Scholar]
- Yeatman J, Dougherty R, Ben-Shachar M, Wandell B. Development of white matter and reading skills. Proceedings of the National Academy of Sciences of the United States of America. 2012a;109:E3045–3053. doi: 10.1073/pnas.1206792109. [DOI] [PMC free article] [PubMed] [Google Scholar]
- Yeatman J, Dougherty R, Myall N, Wandell B, Feldman H. Tract profiles of white matter properties: automating fiber-tract quantification. PloS one. 2012b;7:e49790. doi: 10.1371/journal.pone.0049790. [DOI] [PMC free article] [PubMed] [Google Scholar]
- Yovel G, Tambini A, Brandman T. The asymmetry of the fusiform face area is a stable individual characteristic that underlies the left-visual-field superiority for faces. Neuropsychologia. 2008;46:3061–3068. doi: 10.1016/j.neuropsychologia.2008.06.017. [DOI] [PubMed] [Google Scholar]
- Zeki S, Shipp S. The functional logic of cortical connections. Nature. 1988;335:311–317. doi: 10.1038/335311a0. [DOI] [PubMed] [Google Scholar]
Associated Data
This section collects any data citations, data availability statements, or supplementary materials included in this article.
Supplementary Materials
Figure S1: Functionally-defined white matter tracts mFus-fibers (red) and CoS-fibers (green) for the 9 additional typical adults scanned with an updated diffusion-weighted sequence, related to Figure 3. The left half are FDWM tracts in each subject’s left hemisphere, the right half show the right hemisphere tracts. All tracts were successfully extracted in each hemisphere except for one subject whose especially deep and thin fusiform gyrus did not enable white matter voxels to be distinguished from cortex within 6mm of the center of the mFus-faces fROI in the right hemisphere.
Figure S2: Behavior and signal-to-noise ratio (SNR) of typical adults and DP subjects, related to Figure 6. Scores of DP subjects (gray bars) are compared to those of typical adults (red bars), with the mean of the typical adults shown in a solid black line. Dotted black lines indicate the 2 standard deviation (STD) cut-off determined from the typical adults. In the Cambridge face memory task (CFMT), all DP scores were 2 STDs lower from the typical adults’ mean and this difference is statistically significant (t(14)=6.9, p<0.0001). For comparison purposes, the red dotted line indicates the original cut-off point from Duchaine & Nakayama 2006b used to diagnose 6 adults with DP from a control population of 50 typical adults. Notably, many of our DP subjects fall below this original cut-off as well. Similarly for performance on the Benton test, many of the DP subjects were 2 STDs below the typical adult mean, and as a group scored significantly lower than typical adults (t(14)=5.52, p<0.0001). Many of the DPs, however, were above the Benton’s cut-off definition for “severely impaired” face recognition, indicated here by the red dotted line. Duchaine & Nakayama 2006b discuss the general ability of DP adults to pass the Benton test, which is why we used the CFMT to diagnose subjects with DP, and used the Benton as a test of general face-processing ability. For scene recognition, all DP subjects were well above the 2 STD cut-off, with no significant difference between groups (t(14)=1.5, p=0.16). DP subjects were also impaired on a standard test of identifying famous faces (t(11) = 3.81, p = 0.003), but were similar to controls in identifying famous places (t(11) = 0.02, p =0.98). Lastly, there was no significant difference in the SNR of the non-diffusion-weighted images across subject groups (t(14)=0.82, p=0.42).
Table S1: Correlations between FA values of FDWM and behavioral scores, related to Figures 5 and 7. Local WM correlations: correlation between average FA in FDWM voxels located within a 10mm expanse centered on the fROI sphere defining either mFus-fibers or CoS-fibers and %-correct scores on the Benton Facial Recognition Test, or an Old/New Scene Recognition test, respectively. Whole Bundle correlations: correlation between FA was averaged over the entire FDWM tract and the same behavioral scores. This analysis was done for the entire mFus-fibers, CoS-fibers, and the inferior longitudinal fasciculus (ILF). Significant correlations (passing a Bonferroni-corrected threshold of .05/16 = 0.003125) are bolded. Correlations were done separately across all 18 typical adults, and all 8 DP adults.
This movie illustrates that mFus-fibers (red) and CoS-fibers (green) have a lateral-medial relationship, and are largely ventral to the inferior longitudinal fasciculus. While primarily parallel in nature, mFus-fibers and CoS-fibers are especially divergent in their posterior extents to one another and to the ILF. All pathways tended to converge in the anterior temporal lobe.