

Abstract
The tumor suppressors Pten and p53 are frequently lost in breast cancer, yet the consequences of their combined inactivation are poorly understood. Here, we show that mammary-specific deletion of Pten via WAP-Cre, which targets alveolar progenitors, induced tumors with shortened latency compared to those induced by MMTV-Cre, which targets basal/luminal progenitors. Combined Pten-p53 mutations accelerated formation of claudin-low, triple-negative-like breast cancer (TNBC) that exhibited hyper-activated AKT signaling and more mesenchymal features relative to Pten or p53 single-mutant tumors. Twenty-four genes that were significantly and differentially expressed between WAP-Cre:Pten/p53 and MMTV-Cre:Pten/p53 tumors predicted poor survival for claudin-low patients. Kinome screens identified eukaryotic elongation factor-2 kinase (eEF2K) inhibitors as more potent than PI3K/AKT/mTOR inhibitors on both mouse and human Pten/p53-deficient TNBC cells. Sensitivity to eEF2K inhibition correlated with AKT pathway activity. eEF2K monotherapy suppressed growth of Pten/p53-deficient TNBC xenografts in vivo and cooperated with doxorubicin to efficiently kill tumor cells in vitro. Our results identify a prognostic signature for claudin-low patients and provide a rationale for using eEF2K inhibitors for treatment of TNBC with elevated AKT signaling.
Keywords: eEF2K, p53, prognosis, Pten, triple-negative breast cancer
See also: HG Russnes & C Caldas et al (December 2014)
Introduction
Breast cancer (BC) is a heterogeneous disease that can be classified into estrogen receptor α-positive (ERα+) and HER2+ tumors as well as triple-negative (TN) tumors, which do not express high levels of these or the progesterone receptors (Prat & Perou, 2011). TNBCs include two major subtypes: basal-like, expressing basal-cell markers such as cytokeratin 14, and claudin-low/mesenchymal-like, expressing low levels of tight junction proteins including certain claudins and E-cadherin, and high levels of genes associated with epithelial-to-mesenchymal transition (EMT) (Prat et al, 2010; Lehmann et al, 2011; Timmerman et al, 2013). Interest in the latter tumors is driven by observations that following conventional therapy, residual tumors exhibit features of cancer stem cells and EMT (Mani et al, 2008; Creighton et al, 2009; Guo et al, 2012). Moreover, TNBCs often resist therapy, and metastatic disease is virtually incurable (Carey et al, 2007; Irshad et al, 2011). While specific treatments have been developed for ERα+ BC (tamoxifen, aromatase inhibitors) and HER2+ BC (trastuzumab), the only option for most TNBC patients is cytotoxic chemotherapy such as anthracyclines (doxorubicin), which leads to significant morbidity.
In TNBC, p53 is deleted or mutated in 60–80% of cases (Holstege et al, 2010; Koboldt et al, 2012; Shah et al, 2012), whereas the Phosphatase and TENsin (Pten) homolog deleted in chromosome 10 (Li et al, 1997; Steck et al, 1997) is lost in 25–30% of cases primarily through promoter silencing or microRNA-mediated suppression (Salmena et al, 2008; Korkaya et al, 2009; Koboldt et al, 2012). The protein, Pten, regulates cell growth by converting phosphatidylinositol (3,4,5)-trisphosphate (PIP3) into phosphatidylinositol (4,5)-disphosphate (PIP2), thereby antagonizing phosphatidylinositol-3 kinase (PI3K) pathway activation (Stambolic et al, 1998; Cully et al, 2006; Adams et al, 2011). Dysregulation of the PI3K pathway induces AKT/PKB, leading to increased cell motility, proliferation and survival, as well as increased protein translation via mTOR. Pten and p53 were shown to regulate EMT and cell migration (Leslie et al, 2007; Jiang et al, 2011), and interact with each other at several levels (Stambolic et al, 2001; Kawase et al, 2009).
While p53 loss is not actionable, activation of the PI3K pathway can be targeted with PI3K pathway antagonists such as PI3K, AKT or mTOR inhibitors (Janku et al, 2012; Kim et al, 2012). However, as the PI3K pathway is subject to tight autoregulation, such inhibitors often have modest or transient effects (Gordon & Banerji, 2013). There is therefore an urgent need to identify new therapeutic targets that may be useful for treatment of Pten/p53-deficient TNBC. The effects of mutations in p53 or Pten on the mammary epithelium have been documented (Stambolic et al, 2000; Li et al, 2002; Herschkowitz et al, 2012; Knight et al, 2013). The impact of combined inactivation of these tumor suppressors, which frequently occurs in breast cancer, is poorly understood. Here, we disrupted Pten and p53 in mammary epithelium either alone or in combination and determined the effect on tumor formation, tumor-initiating cells, prognosis, PI3K/AKT pathway activation and response to therapeutic drugs. We found that Pten/p53 deficiency induces TNBCs, which are distinct from Pten or p53 single-mutant tumors with more mesenchymal features and poor clinical outcome. A non-biased screen revealed that while PI3K/AKT/mTOR inhibitors efficiently kill Pten/p53-deficient tumors, the most potent drugs target JNK, which was previously linked to Pten-deficient cancer, and eEF2K, a kinase that controls protein translation downstream of mTOR. Sensitivity to eEF2K was proportional to AKT pathway activity and was demonstrated both in vitro and in xenografts of mouse and human Pten/p53-deficient TNBC. Our results should encourage development of effective eEF2K inhibitors for treatment of TNBC with elevated AKT signaling.
Results
Combined deletion of Pten and p53 induces spindle-/mesenchymal-like mammary tumors
To model the effect of Pten loss on BC, we used a floxed allele (Ptenf) (Suzuki et al, 1998) and the deleter lines WAP-Cre (which preferentially targets pregnancy-identified alveolar progenitors) and MMTV-CreNLST (which targets basal and luminal progenitors) (Wagner et al, 2002; Jiang et al, 2010). MMTV-Cre:Ptenf/f mice developed mammary tumors after a long latency of 26.4 months with incomplete penetrance (70%) (Fig1A). WAP-Cre:Ptenf/f females developed tumors with shorter latency (15.2 months) and almost complete penetrance; by 18 months, nearly all mice had succumbed to cancer. In both cases, pregnancy accelerated tumor formation. Tumors from both models were heterogeneous, consisting primarily of adenomyoepithelioma (∼70%) or adenosquamous carcinoma (20–25%) (Fig1B and C). In addition, a small fraction of tumors was classified as acinar or poorly differentiated adenocarcinoma (4–7%), or spindle-cell/adenosarcoma (3–4%). Marker expression analysis of the dominant tumor subtypes revealed mixed expression of smooth muscle actin (SMA) and cytokeratin 5 (K5), K6, K14 (basal markers), K18 (luminal marker), vimentin, ERα, as well as nuclear co-localization of β-catenin and cyclin D2 (Supplementary Fig S1), a pattern often found in other tumor models of mixed lineages such as MMTV-WNT1 (Li et al, 2003).
Figure 1. Pten plus p53 mutations cooperate to accelerate sarcomatoid/mesenchymal-like mammary tumors.

- Kaplan–Meier mammary tumor-free curves for WAP-Cre:Ptenf/f and MMTV-Cre:Ptenf/f mice. Dashed lines represent nulliparous or multiparous females and solid line the average for all mice. Tumor latency (average) for the two models was significantly different (P = 3.47 × 10⁻¹⁷, Wilcoxon method).
- Histology of four major tumor types in WAP-Cre:Ptenf/f and MMTV-Cre:Ptenf/f mice.
- Distribution of tumor types (%) in WAP-Cre:Ptenf/f (left) and MMTV-Cre:Ptenf/f (right) mice.
- Kaplan–Meier mammary tumor-free curves for WAP-Cre:Ptenf/f:p53f/f, MMTV-Cre:p53f/f and MMTV-Cre:p53f/f versus (average) WAP-Cre:Ptenf/f and MMTV-Cre:Ptenf/f mice. Statistical significance by Wilcoxon method. p53 versus Pten, P = 0.00158; Pten/p53 versus p53, P = 0.0329; Pten/p53 versus Pten, P = 4.71 × 10⁻¹⁴.
- Detection of Pten and p53 gene deletion by PCR using primers specific for Cre-excised Ptenf/f and p53f/f alleles.
- Histology of indicated tumors and distribution (%) of tumor types.
Next, we determined the effect of concurrent loss of Pten and p53, which are frequently inactivated in TNBC. MMTV-Cre:Ptenf/f:p53f/f and WAP-Cre:Ptenf/f:p53f/f double-mutant females developed tumors with a reduced latency of 11.3 and 9.8 months, respectively, compared with 26.4, 15.2 and 16.9 months for single-mutant MMTV-Cre:Ptenf/f, WAP-Cre:Ptenf/f and MMTV-Cre:p53f/f mice (Fig1D). Deletion of the Ptenf/f and p53f/f alleles in these tumors was confirmed by PCR (Fig1E). In contrast to the heterogeneity of PtenΔf tumors and small percentage of adenosarcomas, approximately 70% of PtenΔf:p53Δf lesions were histologically classified as adeno-sacrcomatoid/spindle-cell/mesenchymal-like BC. The rest exhibited mixed mesenchymal plus adenocarcinomas or differentiated adenocarcinomas (Fig1F). In comparison, only 30% of p53Δf tumors were sarcomatoid. The Pten/p53-deficient adeno-sacrcomatoid-like tumors expressed the mesenchymal markers vimentin, SMA and desmin but not ERα (Supplementary Fig S2).
Pten/p53-deficient mouse tumors cluster with human claudin-low TNBC
To molecularly classify the Pten/p53-deficient tumors, we compared them to other mouse models and human BC subtypes using an extended intrinsic BC signature and unsupervised hierarchical clustering (Herschkowitz et al, 2007) (Supplementary Table S1A). Expression across platforms was combined and integrated using the distance weighted discrimination (DWD) algorithm (Benito et al, 2004). Three MMTV-Her2/Neu tumors were included as internal control. Cluster analysis grouped them with published MMTV-Her2/Neu tumors (Fig2A), thus validating our normalization process. Most (10/16) PtenΔf tumors clustered with “normal”-like BCs. Importantly, the majority of MMTV-Cre:Ptenf/f:p53f/f and WAP-Cre:Ptenf/f:p53f/f tumors (12/15) clustered with mouse spindle-like mammary tumors and human claudin-low BC. In contrast, only half (3/6) of MMTV-Cre:p53f/f tumors clustered with PtenΔf:p53Δf tumors/claudin-low BC.
Figure 2. Pten/p53-deficient mammary tumors cluster with claudin-low TNBC.

- Cluster analysis of Pten/p53-deficient mammary tumors using an intrinsic gene signature (Supplementary Table S1A and B) in comparison with human (solid boxes; basal, CL: claudin-low, LumA: luminal A, LumB: luminal B, HER2 and N: normal-like) and mouse (open boxes; Spnd.: spindle, M: mammary glands, Nu: MMTV-Neu, Mc: Myc-derived, V: MMTV-PyVT, In: MMTV-Int3, T: tag-derived, Wnt-Brca-p53: MMTV-Wnt1, Brca1-deficient, p53-deficient) BC samples.
- Cluster analysis of Pten/p53-deficient mammary tumors with human claudin-low (green) and basal-like (blue) BC using the Prat/Perou claudin-low signature. Mouse Pten/p53-deficient tumors clustered with human claudin-low—not with basal-like BC—on the far right. Non-claudin-low human and mouse tumors clustered together on the left.
- Expression of EMT genes in indicated mouse tumors and in human claudin-low versus basal-like BC.
- Expression of hypoxia signature genes in indicated mouse tumors and in human claudin-low versus basal-like BC.
We next used a claudin-low signature developed by Prat and Perou to classify our PtenΔf:p53Δf tumors with human BC samples (Prat et al, 2010) (Fig2B; Supplementary Table S1B). All but one PtenΔf:p53Δf tumors clustered with claudin-low BC. Accordingly, expression of claudin 3, 4 and 7 was very low in 14 of 15 MMTV-Cre:Ptenf/f:p53f/f and WAP-Cre:Ptenf/f:p53f/f tumors (Fig2C). In contrast, only 3 of 6 MMTV-Cre:p53f/f tumors expressed low levels of claudin genes. The mouse PtenΔf:p53Δf tumors and most human claudin-low BC samples, but only 1 of 6 p53Δf tumors, expressed high levels of the EMT inducers Twist1/2, Snail1/2 and Zeb1/2 (Fig2C; Supplementary Table S1C). A Basal-B/claudin-low BC cell signature (Blick et al, 2010) also resembled mouse PtenΔf:p53Δf tumors better than p53Δf tumors (Supplementary Fig S3A, Supplementary Table S1D).
TNBCs are known to be hypoxic (Tan et al, 2009). Using an hypoxic signature (Supplementary Table S1E) (Hu et al, 2009), we found that mouse PtenΔf:p53Δf tumors and human claudin-low and basal-like BCs expressed high levels of hypoxia-related genes compared with most mouse p53Δ, PtenΔf and Her2/Neu tumors (Fig2D). Finally, p53 induces several microRNAs (miRs) including miR200 that inhibit EMT by silencing expression of EMT inducers including Zeb2 (Gregory et al, 2008; Chang et al, 2011; Kim et al, 2011). In accordance, we found that expression of miR200a, miR200b, miR200c, miR429 and miR205 was significantly reduced in PtenΔf:p53Δf versus PtenΔf tumors (Supplementary Fig S3B and C, Supplementary Table S1F). In addition, PtenΔf:p53Δf tumors exhibited significantly lower levels of p63 and Dicer, which regulate and process the miR200 family (Supplementary Fig S3D) (Su et al, 2010). Thus, combined inactivation of Pten and p53 induces mammary tumors with enhanced features of EMT and close resemblance to human claudin-low BC. As noted in the Introduction, mesenchymal-like cancer cells are observed in human breast tumors and may represent the cancer stem cell subpopulation. Thus, although Pten/p53 tumors exemplify an exaggerated form of this phenotype, insights derived from these models may prove valuable to targeting this most important fraction of tumor cells.
24 differentially expressed genes in WAP-Cre:Ptenf/f:p53f/f versus MMTV-Cre:Ptenf/f:p53f/f tumors can predict clinical outcome for claudin-low BC patients
We first probed for differences between WAP-Cre:Ptenf/f:p53f/f and MMTV-Cre:Ptenf/f:p53f/f tumors. To this end, we performed Global Gene Set Enrichment Analysis (GSEA) and visualized results using “Functional Enrichment Maps” (Merico et al, 2011). This analysis revealed several pathways that are differentially induced between WAP-Cre:Ptenf/f and MMTV-Cre:Ptenf/f tumors (Supplementary Fig S4A). Remarkably, direct comparison of mRNA levels from these two groups identified only 24 genes that were significantly (FDR q-value < 0.05) and differentially (> twofold) expressed (Fig3A). Seven of these genes were up-regulated (Cda, Dio3, Trim12, Mmp1a, Birc2, Upk1b, Dync2h1) and 17 down-regulated (Top2a, Nrn1, Thbs4, Hgf, Sgcd, Akr1c18, Gmnn, Glp1r, Dio2, Cadps, Srpx, Aspn, Rock2, Qpct, Gzmc, Nsg1, Anxa1). These 24 genes marked specific pathways in the GSEA, which were down-regulated in WAP-Cre:Ptenf/f:p53f/f relative to MMTV-Cre:Ptenf/f:p53f/f tumors including EMT/mesenchymal, UV and stress response as well as RB/p53-related cellular senescence (Fig3B and Supplementary Fig S4A).
Figure 3. 24 differentially regulated genes between WAP-Cre:Ptenf/f:p53f/f and MMTV-Cre:Ptenf/f:p53f/f tumors predict clinical outcome for claudin-low BC patients.
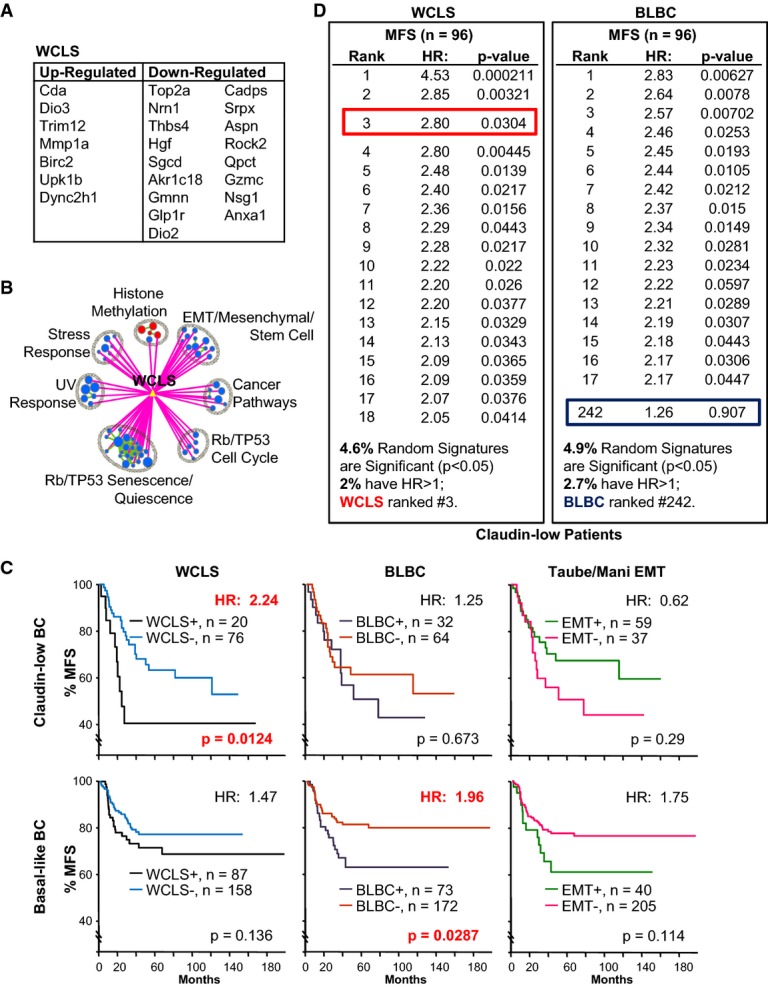
- List of 24 genes that are significantly (FDR q-value <0.05) and differentially (> twofold) regulated between WAP-Cre:Ptenf/f:p53f/f and MMTV-Cre:Ptenf/f:p53f/f tumors, including 7 up-regulated and 17 down-regulated (Supplementary Table S1G).
- Selected pathways that are significantly associated with WCLS from GSEA analysis of WAP-Cre:Ptenf/f:p53f/f (red) versus MMTV-Cre:Ptenf/f:p53f/f (blue) tumors. Green lines connect overlapping pathways. Circle size corresponds to levels of enrichment and thickness of lines to degree of overlap. The full GSEA map and association with WCLS are shown in Supplementary Fig S4A.
- Kaplan–Meier metastasis-free survival (% MFS) curve for claudin-low and basal-like BC patients with WCLS, BLBC and the Taube/Mani EMT signature.
- Comparison of WCLS and BLBC relative to 1,000 random sets of signatures, generated from atmosphere background noise (random.org), with the same gene composition (7 up-regulated, 17 down-regulated for WCLS; 9 up-regulated, 5 down-regulated for BLBC) on claudin-low BC patients. The percentage of signatures with significant HR > 1.0 is listed at the bottom. WCLS ranked 3rd for claudin-low BC, while BLBC ranked #242. For similar analysis on basal-like BC, see Supplementary Fig S4C.
We next asked whether the 24-gene set was predictive of clinical outcome using a cohort of 96 claudin-low BC patients with metastatic-free survival (MFS) data. Remarkably, this gene set, which we termed WAP-Cre Claudin-Low Signature (WCLS, Supplementary Table S1G), could stratify claudin-low patients into high and low risk groups with a hazard ratio of 2.24 (P = 0.0124; Fig3C). Comparing to a recently reported signature for Basal-Like Breast Cancer (BLBC) (Hallett et al, 2012), WCLS was specific for the claudin-low tumors, whereas BLBC was specific for basal-like BC with HR = 1.96 (P = 0.0287; Fig3C). Both signatures were not informative for HER2+, luminal A or luminal B BC (Supplementary Fig S4B).
To assess the possibility that WCLS is predictive by chance alone, we generated 1,000 random signatures with the same composition (i.e. 7 up-, 17 down-regulated genes) and analyzed their predictive power against the same patient cohort, as previously described (Liu et al, 2013). We found that 4.6% of the random signatures were significant (P < 0.05), of which 2% had HR > 1 (Fig3D). Importantly, WCLS ranked 3rd with HR of 2.8 (P = 0.03), indicating that its prognostic power is statistically significant. In contrast, BLBC ranked 242 with insignificant P-value. For basal-like BC patients, BLBC, but not WCLS, ranked high (2nd) compared to 1,000 random signatures of similar composition (Supplementary Fig S4C).
The better prognosis of WCLS-negative versus WCLS-positive patients suggests that overt activation of EMT/mesenchymal pathways may improve outcome by blocking mesenchymal-to-epithelial transition (MET), which is required for metastatic growth at distal sites (Ocana et al, 2012; Tsai et al, 2012). In this case, an EMT signature should also not be associated with worse outcome. To test this prediction, we determined whether a core EMT/mesenchymal signature developed by Taube et al (2010) could predict clinical outcome, using the same claudin-low patient cohorts. We found that claudin-low patients expressing the Taube/Mani EMT signature did not show a poorer prognosis than signature-negative patients. In fact, there was a trend, albeit not statistically significant, toward better outcome (Fig3C). Taken together, our analysis shows that despite their similarity, there is a small number of genes that is significantly and differentially expressed between WAP-Cre:Ptenf/f:p53f/f and MMTV-Cre:Ptenf/f:p53f/f tumors and that this small gene set can predict clinical outcome for claudin-low BC patients.
Unique and frequent tumor-initiating cells in Pten/p53-deficient claudin-low-like mammary tumors
To determine the impact of combined Pten/p53 loss relative to p53 deletion alone, we analyzed cancer stem cell (CSC) populations in these tumors. CSCs represent a subset of tumor cells that is capable of sustaining tumorigenesis as well as giving rise to the tumor bulk, which is derived from CSCs but has lost its tumorigenic potential through epigenetic alterations (Kreso & Dick, 2014). CSCs are functionally defined as tumor-initiating cells (TICs) through their ability to seed new tumors following transplantation into recipient mice and to grow as spheres under non-adherent conditions (Liu et al, 2007; Deng et al, 2014). In the mouse, many mammary TICs are defined on the basis of CD49f (α6 integrin) and CD24 (a luminal marker) expression (Liu et al, 2007). Interestingly, in contrast to PtenΔf, p53Δf and Her2/Neu tumor cells, which contained a prominent CD24+:CD49f+ double-positive cell fraction, most PtenΔf:p53Δf mammary tumor cells expressed low levels of the luminal marker CD24 and were CD24−:CD49f− or CD24−:CD49f+ (Fig4A and B). In accordance, PtenΔf:p53Δf tumorsphere-forming units (TFUs), capable of growing into spheres when seeded onto ultra-low attachment plates in defined, serum-free media, were found predominantly in the CD24−:CD49f− and CD24−:CD49f+ but not in the CD24+:CD49f+ double-positive fractions (Fig4B and C).
Figure 4. High frequency and unique tumor-initiating cells (TICs) in Pten/p53-deficient mic.

- Flow cytometry profiles of indicated tumors with the CD24 and CD49f cell surface markers.
- Gating conditions used to sort MMTV-Cre:Ptenf/f:p53f/f tumor cells into CD24−:CD49f−, CD24−:CD49f+ and CD24+:CD49f+ fractions. CD24−:CD49f− cells contained significantly higher tumorsphere-forming units (TFU) at a frequency of 0.23% (P < 0.00142, ANOVA with Tukey test for post hoc) compared with CD24−:CD49f+ or CD24+:CD49f+ fractions. The CD24−:CD49f+ fraction contained TFU at a frequency of 0.10% (P = 3.13 × 10⁻⁵, ANOVA with Tukey test for post hoc) relative to the CD24+:CD49f+ fraction.
- Representative images of tumorspheres from each fraction.
- TIC frequency in five MMTV-Cre:Ptenf/f:p53f/f tumors following cell sorting and orthotopic transplantation into Rag1−/− females. There were too few cells in the CD24+:CD49f− fraction for analysis. Significant differences in TIC frequencies were determined using L-Calc (Stemcell Technologies) and ANOVA. *P < 0.05; **P < 0.001.
- CD24/CD49f profiles of primary and secondary tumors from transplantation of CD24−:CD49f+ (blue) or CD24−:CD49f− (red) MMTV-Cre:Ptenf/f:p53f/f tumor cells.
- Representative mesenchymal-like histology of a primary MMTV-Cre:Ptenf/f:p53f/f tumor and secondary tumors developed following transplantation of CD24−:CD49f+ or CD24−:CD49f− cell fractions.
Sorted CD24−:CD49f− or CD24−:CD49f+ PtenΔf:p53Δf tumor cells also formed secondary tumors following orthotopic transplantation (n = 5, Fig4D). TIC frequency in these fractions was high (1/57 and 1/93, respectively) compared to 1/1,116 in the CD24+:CD49f+ fraction. The secondary tumors from these fractions recapitulated the heterogeneous flow cytometric profiles of, and were histologically indistinguishable from, the primary tumors from which they were derived (Fig4E and F). TICs in spindle-like p53Δ mammary tumors were reported to be CD24+:CD49f+ (Herschkowitz et al, 2012). Thus, Pten deficiency cooperates with p53 mutation to accelerate tumorigenesis and promote more mesenchymal, CD24-negative TICs.
Distinct signaling pathways in Pten/p53- versus p53-deficient claudin-low mammary tumors
To define transcriptional programs that distinguish PtenΔf:p53Δf from p53Δf tumors, we performed GSEA. Comparing claudin-low-like PtenΔf:p53Δf versus claudin-low-like p53Δf tumors, pathways associated with “migration/locomotion” and “cell proliferation” were up-regulated, whereas those associated with “immune response” and “cell death” were down-regulated (Fig5A, Supplementary Fig S5A, Supplementary Table S1H–M). Genes on the “lipid/phosphatidyl-inositol phosphatase” pathway were also altered. Additional comparisons of claudin-low plus non-claudin-low PtenΔf:p53Δf and p53Δf tumors, PtenΔf:p53Δf versus PtenΔf, and p53Δf versus PtenΔf tumors are shown in Supplementary Materials and Methods and Supplementary Fig S5B–D.
Figure 5. Pathway analysis of Pten/p53- versus p53-deficient claudin-low-like TNBC.
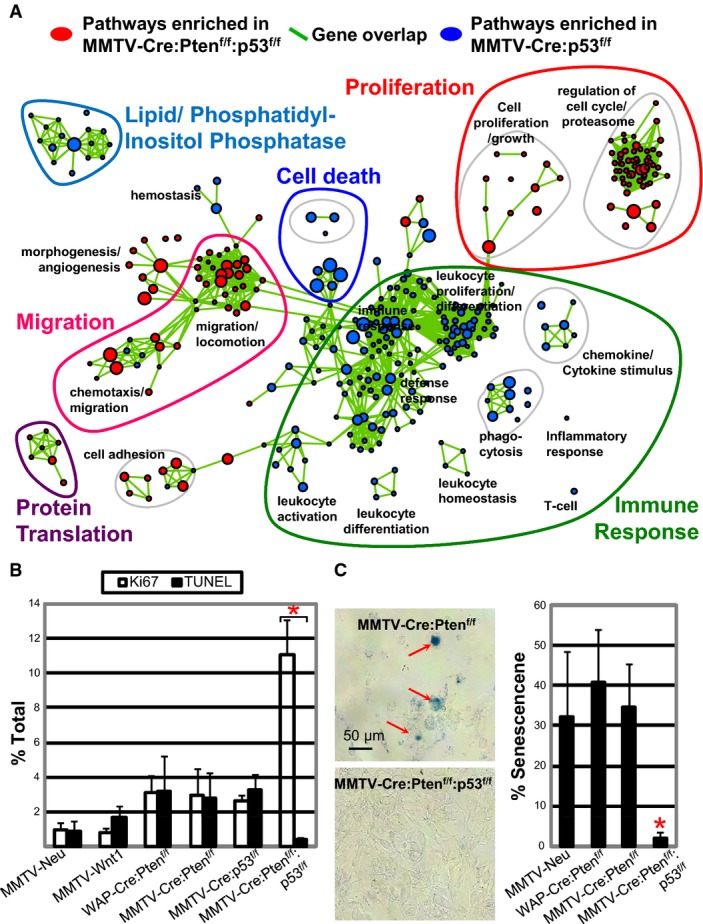
- GSEA analysis showing selected pathways enriched in claudin-low-like MMTV-Cre:Ptenf/f:p53f/f (red) versus pathways enriched in MMTV-Cre:p53f/f (blue) tumors. Green lines connect overlapping pathways. Proliferation, cell death, immune response, protein translation, and PI phosphatase pathways are highlighted; corresponding genes listed in Supplementary Table S1H–M. Full pathway analysis is shown in Supplementary Fig S5A.
- Cell proliferation (Ki67) and apoptosis (TUNEL) in indicated tumors. Representative staining and statistical analysis are shown in Supplementary Fig S5D and E.
- Senescence-associated β-Gal staining of indicated primary tumor cells plated on collagen-coated coverslips showing significantly lower level of senescence in MMTV-Cre:Ptenf/f:p53f/f tumor cells.
To test whether PtenΔf:p53Δf tumors exhibit increased cell proliferation and reduced apoptosis, as predicted from the pathway analysis, we stained tumor sections for cell proliferation using Ki67 and for cell death using TUNEL, which detects cleaved/nicked DNA, the hallmark of apoptosis. The ratio of cell proliferation to apoptosis was significantly higher in PtenΔf:p53Δf tumors (n = 10) relative to PtenΔf, p53Δf, Wnt1 and Neu tumors (n = 3–5 for each; Fig5B). Supplementary Figure S5E and F shows examples of staining for these markers and statistical analysis. To assess cellular senescence, primary tumors were dissociated, lineage-depleted, seeded at similar densities onto collagen-coated cover slides and, 3 days later, stained for senescence-associated β-galactosidase activity (Debacq-Chainiaux et al, 2009). This revealed much reduced cellular senescence and increased cellularity in PtenΔf:p53Δf compared to PtenΔf or Her2/Neu tumor cells (Fig5C). Thus, relative to PtenΔf or p53Δf single mutant, PtenΔf:p53Δf double-mutant claudin-low-like tumors exhibit multiple hallmarks of aggressive cancer.
Low Pten-expression/p53-pathway activity identifies TNBC patients with poor clinical outcome
To evaluate the effect of combined loss of Pten and p53 in TNBC, we used bioinformatics to identify Pten/p53-deficient patients with clinical data. Pten is often deregulated in BC through promoter methylation and microRNA-mediated silencing (Salmena et al, 2008; Koboldt et al, 2012), and its mRNA expression is the primary determinant of Pten protein levels in BC (Saal et al, 2007). We therefore assessed Pten RNA level from publicly available microarray expression data sets. For p53, we used a p53 pathway activity signature developed by Gatza et al (2010) (Supplementary Table S1N and O). We then took advantage of a BC cohort (GSE4922) with known p53 status to normalize pathway-activation values, using as a reference the median (0.15) of p53-mutant tumors (Fig6A). With these conditions, we determined Pten expression and p53 pathway activity for 2,179 patients including 471 TNBC, combined from 13 cohorts, six of which also had clinical information. Intrinsic BC subtypes were classified using PAM50 (Parker et al, 2009) (Supplementary Table S1P), and claudin-low TNBCs were identified using the Prat/Perou claudin-low signature (Supplementary Fig S6A). We found that 24.4% of TNBCs were Pten-low, 65.6% were p53-activity-low, and 18.7% were both Pten-low and p53-pathway-activity-low (Fig6B). This frequency of Pten-low/p53-low tumors in TNBC was significantly higher than in all other BC subtypes (P ≤ 5 × 10⁻⁶). In addition, only in TNBCs, there was a statistically significant correlation (0.11) between low Pten-expression and low p53-activity (P = 0.02; Fig6B). This positive yet low correlation is likely because in TNBC, p53 is often lost with other tumor suppressors, for example, INPP4B and RB, whereas Pten is often lost together with Brca1. Nevertheless, our results reveal that a substantial % of TNBC tumors (18.7%) is driven by combined loss of Pten and p53.
Figure 6. Correlation between Pten/p53 status and AKT pathway activity in BC and effect on clinical outcome.

- Box plot for p53-pathway activity in p53 wild-type and p53 mutant tumors from GSE4922. Median value of p53-pathway activity for p53 mutant, 0.15, is lower than for wild-type tumors (0.73; P = 6.5 × 10⁻¹⁵, Mann–Whitney U-test).
- Pten gene expression and p53 pathway activity in human BC (PAM50 classification). Triple negative (TN) comprises claudin-low, basal-like and other subtypes. Number of tumors per group: TN, 471 (claudin low, 141; basal-like, 330); HER2+, 218; LumA, 687; LumB, 672; Normal, 131. Percentage of samples with low Pten expression and low p53 pathway activity (Pten-low and p53-low) is indicated for each subtype. Pearson's correlation (r) with statistical significance (P-value) for Pten gene expression versus p53 pathway activity is shown for indicated BC subtypes. Only TNBCs exhibited significantly higher % of samples with Pten-low and p53-low (P ≤ 5 × 10⁻⁶ relative the other subtypes) as well as positive correlation (P = 0.02).
- Kaplan–Meier metastasis-free survival (% MFS) analysis showing that TNBC patients with Pten-low:p53-low tumors have poorer prognosis than Pten-high:p53-high tumors (P = 0.034, Wilcoxon).
- p53, PI3K and AKT pathway activities in mouse models (left) and human BC subtypes (right). Note the high and significant correlations of p53 and PI3K as well as p53 and AKT pathways in mouse Pten/p53 tumors and human claudin-low TNBC.
- Box plot of AKT pathway activity in indicated mouse and human tumors. For mouse tumors, AKT pathway activity was significantly higher in Ptenf/f:p53f/f compared to p53f/f tumors (*P = 0.04, Kruskal–Wallis). Comparisons with other models gave lower P-values. For human BC, AKT signaling was calculated for Pten/p53-low tumors (left boxes) versus all other tumors (right boxes). Note the high Akt pathway activity in mouse Pten/p53 tumors relative to other models (P < 0.04) and a trend toward increased Akt signaling in human Pten-low/p53-low versus other claudin-low tumors (P = 0.268). P-values (Kruskal–Wallis) are shown.
- Kaplan–Meier metastasis-free survival (% MFS) analysis showing that TNBC patients with AKT-high:p53-low tumors have poorer prognosis than AKT-low:p53-high tumors (P = 0.044, Wilcoxon).
Importantly, patients harboring TNBC with low Pten expression and low p53-pathway activity had significantly worse metastatic-free survival (MFS) compared to those with normal expression of both tumor suppressors, with hazard ratio (HR) of 1.75 (P = 0.034; Fig6C). Tumors with only one of these tumor suppressors lost exhibited intermediate MFS curves that were not significantly different than those for Pten/p53-low or Pten/p53-normal tumors (not shown). Thus, both in mouse and in human, Pten/p53 deficiency leads to aggressive TNBC.
AKT pathway activation occurs in mouse PtenΔf:p53Δf tumors and a subset of human Pten/p53-deficient TNBC
We next assessed the impact of Pten/p53 deletion on PI3K/AKT signaling by calculating pathway activation for AKT, PI3K and p53 (Gatza et al, 2010). As expected, p53-pathway activity in mouse p53Δf tumors was completely negative (Fig6D, p53 lane), thus validating the p53-pathway analysis. Interestingly, AKT pathway activity was only modestly elevated in the Pten-only or p53-deficient tumors relative to MMTV-Neu, but strongly induced in Pten/p53 double-mutant tumors (Fig6D and E), indicating that loss of Pten alone does not fully dysregulate the PI3K/AKT pathway. Indeed, a strong negative correlation between AKT- and p53-pathway activities was found in Pten/p53-deficient (−0.68; P = 0.005), but not in Pten or p53 single-mutant tumors. A negative correlation between the PI3K and p53 pathways was also seen in Pten/p53-deficient mammary tumors (−0.51; P = 0.049). Importantly, a box plot analysis revealed significantly elevated AKT signaling in mouse Pten/p53 claudin-low tumors (0.69) compared to p53Δ, PtenΔf or Neu tumors (P < 0.04 by Kruskal–Wallis; Fig6E, Supplementary Table S1N and O). Consistent with this, we observed elevated Akt phosphorylation at Ser473 in Pten/p53-deficient tumors (Supplementary Fig S6B). Analysis of 15 additional signaling pathways (Gatza et al, 2010) revealed that MYC, E2F1 and β-catenin pathway activities were also induced in Pten/p53-deficient tumors as compared to other subtypes and that similar induction was seen in human TNBC (Supplementary Fig S6C, Supplementary Table S1N and O).
In human BC, we found a modest negative correlation between AKT versus p53 pathways, and PI3K versus p53 pathways (−0.27, P = 0.001; −0.23; P = 0.005, respectively) in claudin-low but not in basal-like TNBC (Fig6D). When examining AKT signaling, only Pten/p53-low claudin-low tumors showed a trend toward elevated AKT pathway activation (Fig6E). This trend was not sufficiently significant (P = 0.268), possibly because in human TNBC, AKT signaling is induced through both Pten-dependent and Pten-independent mechanisms. Together, this analysis demonstrates the existence of a subgroup of Pten/p53-deficient TNBC (18.7%) and that even within this subgroup, there is great variability in the level of AKT pathway activity, likely due to different cooperating oncogenic networks.
To determine whether AKT-pathway-high/p53-pathway-low activity could predict clinical outcome, we used the top 30% high AKT pathway activity as “cutoff” level. Patients with AKT-pathway-high/p53-pathway-low TNBCs had poorer prognosis than those with AKT-pathway-low/p53-pathway-high (HR = 1.78; P = 0.044; Fig6F). Thus, TNBC patients with high AKT signaling and/or low Pten expression plus p53 loss have poor clinical outcome and should be prioritized for aggressive or new therapy.
Pten/p53-deficient claudin-low TNBC with elevated AKT signaling is susceptible to eEF2K inhibitors
To identify drugs that can target Pten/p53-deficient TNBCs with high AKT pathway activity, we performed a kinome drug screen (238 compounds targeting 154 different kinases; 3 μM; alamar blue assay) on four PtenΔf:p53Δf tumor cultures, each established from a distinct MMTV-Cre:Ptenf/f:p53f/f mammary tumor. We also screened two human TNBC lines, HCC1937 and BT549, which harbor mutations in both tumor suppressors (Neve et al, 2006; Hollestelle et al, 2007; Blick et al, 2008). Top inhibitors from both screens were eukaryotic elongation factor-2 kinase (eEF2K: TX-1918; NH125) and c-Jun N-terminal kinase (JNK; BI78D3) (Fig7A, Supplementary Fig S7A). Multiple PI3K, AKT and PI3K/mTOR inhibitors such as PIK-75, A-443654 and NVP-BEZ235 were also identified (Fig7A, Supplementary Fig S7A), hence validating our screen, but they were not as efficient as the eEF2K or JNK inhibitors. Dose–response curves for TX-1918 and NH125 using MTT assays revealed IC50 of approximately 0.2 μM for mouse PtenΔf:p53Δf tumors cells versus 1.1–1.8 μM for immortalized HC11 mammary epithelial cells (Fig7B). BI78D3 had IC50 of approximately 0.57 and 1.44 μM for PtenΔf:p53Δf tumors and HC11 cells, respectively (Supplementary Fig S7B). Western blot analysis confirmed inhibition of eEF2 phosphorylation on Thr56 following treatment of mouse and human Pten/p53-mutant TNBC cells with the eEF2K inhibitor (Fig7C).
Figure 7. Kinome drug screen identifies eEF2K inhibitors as potential therapeutic targets for TNBC with elevated AKT signaling.

- Kinase inhibitor screens on four independent primary MMTV-Cre:Ptenf/f:p53f/f tumor lines and two human Pten/p53 mutant BT549 and HCC1937 TNBC cell lines. Inhibitors for eEF2K (red), JNK (purple) and PI3K/AKT/mTOR (blue) are highlighted.
- Dose–response curves for mouse MMTV-Cre:Ptenf/f:p53f/f tumors versus immortalized HC11 epithelial cells treated with indicated eEF2K inhibitors.
- Inhibition of eEF2 phosphorylation by eEF2K inhibitor, TX-1918. Mouse or human Pten/p53-deficient tumor cells were serum-starved for 2 h, treated for 1 h with indicated concentrations of TX-1918 and immunoblotted with anti-Thr56 eEF2 antibody. Tubulin served as a loading control.
- BT549 cells were transfected with control (Dharmacon) or eEF2K siRNA at 25, 50 or 100 ng/ml. Two days later, cells were analyzed for eEF2K expression by Western blotting and for growth by MTT assay. *Significant difference comparing siRNA at 25 ng/ml with control, P = 0.00479 by ANOVA with Tukey test for post hoc. Comparisons at other concentrations gave lower P-values.
- Chloroquine but not TX-1918 suppresses autophagy/LC3-II accumulation.
- Dose–response curves for mouse MMTV-Cre:Ptenf/f:p53f/f tumor versus immortalized mouse epithelial HC11 cells and human TNBC (BT549, HCC1937) versus luminal (MDA361, CAMA1) cells treated with chloroquine.
- Levels of apoptosis in mouse PtenΔf:p53Δf, human BT549 and HER2+ HCC1954 cells after TX-1918 treatment as determined by Annexin V and 7AAD flow cytometry.
- Correlation analysis demonstrating that high AKT pathway activity but not 17 other signaling pathways sensitizes TNBC cells to eEF2K inhibitors TX-1918 and NH125.
- Meta-analysis demonstrating that high AKT pathway activity sensitizes TNBC cells to eEF2K inhibition (TX-1918). IC50 values for TX-1918 (n = 7) and control doxorubicin (n = 5) were determined in human TNBC cell lines (HCC38, HCC1937, BT549, MDAMB157, MDAMB436, MDAMB468). Correlation coefficient (r) of IC50 values with AKT pathway activities was calculated for each experiment by linear regression using meta-analysis, metaphor package in r: **r = −0.70, P < 0.0001 for TX-1918; *r = 0.42, P < 0.02 for doxorubicin.
Interestingly, protein translation including eEF2 was one of the modulated pathways in Pten/p53 versus p53 tumors (brown circle, FigA, Supplementary Table S1M). eEF2K is required for growth and is elevated in many types of cancer (Silvera et al, 2010). Our non-biased screen of six different lines is the first to identify this kinase as one of the most potent targets for Pten/p53-deficient TNBC. Recently, eEF2K was shown to maintain survival of brain tumor cells under nutrient deprivation (Leprivier et al, 2013). In contrast, we identified eEF2K inhibitors under normal serum conditions. To further examine these results, we knocked down eEF2K using RNA interference (Dharmacon). This led to incomplete (∼50%) reduction in eEF2K protein expression, yet suppressed cell growth twofold under normal (nutrient abundant) conditions (P < 0.005) (Fig7D).
Both eEF2K and JNK are downstream targets of the PI3K pathway (Vivanco et al, 2007; Py et al, 2009; Hubner et al, 2012; Leprivier et al, 2013), and both have been implicated in autophagy (Zhang et al, 2008; Wu et al, 2009; Cheng et al, 2010). In accordance, suppression of autophagy by chloroquine (CQ), an inhibitor of autophagosome–lysosome fusion (Klionsky et al, 2012), revealed high autophagy flux (LC3-II accumulation) and efficient killing of both mouse and human Pten/p53-deficient tumor cells as compared to immortalized mammary epithelial cells or human luminal BC cells (Fig7E and F). However, pharmacological inhibition of eEF2K with or without CQ did not have a discernable effect on the LC3-II/LC3-I ratio under non-starving conditions (Fig7E), suggesting that eEF2K does not sustain growth by modulating autophagy in Pten/p53-deficient tumor cells. Instead, flow cytometry analysis for Annexin V, a marker for apoptosis, revealed that low concentrations of TX-1918 (1 μM) induced apoptotic cell death in both mouse and human TNBC cells but not in the HER2+ BC line HCC1954 (Fig7G).
Understanding the link between genetic alterations in cancer and response to therapy is crucial for stratifying patients for therapy. We therefore determined whether sensitivity of six human TNBC cell lines (BT549, HCC38, HCC1937, MDAMB157, MDAMB436, MDAMB468) to eEF2K inhibitors was proportional to any of the 18 pathway signatures defined by Gatza et al (2010) (Supplementary Table S1Q). Remarkably, only the AKT pathway signature significantly correlated with sensitivity of TNBC cells to TX-1918 and NH125 (r = −0.85, P = 0.034; r = −0.91, P = 0.01, respectively; Fig7H). We then extended the analysis to seven independent experiments, each in duplicates, and plotted IC50 against pathway activity in the different cell lines. Linear regression using meta-analysis revealed that the sensitivity of TNBC cells to TX-1918 had a correlation coefficient of −0.70 (P < 0.0001; Fig7I; Supplementary Fig S7C). In contrast, response to doxorubicin was reduced with increased AKT signaling (correlation coefficient = 0.42, P < 0.02). Thus, AKT pathway signaling may be used as a predictor for patient response to eEF2K inhibitors.
eEF2K and JNK inhibitors suppress xenograft growth of Pten/p53-deficient claudin-low TNBC
TX-1918 contains a reactive side chain that is predicted to interact with glutathione in the blood and diminish half-life. Thus, to determine the effect of eEF2K inhibition on xenograft growth, we used NH125, which is active in vivo (Arora et al, 2003). Following orthotopic injection of mouse or human Pten/p53-mutant TNBC cells, mice were treated with tolerable doses of NH125 (intraperitoneal, 1 mg/kg/daily for 1 week followed by 1 mg/kg every second day). Both mouse tumor volume and human tumor volume were significantly inhibited (P < 0.0001; Fig8A). For the treated human BT549 xenograft, relapse occurred before the end point. Switching back to daily treatment halted further growth (Fig8A; center, 3rd arrow).
Figure 8. Anti-eEF2K or JNK monotherapy attenuates growth of Pten/p53-deficient TNBC xenografts.

- Drug–response curves for mouse PtenΔf:p53Δf and human BT549 tumor xenografts untreated or treated with eEF2K (NH125) or JNK (SP600125) inhibitors. Tumor cells were injected orthotopically into NOD/SCID mice. Mice (n = 9 per group) were injected with vehicle or NH125 (1 mg/kg) i.p. daily for 7 days (arrow #1), followed by every second day (arrow #2). For BT549 cells, mice were switched back to daily treatment for the final 4 days (arrow #3). SP600125 was administered at 60 mg/kg daily for 5 days (arrow #1) followed by 30 mg/kg daily (arrow #2). Inlets show 4 representative tumors of each group. Significant differences comparing control with treatment groups were determined by Graphpad Prism 5.0 with non-linear regression. **P < 0.0001.
- Response of PtenΔf:p53Δf mouse and human tumor cells to TX-1918 +/− doxorubicin. Indicated cells were treated with low-dose doxorubicin (0.1 mg/ml, 170 nM) or 0 (Con), plus 1 or 3 μM TX-1918 for 3 days and analyzed by MTT assay. Additive effect of TX-1918 plus doxorubicin was observed (*P < 0.05, t-test).
- Response of PtenΔf:p53Δf mouse and human cells to BI78D3 (JNK) +/− doxorubicin. Additive effect of BI78D3 plus doxorubicin was observed (*P < 0.05, t-test).
- Response of PtenΔf:p53Δf mouse and human cells to NVP-BEZ235 (PI3K/mTOR) +/− doxorubicin. Synergistic effect of NVP-BEZ235 plus doxorubicin was observed (*P < 0.05, t-test).
- Our results suggest that combined Pten/p53 loss in human TNBCs induces a range of AKT pathway activation, depending on different cooperating oncogenic events, which affects prognosis and tumor response to anti-eEF2K therapy.
To test for the effect of JNK inhibitors on xenograft growth, we used SP600125, which unlike BI78D3 identified in our screen is stable in vivo (Ennis et al, 2005). Administration of this inhibitor also attenuated xenograft growth of mouse Pten/p53-mutant tumor cells in vivo (P < 0.0001; Fig8A, right).
Current treatment of TNBC patients involves cytotoxic drugs such as doxorubicin, which have serious adverse side effects. Targeted drugs that can cooperate with doxorubicin to kill TNBC may reduce toxicity and improve outcome. We therefore tested for cooperation between TX-1918 (eEF2K), BI78D3 (JNK) or NVP-BEZ235 (PI3K/mTOR) and doxorubicin. Using Compusyn software to assess level of synergy for drug combinations, we found that TX-1918 and BI78D3 had additive effects with doxorubicin (Fig8B–D). Notably, although similar trends were observed, responses to TX-1918 or BI78D3 alone or together with doxorubicin were stronger than to NVP-BEZ235. Together, these results suggest that while patients carrying TNBC with high AKT pathway activity have poor prognosis, they would benefit from anti-eEF2K (as well as anti-JNK) therapy in combination with doxorubicin, thus encouraging rapid development of effective eEF2K inhibitors (Fig8E).
Discussion
TNBCs represent heterogeneous types of tumors that are highly aggressive and difficult to treat; metastatic disease is common and lethal. We found that the tumor suppressors Pten and p53 are lost together in over 18% of TNBC. Moreover, we showed that a subset of patients carrying Pten/p53-deficient TNBC have the worst prognosis compared to other TNBCs with normal level of these tumor suppressors. Using a kinome screen on primary mouse PtenΔf:p53Δf tumors cells and Pten/p53 mutant TNBC lines, we identified eEF2K as well as JNK as potent therapeutic targets. Inhibitors of these targets were significantly more effective than PI3K, AKT or PI3K/mTOR antagonists, some of which are currently tested in the clinic on TNBC patients. Our results therefore identify both eEF2K and JNK as promising therapeutic targets for Pten/p53-deficient TNBC.
We disrupted Pten and/or p53 with two different deleter lines: WAP-Cre (which preferentially targets CD24+, pregnancy-identified luminal/alveolar progenitors) and MMTV-CreNLST (which targets both the CD49fhigh/CD24+ and CD24+ compartments) (Wagner et al, 2002; Jiang et al, 2010). Although tumor latency was shorter when Pten and p53 were deleted via WAP-Cre relative to MMTV-Cre, histology and cluster analysis revealed that tumors driven by these two promoter-Cre lines were indistinguishable. This is somewhat unexpected because BC subtypes have been linked to the cell-of-origin within the mammary epithelial cell hierarchy; claudin-low tumors are thought to arise from transformation of mammary stem cells, basal-like tumors from bi-potent/early luminal progenitors, HER2+ BC from more committed luminal progenitors, etc. (Lim et al, 2009; Prat & Perou, 2009). As WAP-Cre is expressed in pregnancy-identified CD24+ alveolar progenitors, our observation that WAP-Cre:Ptenf/f mice develop diverse types of mammary tumors whereas nearly all WAP-Cre:Ptenf/f:p53f/f (and MMTV-Cre:Ptenf/f:p53f/f) mice give rise to claudin-low-like tumors supports a model whereby tumor subtype is dictated by both the cell-of-origin and the oncogenic/tumor suppressor networks that drive neoplastic transformation. Likewise, the fact that both WAP-Cre:Ptenf/f and MMTV-Cre:Ptenf/f mice gave rise to myoepithelioma, which is thought to originate from a myoepithelial cell of origin, suggests that combined deletion of Rb and p53 in luminal cells may induce dedifferentiation or transdifferentiation into myoepithelial cells. Two recent reports using other approaches or Cre drivers reached similar conclusions (Kim et al, 2014; Melchor et al, 2014).
Strikingly, despite the similarity between WAP-Cre:Ptenf/f:p53f/f and MMTV-Cre:Ptenf/f:p53f/f tumors, we identified 24 genes that were significantly and differentially expressed between the two models. This 24-gene set (WCLS) could stratify claudin-low patients into two groups with different clinical outcomes. WCLS marked low EMT/senescence, suggesting that tumors that originate from alveolar progenitors, as in WAP-Cre-driven tumors, are not locked in the EMT state as those driven by MMTV-Cre and are therefore more aggressive. Interestingly, in the prostate gland, a signature derived from luminal cells is also more predictive of poor patient outcome than a signature derived from tumors that originate from basal cells (Wang et al, 2013). Taken together, our results identify a novel predictor for claudin-low BC and support the idea that over-commitment to EMT diminishes metastasis.
Our genetic analysis of PtenΔf:p53Δf tumors revealed several levels of cooperation between these two tumor suppressors. First, Pten/p53 tumors are induced faster than p53 or Pten single-mutant tumors and exhibit an increase in pathways associated with proliferation and motility and reduction in pathways associated with cell death and immune response. In addition, while only some p53-deficient tumors are sarcomatoid, nearly all Pten/p53-deficient tumors share this histology and cluster with human claudin-low TNBC. Finally, Pten/p53-deficient tumors had a prominent CD24−:CD49f− fraction where most TICs reside, whereas both Pten- and p53-single knockout tumor cells are primarily CD24+:CD49f+. The absence of CD24 expression, a luminal marker, on PtenΔf:p53Δf TICs underscores the highly mesenchymal nature of these tumors.
Second, we found that while AKT pathway activity was elevated in mouse Pten/p53-deficient mammary tumors, it was not consistently induced in human Pten/p53-low TNBC, likely because mutations in other components of the PI3K pathway, for example, Pik3ca, INPP4B, activate the pathway independently of Pten loss. Notably, Pten and PIK3CA are co-mutated in some human TNBCs (Yuan & Cantley, 2008; Lehmann et al, 2011), suggesting that mutations in more than one gene on the PI3K pathway may be required to fully activate the pathway, which is tightly autoregulated in normal cells (Cully et al, 2006). As a consequence, only a fraction of human Pten/p53-deficient TNBCs show high PI3K/AKT signaling and become sensitive to antagonists of this pathway. This model has direct implications for cancer therapy as it suggests that to guide therapy, patients should be screened for PI3K/AKT pathway activation or for multiple mutations along the pathway rather than for a single gene mutation (Janku et al, 2012; Rodon et al, 2013).
Our screen identified two eEF2K inhibitors as the most potent drugs against Pten/p53-deficient claudin-low TNBC cell lines. eEF2K is phosphorylated and inactivated by S6K1, downstream of mTORC1, leading to activation of eEF2 and mRNA translation elongation. eEF2K is also regulated by other signaling pathways including ERK and AMPK (Leprivier et al, 2013). Inhibition of eEF2K is thought to increase protein translation to unsustainable rate under nutrient deprivation, leading to cell demise. eEF2K has also been implicated in autophagy (Wu et al, 2009; Cheng et al, 2010). Interestingly, JNK is also linked to this process and, consistent with this, we found that Pten/p53-deficient tumor cells exhibit elevated autophagy flux and high sensitivity to the autophagosome–lysosome inhibitor CQ. However, inhibition of eEF2K (or JNK) did not affect autophagy under non-starving conditions. Instead, we found that eEF2K inhibition triggered apoptotic cell death even in nutrient-rich media through a mechanism that is not yet fully understood. Notably, TNBCs in general and as we show here Pten/p53-deficient tumors in particular are highly hypoxic. Hypoxia, similarly to nutrient deprivation, inhibits mTOR and protein translation in part by activating eEF2K and, therefore, eEF2K inhibitors may be exceptionally useful in treating hypoxic TNBC.
Available eEF2K inhibitors used herein have short half-life or off target effects (Arora et al, 2004). The essential role of eEF2K in Pten/p53-deficient TNBC (this study) and in brain cancer (Leprivier et al, 2013) should encourage development of specific and effective eEF2K inhibitors. These inhibitors may be used, as we showed here, as monotherapy, in combination with standard anthracycline therapy or with other drugs, such as a recently identified PLK4 inhibitor, which show strong anti-tumor activity against Pten-deficient BC (Mason et al, 2014). Moreover, we demonstrated that AKT pathway activity could predict response of TNBC to eEF2K inhibitors. Thus, development of a simple surrogate assay (e.g. immunostaining) for AKT pathway activation would simplify identification of TNBC patients who would benefit from anti-eEF2K-based therapy.
Materials and Methods
Animals
Mice used in this study were on mixed background (FvB, C57BL/6 and 129/sv): WAP-Cre mice were kindly received from Dr. Lothar Hennighausen, NIH, p53f/f mice were obtained from the NCI Mouse Repository, and Ptenf/f mice were generated as described (Suzuki et al, 1998). For transplantation assays, we used immunocompromised Rag1−/− females as recipients (JAX). Mice were housed in ventilated cages in our pathogen-free facility and monitored for mammary tumors as indicated in Figs1, 4 and 8. For this study, we used approximately 580 female mice for tumor analysis and transplantation assays. All experimental protocols were approved by the Toronto General Research Institute—UHN Animal Care Committee in accordance with the guidelines of the Canadian Council on Animal Care (AUP#10.50 and AUP#803).
Bioinformatics
Microarray analysis with mouse tumor models was carried out using Affymetrix Mouse Gene 1.0 ST with 500 ng of total RNA isolated by double TRIzol extractions (Centre for Applied Genomics, Hospital for Sick Children, Toronto). Microarray data were normalized using RMA method via Partek software, and log2-transformed gene expression values were obtained.
For generating prognostic signature for claudin-low breast cancer (WCLS), ANOVA with FDR correction was performed between WAP-Cre:Ptenf/f:p53f/f and MMTV-Cre:Ptenf/f:p53f/f tumors to identify significantly (FDR q-value < 0.05) and differentially (> twofold) expressed genes. Kaplan–Meier and survival analysis were performed with PAST program (P.D. Ryan and Ø. Hammer, University of Oslo), and P-value was calculated by Wilcoxon method. Hazard ratios were obtained using the COX proportional hazards survival regression method. Heatmaps and dendrograms were generated by JAVA tree view.
Gene set enrichment analysis was performed using GSEA (Subramanian et al, 2005) with parameters set to 2,000 gene set permutations and gene sets size between 8 and 500. Gene sets were obtained from KEGG, MsigDB-c2, NCI, Biocarta, IOB, Netpath, Human Cyc, Reactome and the Gene Ontology (GO) databases.
The paper explained.
Problem
Triple-negative breast cancer (TNBC) is a devastating subtype that affects approximately 10–20% of breast cancer patients. The tumor suppressors p53 and Pten are often inactivated in TNBC, but the consequences of combined mutations in these genes on tumorigenesis and response to therapy are largely unknown.
Results
We used Pten/p53-deficient mice and human TNBC cell lines to investigate how these two tumor suppressors cooperate to induce aggressive TNBC. We show that combined inactivation of Pten plus p53 via WAP-Cre or MMTV-Cre deleter lines induced claudin-low-like TNBC. We found 24 genes (WCLS) that are differentially and significantly expressed between MMTV-Cre:Ptenf/f:p53f/f and WAP-Cre:Ptenf/f:p53f/f double-mutant tumors and demonstrated that they can predict clinical outcome in claudin-low TNBC patients. Through non-biased kinome screens of mouse and human Pten/p53-deficient TNBC cells, we identified eEF2K as a potent inhibitor for TNBC with elevated AKT pathway activity.
Impact
WCLS-positive claudin-low TNBC patients should be prioritized for aggressive therapy. TNBC patients with elevated AKT pathway activity may benefit from anti-eEF2K therapy.
Exact P-values are shown except for ANOVA, where the highest P-value is given in the multi-group comparison, and for PRISM analysis, which does not provide specific P-values < 0.0001.
The microarray data from this publication have been submitted to the NCBI GEO database (http://www.ncbi.nlm.nih.gov/geo/) and assigned the identifier GSE39955.
Kinase inhibitor screening, IC50 and MTT assay
238 compounds targeting 154 different kinases were screened using a Biomek FX liquid handler equipped with a pin tool for automated compound dispensing. Assays were carried out in a 384-well format with 300 cells/well.
Xenograft assays
Pten:p53-mutant mouse (200,000 cells/injection) or human BT549 (1 million cells/injection) tumor cells were resuspended in 20 μl media/matrigel mixture (1:1) and injected into #4 mammary glands of NOD/SCID females (9 mice per group). Tumor-bearing mice were randomized and then treated intraperitoneally with NH125 (1 mg/kg, dissolved in PBS with 2% DMSO) or SP600125 (60 mg/kg and 30 mg/kg, dissolved in DMSO). Control mice were injected with vehicle alone at the same weight/volume ratio.
Acknowledgments
We thank Dr. Lothar Hennighausen for WAP-Cre mice and Huiqin Li for help with TUNEL analysis. JCL was supported in part by a fellowship from the Canadian BC Foundation, SW by CIHR Banting & Best and the Canadian BC Foundation, and RAJ by US Army Department of Defense BC Research Program Postdoctoral Fellowship Award. This study was conducted with support from the U.S. National Institutes of Health grant GM103504 to GDB; from the Canadian BC Foundation to SEE; and from the Canadian BC Foundation, Ontario Institute for Cancer Research through funding provided by the Government of Ontario, the Terry-Fox Foundation and Canadian BC Research Alliance/Canadian Cancer Society Research Institute (CCSRI) to EZ.
Author contributions
JCL, VV, SW, DYW and DU conducted experiments and analyzed the data. AD, RA, SEE, GDB, MT and TWM supervised and interpreted the data. RAJ provided some tumor samples. JCL and EZ conceived and supervised the study, analyzed and interpreted the data, and wrote the manuscript.
Conflict of interest
The authors declare that they have no conflict of interest.
Supporting Information
for this article is available online: http://embomolmed.embopress.org
Supplementary Information
Supplementary Table S1
Review Process File
References
- Adams JR, Schachter NF, Liu JC, Zacksenhaus E, Egan SE. Elevated PI3K signaling drives multiple breast cancer subtypes. Oncotarget. 2011;2:435–447. doi: 10.18632/oncotarget.285. [DOI] [PMC free article] [PubMed] [Google Scholar]
- Arora S, Yang JM, Kinzy TG, Utsumi R, Okamoto T, Kitayama T, Ortiz PA, Hait WN. Identification and characterization of an inhibitor of eukaryotic elongation factor 2 kinase against human cancer cell lines. Cancer Res. 2003;63:6894–6899. [PubMed] [Google Scholar]
- Arora S, Yang JM, Utsumi R, Okamoto T, Kitayama T, Hait WN. P-glycoprotein mediates resistance to histidine kinase inhibitors. Mol Pharmacol. 2004;66:460–467. doi: 10.1124/mol.66.3.. [DOI] [PubMed] [Google Scholar]
- Benito M, Parker J, Du Q, Wu J, Xiang D, Perou CM, Marron JS. Adjustment of systematic microarray data biases. Bioinformatics. 2004;20:105–114. doi: 10.1093/bioinformatics/btg385. [DOI] [PubMed] [Google Scholar]
- Blick T, Widodo E, Hugo H, Waltham M, Lenburg ME, Neve RM, Thompson EW. Epithelial mesenchymal transition traits in human breast cancer cell lines. Clin Exp Metastasis. 2008;25:629–642. doi: 10.1007/s10585-008-9170-6. [DOI] [PubMed] [Google Scholar]
- Blick T, Hugo H, Widodo E, Waltham M, Pinto C, Mani SA, Weinberg RA, Neve RM, Lenburg ME, Thompson EW. Epithelial mesenchymal transition traits in human breast cancer cell lines parallel the CD44(hi/)CD24 (lo/−) stem cell phenotype in human breast cancer. J Mammary Gland Biol Neoplasia. 2010;15:235–252. doi: 10.1007/s10911-010-9175-z. [DOI] [PubMed] [Google Scholar]
- Carey LA, Dees EC, Sawyer L, Gatti L, Moore DT, Collichio F, Ollila DW, Sartor CI, Graham ML, Perou CM. The triple negative paradox: primary tumor chemosensitivity of breast cancer subtypes. Clin Cancer Res. 2007;13:2329–2334. doi: 10.1158/1078-0432.CCR-06-1109. [DOI] [PubMed] [Google Scholar]
- Chang CJ, Chao CH, Xia W, Yang JY, Xiong Y, Li CW, Yu WH, Rehman SK, Hsu JL, Lee HH, et al. p53 regulates epithelial-mesenchymal transition and stem cell properties through modulating miRNAs. Nat Cell Biol. 2011;13:317–323. doi: 10.1038/ncb2173. [DOI] [PMC free article] [PubMed] [Google Scholar]
- Cheng Y, Li H, Ren X, Niu T, Hait WN, Yang J. Cytoprotective effect of the elongation factor-2 kinase-mediated autophagy in breast cancer cells subjected to growth factor inhibition. PLoS ONE. 2010;5:e9715. doi: 10.1371/journal.pone.0009715. [DOI] [PMC free article] [PubMed] [Google Scholar]
- Creighton CJ, Li X, Landis M, Dixon JM, Neumeister VM, Sjolund A, Rimm DL, Wong H, Rodriguez A, Herschkowitz JI, et al. Residual breast cancers after conventional therapy display mesenchymal as well as tumor-initiating features. Proc Natl Acad Sci USA. 2009;106:13820–13825. doi: 10.1073/pnas.0905718106. [DOI] [PMC free article] [PubMed] [Google Scholar]
- Cully M, You H, Levine AJ, Mak TW. Beyond PTEN mutations: the PI3K pathway as an integrator of multiple inputs during tumorigenesis. Nat Rev Cancer. 2006;6:184–192. doi: 10.1038/nrc1819. [DOI] [PubMed] [Google Scholar]
- Debacq-Chainiaux F, Erusalimsky JD, Campisi J, Toussaint O. Protocols to detect senescence-associated beta-galactosidase (SA-betagal) activity, a biomarker of senescent cells in culture and in vivo. Nat Protoc. 2009;4:1798–1806. doi: 10.1038/nprot.2009.191. [DOI] [PubMed] [Google Scholar]
- Deng T, Liu JC, Chung PE, Uehling D, Aman A, Joseph B, Ketela T, Jiang Z, Schachter NF, Rottapel R, et al. shRNA kinome screen identifies TBK1 as a therapeutic target for HER2+ breast cancer. Cancer Res. 2014;74:2119–2130. doi: 10.1158/0008-5472.CAN-13-2138. [DOI] [PubMed] [Google Scholar]
- Ennis BW, Fultz KE, Smith KA, Westwick JK, Zhu D, Boluro-Ajayi M, Bilter GK, Stein B. Inhibition of tumor growth, angiogenesis, and tumor cell proliferation by a small molecule inhibitor of c-Jun N-terminal kinase. J Pharmacol Exp Ther. 2005;313:325–332. doi: 10.1124/jpet.104.078873. [DOI] [PubMed] [Google Scholar]
- Gatza ML, Lucas JE, Barry WT, Kim JW, Wang Q, Crawford MD, Datto MB, Kelley M, Mathey-Prevot B, Potti A, et al. A pathway-based classification of human breast cancer. Proc Natl Acad Sci USA. 2010;107:6994–6999. doi: 10.1073/pnas.0912708107. [DOI] [PMC free article] [PubMed] [Google Scholar]
- Gordon V, Banerji S. Molecular pathways: PI3K pathway targets in triple-negative breast cancers. Clin Cancer Res. 2013;19:3738–3744. doi: 10.1158/1078-0432.CCR-12-0274. [DOI] [PubMed] [Google Scholar]
- Gregory PA, Bert AG, Paterson EL, Barry SC, Tsykin A, Farshid G, Vadas MA, Khew-Goodall Y, Goodall GJ. The miR-200 family and miR-205 regulate epithelial to mesenchymal transition by targeting ZEB1 and SIP1. Nat Cell Biol. 2008;10:593–601. doi: 10.1038/ncb1722. [DOI] [PubMed] [Google Scholar]
- Guo W, Keckesova Z, Donaher JL, Shibue T, Tischler V, Reinhardt F, Itzkovitz S, Noske A, Zurrer-Hardi U, Bell G, et al. Slug and Sox9 cooperatively determine the mammary stem cell state. Cell. 2012;148:1015–1028. doi: 10.1016/j.cell.2012.02.008. [DOI] [PMC free article] [PubMed] [Google Scholar]
- Hallett RM, Dvorkin-Gheva A, Bane A, Hassell JA. A gene signature for predicting outcome in patients with basal-like breast cancer. Sci Rep. 2012;2:227. doi: 10.1038/srep00227. [DOI] [PMC free article] [PubMed] [Google Scholar]
- Herschkowitz JI, Simin K, Weigman VJ, Mikaelian I, Usary J, Hu Z, Rasmussen KE, Jones LP, Assefnia S, Chandrasekharan S, et al. Identification of conserved gene expression features between murine mammary carcinoma models and human breast tumors. Genome Biol. 2007;8:R76. doi: 10.1186/gb-2007-8-5-r76. [DOI] [PMC free article] [PubMed] [Google Scholar]
- Herschkowitz JI, Zhao W, Zhang M, Usary J, Murrow G, Edwards D, Knezevic J, Greene SB, Darr D, Troester MA, et al. Comparative oncogenomics identifies breast tumors enriched in functional tumor-initiating cells. Proc Natl Acad Sci USA. 2012;109:2778–2783. doi: 10.1073/pnas.1018862108. [DOI] [PMC free article] [PubMed] [Google Scholar]
- Hollestelle A, Elstrodt F, Nagel JH, Kallemeijn WW, Schutte M. Phosphatidylinositol-3-OH kinase or RAS pathway mutations in human breast cancer cell lines. Mol Cancer Res. 2007;5:195–201. doi: 10.1158/1541-7786.MCR-06-0263. [DOI] [PubMed] [Google Scholar]
- Holstege H, Horlings HM, Velds A, Langerod A, Borresen-Dale AL, van de Vijver MJ, Nederlof PM, Jonkers J. BRCA1-mutated and basal-like breast cancers have similar aCGH profiles and a high incidence of protein truncating TP53 mutations. BMC Cancer. 2010;10:654. doi: 10.1186/1471-2407-10-654. [DOI] [PMC free article] [PubMed] [Google Scholar]
- Hu Z, Fan C, Livasy C, He X, Oh DS, Ewend MG, Carey LA, Subramanian S, West R, Ikpatt F, et al. A compact VEGF signature associated with distant metastases and poor outcomes. BMC Med. 2009;7:9. doi: 10.1186/1741-7015-7-9. [DOI] [PMC free article] [PubMed] [Google Scholar]
- Hubner A, Mulholland DJ, Standen CL, Karasarides M, Cavanagh-Kyros J, Barrett T, Chi H, Greiner DL, Tournier C, Sawyers CL, et al. JNK and PTEN cooperatively control the development of invasive adenocarcinoma of the prostate. Proc Natl Acad Sci USA. 2012;109:12046–12051. doi: 10.1073/pnas.1209660109. [DOI] [PMC free article] [PubMed] [Google Scholar]
- Irshad S, Ashworth A, Tutt A. Therapeutic potential of PARP inhibitors for metastatic breast cancer. Expert Rev Anticancer Ther. 2011;11:1243–1251. doi: 10.1586/era.11.52. [DOI] [PubMed] [Google Scholar]
- Janku F, Wheler JJ, Westin SN, Moulder SL, Naing A, Tsimberidou AM, Fu S, Falchook GS, Hong DS, Garrido-Laguna I, et al. PI3K/AKT/mTOR inhibitors in patients with breast and gynecologic malignancies harboring PIK3CA mutations. J Clin Oncol. 2012;30:777–782. doi: 10.1200/JCO.2011.36.1196. [DOI] [PMC free article] [PubMed] [Google Scholar]
- Jiang Z, Deng T, Jones R, Li H, Herschkowitz JI, Liu JC, Weigman VJ, Tsao MS, Lane TF, Perou CM, et al. Rb deletion in mouse mammary progenitors induces luminal-B or basal-like/EMT tumor subtypes depending on p53 status. J Clin Invest. 2010;120:3296–3309. doi: 10.1172/JCI41490. [DOI] [PMC free article] [PubMed] [Google Scholar]
- Jiang Z, Jones R, Liu JC, Deng T, Robinson T, Chung PE, Wang S, Herschkowitz JI, Egan SE, Perou CM, et al. RB1 and p53 at the crossroad of EMT and triple-negative breast cancer. Cell Cycle. 2011;10:1563–1570. doi: 10.4161/cc.10.10.15703. [DOI] [PubMed] [Google Scholar]
- Kawase T, Ohki R, Shibata T, Tsutsumi S, Kamimura N, Inazawa J, Ohta T, Ichikawa H, Aburatani H, Tashiro F, et al. PH domain-only protein PHLDA3 is a p53-regulated repressor of Akt. Cell. 2009;136:535–550. doi: 10.1016/j.cell.2008.12.002. [DOI] [PubMed] [Google Scholar]
- Kim T, Veronese A, Pichiorri F, Lee TJ, Jeon YJ, Volinia S, Pineau P, Marchio A, Palatini J, Suh SS, et al. p53 regulates epithelial-mesenchymal transition through microRNAs targeting ZEB1 and ZEB2. J Exp Med. 2011;208:875–883. doi: 10.1084/jem.20110235. [DOI] [PMC free article] [PubMed] [Google Scholar]
- Kim N, He N, Kim C, Zhang F, Lu Y, Yu Q, Stemke-Hale K, Greshock J, Wooster R, Yoon S, et al. Systematic analysis of genotype-specific drug responses in cancer. Int J Cancer. 2012;131:2456–2464. doi: 10.1002/ijc.27529. [DOI] [PMC free article] [PubMed] [Google Scholar]
- Kim G, Ouzounova M, Quraishi AA, Davis A, Tawakkol N, Clouthier SG, Malik F, Paulson AK, D'Angelo RC, Korkaya S, et al. SOCS3-mediated regulation of inflammatory cytokines in PTEN and p53 inactivated triple negative breast cancer model. Oncogene. 2014 doi: 10.1038/onc.2014.4. doi: 10.1038/onc.2014.4. [DOI] [PMC free article] [PubMed] [Google Scholar]
- Klionsky DJ, Abdalla FC, Abeliovich H, Abraham RT, Acevedo-Arozena A, Adeli K, Agholme L, Agnello M, Agostinis P, Aguirre-Ghiso JA, et al. Guidelines for the use and interpretation of assays for monitoring autophagy. Autophagy. 2012;8:445–544. doi: 10.4161/auto.19496. [DOI] [PMC free article] [PubMed] [Google Scholar]
- Knight JF, Lesurf R, Zhao H, Pinnaduwage D, Davis RR, Saleh SM, Zuo D, Naujokas MA, Chughtai N, Herschkowitz JI, et al. Met synergizes with p53 loss to induce mammary tumors that possess features of claudin-low breast cancer. Proc Natl Acad Sci USA. 2013;110:E1301–E1310. doi: 10.1073/pnas.1210353110. [DOI] [PMC free article] [PubMed] [Google Scholar]
- Koboldt DC, Fulton RS, McLellan MD, Schmidt H, Kalicki-Veizer J, McMichael JF, Fulton LL, Dooling DJ, Ding L, Mardis ER, et al. Comprehensive molecular portraits of human breast tumours. Nature. 2012;490:61–70. doi: 10.1038/nature11412. [DOI] [PMC free article] [PubMed] [Google Scholar]
- Korkaya H, Paulson A, Charafe-Jauffret E, Ginestier C, Brown M, Dutcher J, Clouthier SG, Wicha MS. Regulation of mammary stem/progenitor cells by PTEN/Akt/beta-catenin signaling. PLoS Biol. 2009;7:e1000121. doi: 10.1371/journal.pbio.1000121. [DOI] [PMC free article] [PubMed] [Google Scholar]
- Kreso A, Dick JE. Evolution of the cancer stem cell model. Cell Stem Cell. 2014;14:275–291. doi: 10.1016/j.stem.2014.02.006. [DOI] [PubMed] [Google Scholar]
- Lehmann BD, Bauer JA, Chen X, Sanders ME, Chakravarthy AB, Shyr Y, Pietenpol JA. Identification of human triple-negative breast cancer subtypes and preclinical models for selection of targeted therapies. J Clin Invest. 2011;121:2750–2767. doi: 10.1172/JCI45014. [DOI] [PMC free article] [PubMed] [Google Scholar]
- Leprivier G, Remke M, Rotblat B, Dubuc A, Mateo AR, Kool M, Agnihotri S, El-Naggar A, Yu B, Somasekharan SP, et al. The eEF2 kinase confers resistance to nutrient deprivation by blocking translation elongation. Cell. 2013;153:1064–1079. doi: 10.1016/j.cell.2013.04.055. [DOI] [PMC free article] [PubMed] [Google Scholar]
- Leslie NR, Yang X, Downes CP, Weijer CJ. PtdIns(3,4,5)P(3)-dependent and -independent roles for PTEN in the control of cell migration. Curr Biol. 2007;17:115–125. doi: 10.1016/j.cub.2006.12.026. [DOI] [PMC free article] [PubMed] [Google Scholar]
- Li J, Yen C, Liaw D, Podsypanina K, Bose S, Wang SI, Puc J, Miliaresis C, Rodgers L, McCombie R, et al. PTEN, a putative protein tyrosine phosphatase gene mutated in human brain, breast, and prostate cancer. Science. 1997;275:1943–1947. doi: 10.1126/science.275.5308.1943. [DOI] [PubMed] [Google Scholar]
- Li G, Robinson GW, Lesche R, Martinez-Diaz H, Jiang Z, Rozengurt N, Wagner KU, Wu DC, Lane TF, Liu X, et al. Conditional loss of PTEN leads to precocious development and neoplasia in the mammary gland. Development. 2002;129:4159–4170. doi: 10.1242/dev.129.17.4159. [DOI] [PubMed] [Google Scholar]
- Li Y, Welm B, Podsypanina K, Huang S, Chamorro M, Zhang X, Rowlands T, Egeblad M, Cowin P, Werb Z, et al. Evidence that transgenes encoding components of the Wnt signaling pathway preferentially induce mammary cancers from progenitor cells. Proc Natl Acad Sci USA. 2003;100:15853–15858. doi: 10.1073/pnas.2136825100. [DOI] [PMC free article] [PubMed] [Google Scholar]
- Lim E, Vaillant F, Wu D, Forrest NC, Pal B, Hart AH, Asselin-Labat ML, Gyorki DE, Ward T, Partanen A, et al. Aberrant luminal progenitors as the candidate target population for basal tumor development in BRCA1 mutation carriers. Nat Med. 2009;15:907–913. doi: 10.1038/nm.2000. [DOI] [PubMed] [Google Scholar]
- Liu JC, Deng T, Lehal RS, Kim J, Zacksenhaus E. Identification of tumorsphere- and tumor-initiating cells in HER2/Neu-induced mammary tumors. Cancer Res. 2007;67:8671–8681. doi: 10.1158/0008-5472.CAN-07-1486. [DOI] [PubMed] [Google Scholar]
- Liu JC, Egan SE, Zacksenhaus E. A Tumor initiating cell-enriched prognostic signature for HER2 + :ERalpha- breast cancer; rationale, new features, controversies and future directions. Oncotarget. 2013;4:1317–1328. doi: 10.18632/oncotarget.1170. [DOI] [PMC free article] [PubMed] [Google Scholar]
- Mani SA, Guo W, Liao MJ, Eaton EN, Ayyanan A, Zhou AY, Brooks M, Reinhard F, Zhang CC, Shipitsin M, et al. The epithelial-mesenchymal transition generates cells with properties of stem cells. Cell. 2008;133:704–715. doi: 10.1016/j.cell.2008.03.027. [DOI] [PMC free article] [PubMed] [Google Scholar]
- Mason JM, Lin DC, Wei X, Che Y, Yao Y, Kiarash R, Cescon DW, Fletcher GC, Awrey DE, Bray MR, et al. Functional characterization of CFI-400945, a polo-like kinase 4 inhibitor, as a potential anticancer agent. Cancer Cell. 2014;26:163–176. doi: 10.1016/j.ccr.2014.05.006. [DOI] [PubMed] [Google Scholar]
- Melchor L, Molyneux G, Mackay A, Magnay FA, Atienza M, Kendrick H, Nava-Rodrigues D, Lopez-Garcia MA, Milanezi F, Greenow K, et al. Identification of cellular and genetic drivers of breast cancer heterogeneity in genetically engineered mouse tumour models. J Pathol. 2014;233:124–137. doi: 10.1002/path.4345. [DOI] [PubMed] [Google Scholar]
- Merico D, Isserlin R, Stueker O, Emili A, Bader GD. Enrichment map: a network-based method for gene-set enrichment visualization and interpretation. PLoS ONE. 2011;5:e13984. doi: 10.1371/journal.pone.0013984. [DOI] [PMC free article] [PubMed] [Google Scholar]
- Neve RM, Chin K, Fridlyand J, Yeh J, Baehner FL, Fevr T, Clark L, Bayani N, Coppe JP, Tong F, et al. A collection of breast cancer cell lines for the study of functionally distinct cancer subtypes. Cancer Cell. 2006;10:515–527. doi: 10.1016/j.ccr.2006.10.008. [DOI] [PMC free article] [PubMed] [Google Scholar]
- Ocana OH, Corcoles R, Fabra A, Moreno-Bueno G, Acloque H, Vega S, Barrallo-Gimeno A, Cano A, Nieto MA. Metastatic colonization requires the repression of the epithelial-mesenchymal transition inducer Prrx1. Cancer Cell. 2012;22:709–724. doi: 10.1016/j.ccr.2012.10.012. [DOI] [PubMed] [Google Scholar]
- Parker JS, Mullins M, Cheang MC, Leung S, Voduc D, Vickery T, Davies S, Fauron C, He X, Hu Z, et al. Supervised risk predictor of breast cancer based on intrinsic subtypes. J Clin Oncol. 2009;27:1160–1167. doi: 10.1200/JCO.2008.18.1370. [DOI] [PMC free article] [PubMed] [Google Scholar]
- Prat A, Perou CM. Mammary development meets cancer genomics. Nat Med. 2009;15:842–844. doi: 10.1038/nm0809-842. [DOI] [PubMed] [Google Scholar]
- Prat A, Parker JS, Karginova O, Fan C, Livasy C, Herschkowitz JI, He X, Perou CM. Phenotypic and molecular characterization of the claudin-low intrinsic subtype of breast cancer. Breast Cancer Res. 2010;12:R68. doi: 10.1186/bcr2635. [DOI] [PMC free article] [PubMed] [Google Scholar]
- Prat A, Perou CM. Deconstructing the molecular portraits of breast cancer. Mol Oncol. 2011;5:5–23. doi: 10.1016/j.molonc.2010.11.003. [DOI] [PMC free article] [PubMed] [Google Scholar]
- Py BF, Boyce M, Yuan J. A critical role of eEF-2K in mediating autophagy in response to multiple cellular stresses. Autophagy. 2009;5:393–396. doi: 10.4161/auto.5.3.7762. [DOI] [PMC free article] [PubMed] [Google Scholar]
- Rodon J, Dienstmann R, Serra V, Tabernero J. Development of PI3K inhibitors: lessons learned from early clinical trials. Nat Rev Clin Oncol. 2013;10:143–153. doi: 10.1038/nrclinonc.2013.10. [DOI] [PubMed] [Google Scholar]
- Saal LH, Johansson P, Holm K, Gruvberger-Saal SK, She QB, Maurer M, Koujak S, Ferrando AA, Malmstrom P, Memeo L, et al. Poor prognosis in carcinoma is associated with a gene expression signature of aberrant PTEN tumor suppressor pathway activity. Proc Natl Acad Sci USA. 2007;104:7564–7569. doi: 10.1073/pnas.0702507104. [DOI] [PMC free article] [PubMed] [Google Scholar]
- Salmena L, Carracedo A, Pandolfi PP. Tenets of PTEN tumor suppression. Cell. 2008;133:403–414. doi: 10.1016/j.cell.2008.04.013. [DOI] [PubMed] [Google Scholar]
- Shah SP, Roth A, Goya R, Oloumi A, Ha G, Zhao Y, Turashvili G, Ding J, Tse K, Haffari G, et al. The clonal and mutational evolution spectrum of primary triple-negative breast cancers. Nature. 2012;486:395–399. doi: 10.1038/nature10933. [DOI] [PMC free article] [PubMed] [Google Scholar]
- Silvera D, Formenti SC, Schneider RJ. Translational control in cancer. Nat Rev Cancer. 2010;10:254–266. doi: 10.1038/nrc2824. [DOI] [PubMed] [Google Scholar]
- Stambolic V, Suzuki A, de la Pompa JL, Brothers GM, Mirtsos C, Sasaki T, Ruland J, Penninger JM, Siderovski DP, Mak TW. Negative regulation of PKB/Akt-dependent cell survival by the tumor suppressor PTEN. Cell. 1998;95:29–39. doi: 10.1016/s0092-8674(00)81780-8. [DOI] [PubMed] [Google Scholar]
- Stambolic V, Tsao MS, Macpherson D, Suzuki A, Chapman WB, Mak TW. High incidence of breast and endometrial neoplasia resembling human Cowden syndrome in pten+/− mice. Cancer Res. 2000;60:3605–3611. [PubMed] [Google Scholar]
- Stambolic V, MacPherson D, Sas D, Lin Y, Snow B, Jang Y, Benchimol S, Mak TW. Regulation of PTEN transcription by p53. Mol Cell. 2001;8:317–325. doi: 10.1016/s1097-2765(01)00323-9. [DOI] [PubMed] [Google Scholar]
- Steck PA, Pershouse MA, Jasser SA, Yung WK, Lin H, Ligon AH, Langford LA, Baumgard ML, Hattier T, Davis T, et al. Identification of a candidate tumour suppressor gene, MMAC1, at chromosome 10q23.3 that is mutated in multiple advanced cancers. Nat Genet. 1997;15:356–362. doi: 10.1038/ng0497-356. [DOI] [PubMed] [Google Scholar]
- Su X, Chakravarti D, Cho MS, Liu L, Gi YJ, Lin YL, Leung ML, El-Naggar A, Creighton CJ, Suraokar MB, et al. TAp63 suppresses metastasis through coordinate regulation of Dicer and miRNAs. Nature. 2010;467:986–990. doi: 10.1038/nature09459. [DOI] [PMC free article] [PubMed] [Google Scholar]
- Subramanian A, Tamayo P, Mootha VK, Mukherjee S, Ebert BL, Gillette MA, Paulovich A, Pomeroy SL, Golub TR, Lander ES, et al. Gene set enrichment analysis: a knowledge-based approach for interpreting genome-wide expression profiles. Proc Natl Acad Sci USA. 2005;102:15545–15550. doi: 10.1073/pnas.0506580102. [DOI] [PMC free article] [PubMed] [Google Scholar]
- Suzuki A, de la Pompa JL, Stambolic V, Elia AJ, Sasaki T, del Barco Barrantes I, Ho A, Wakeham A, Itie A, Khoo W, et al. High cancer susceptibility and embryonic lethality associated with mutation of the PTEN tumor suppressor gene in mice. Curr Biol. 1998;8:1169–1178. doi: 10.1016/s0960-9822(07)00488-5. [DOI] [PubMed] [Google Scholar]
- Tan EY, Yan M, Campo L, Han C, Takano E, Turley H, Candiloro I, Pezzella F, Gatter KC, Millar EK, et al. The key hypoxia regulated gene CAIX is upregulated in basal-like breast tumours and is associated with resistance to chemotherapy. Br J Cancer. 2009;100:405–411. doi: 10.1038/sj.bjc.6604844. [DOI] [PMC free article] [PubMed] [Google Scholar]
- Taube JH, Herschkowitz JI, Komurov K, Zhou AY, Gupta S, Yang J, Hartwell K, Onder TT, Gupta PB, Evans KW, et al. Core epithelial-to-mesenchymal transition interactome gene-expression signature is associated with claudin-low and metaplastic breast cancer subtypes. Proc Natl Acad Sci USA. 2010;107:15449–15454. doi: 10.1073/pnas.1004900107. [DOI] [PMC free article] [PubMed] [Google Scholar]
- Timmerman LA, Holton T, Yuneva M, Louie RJ, Padro M, Daemen A, Hu M, Chan DA, Ethier SP, van‘t Veer LJ, et al. Glutamine sensitivity analysis identifies the xCT antiporter as a common triple-negative breast tumor therapeutic target. Cancer Cell. 2013;24:450–465. doi: 10.1016/j.ccr.2013.08.020. [DOI] [PMC free article] [PubMed] [Google Scholar]
- Tsai JH, Donaher JL, Murphy DA, Chau S, Yang J. Spatiotemporal regulation of epithelial-mesenchymal transition is essential for squamous cell carcinoma metastasis. Cancer Cell. 2012;22:725–736. doi: 10.1016/j.ccr.2012.09.022. [DOI] [PMC free article] [PubMed] [Google Scholar]
- Vivanco I, Palaskas N, Tran C, Finn SP, Getz G, Kennedy NJ, Jiao J, Rose J, Xie W, Loda M, et al. Identification of the JNK signaling pathway as a functional target of the tumor suppressor PTEN. Cancer Cell. 2007;11:555–569. doi: 10.1016/j.ccr.2007.04.021. [DOI] [PubMed] [Google Scholar]
- Wagner KU, Boulanger CA, Henry MD, Sgagias M, Hennighausen L, Smith GH. An adjunct mammary epithelial cell population in parous females: its role in functional adaptation and tissue renewal. Development. 2002;129:1377–1386. doi: 10.1242/dev.129.6.1377. [DOI] [PubMed] [Google Scholar]
- Wang ZA, Mitrofanova A, Bergren SK, Abate-Shen C, Cardiff RD, Califano A, Shen MM. Lineage analysis of basal epithelial cells reveals their unexpected plasticity and supports a cell-of-origin model for prostate cancer heterogeneity. Nat Cell Biol. 2013;15:274–283. doi: 10.1038/ncb2697. [DOI] [PMC free article] [PubMed] [Google Scholar]
- Wu H, Zhu H, Liu DX, Niu TK, Ren X, Patel R, Hait WN, Yang JM. Silencing of elongation factor-2 kinase potentiates the effect of 2-deoxy-D-glucose against human glioma cells through blunting of autophagy. Cancer Res. 2009;69:2453–2460. doi: 10.1158/0008-5472.CAN-08-2872. [DOI] [PMC free article] [PubMed] [Google Scholar]
- Yuan TL, Cantley LC. PI3K pathway alterations in cancer: variations on a theme. Oncogene. 2008;27:5497–5510. doi: 10.1038/onc.2008.245. [DOI] [PMC free article] [PubMed] [Google Scholar]
- Zhang Y, Wu Y, Cheng Y, Zhao Z, Tashiro S, Onodera S, Ikejima T. Fas-mediated autophagy requires JNK activation in HeLa cells. Biochem Biophys Res Commun. 2008;377:1205–1210. doi: 10.1016/j.bbrc.2008.10.151. [DOI] [PubMed] [Google Scholar]
Associated Data
This section collects any data citations, data availability statements, or supplementary materials included in this article.
Supplementary Materials
Supplementary Information
Supplementary Table S1
Review Process File