

Abstract
To determine if electrical impedance myography (EIM) technique can still be used safely to monitor muscle in cases of severe dehydration, we measured the electrical impedance at 1 kHz - 1 MHz (37 frequencies) of n=8 wild type mice during 48 h of fluid deprivation and compared to the results of n=8 mice that were provided with water ad libitum. Based on the relative change in the R0 (8% p=0.59) parameter from the Cole impedance model, there is a non-significant change in regard to the muscle extracellular fluid when compared to the relative change of body weight and body water loss (19.6% p<0.0001 and 26.1% p<0.0001 respectively). The negligible changes of the phase at 50 kHz (1% p=0.88) confirm both the muscle fibers structural integrity and viability remained intact for that period of time. Accordingly, EIM can still be used to determine the status of muscle even during profound dehydration.
I. Introduction
Electrical impedance myography (EIM) [1] is a useful technology not only for the primary assessment of a variety of neuromuscular conditions, e.g. spinal muscular atrophy [2], but also as a biomarker of drug efficacy for use in clinical therapeutic trials, such as in amyotrophic lateral sclerosis (ALS) [3]. In addition, early data in humans [4] as well as in rat [5] and mouse models [6] suggest that EIM technology has the prospect of being useful for evaluating the effects of exercise on muscle, including training and detraining.
Like all forms of electrical impedance testing, EIM is potentially susceptible to being altered by a variety of factors, including hydration status [7]. Many of the differences between hydrated and dehydrated states can be attributed (1) to alterations in intravascular (mainly venous) volume and (2) to the concentration of intra- and extra-cellular fluids [8]. The first attempt to correlate body composition parameters to (single-frequency) body impedance measurement was reported in [9]. In that work, Hoffer and co-workers related the Total Body Water (TBW) to the total body impedance. Body impedance analysis (BIA) was proposed later as a method to estimate also the Fat-Free Mass (FFM) content [10]. The extension of BIA was further examined to estimate Extracellular Water (ECW) [11], [12]. There remain intensive efforts to estimate whole body fluid content using electrical impedance measurements. How much the water content of muscle itself, however, plays into these observed changes is unknown.
Since EIM is used to evaluate neuromuscular disease, variations in fluid status may have untoward confounding effects on the acquired EIM data. This concern could become especially relevant in situations where the disease itself is associated with changes in TBW. For example, patients with advanced ALS, a condition that markedly alters muscle impedance values due to profound myocyte atrophy, tend to become dehydrated, likely through reduced oral water intake and a modestly increased systemic metabolic rate [13]. Similarly, in healthy individuals who have undertaken vigorous prolonged exercise, such as marathon running, it conceivable that impedance changes due to muscle fiber injury might be obscured by simultaneous dehydration.
In this study, we sought to evaluate the impact of 48 hours of fluid restriction on the electrical impedance characteristics of muscle in wild type mice. Our main goal was to determine whether EIM is less impacted by fluid restriction than standard measures of BIA, in which fluid status has a decidedly powerful effect on the obtained data.
II. Materials and methods
A. Animals
Eight male and eight female (n=16) wild type (C57Bl/6J) mice, obtained from Jackson Laboratories (Bar Harbor, ME), were studied at 22 weeks of age. They were assigned 2 groups: 1) a fluid restriction group and 2) a control group, with 4 males and 4 females in each group. Both groups were also balanced for body mass. All studies were approved by the Beth Israel Deaconess Medical Center Institutional Animal Care and Use Committee.
B. Water deprivation
Eight mice were placed under water deprivation for a period of 48 hours. Standard mouse chow was provided ad libitum. During water deprivation, body weight, level of activity with particular attention to lethargy or inability to move, aggressive behavior, and fur coat appearance were monitored every 12 hours. After 48-hour measurements were obtained (see below) standard drinking water (via a regular bottle) ad libitum was provided and the animals followed for a subsequent 48 hours as they rehydrated. The 8 mice of the control group were provided drinking water and dry food throughout the study.
C. Electrical impedance measurement system
A tetrapolar electrode array made of stainless steel strips placed in parallel were embedded within an acrylic head, with each of the individual strips protruding slightly to help ensure good contact with the skin (see Figure 1). The stainless steel plates were cut into a stepped shape so they could be encased perpendicularly in the stack of acrylic pieces, with their location entirely determined by the location of mating slots in the acrylic pieces. The stainless steel plates also had a zigzag pattern of notches around which a copper wire was wound; the sharp edges of the notches ensured good electrical contact with the copper wire, which connected to the measurement equipment. The stainless steel plates were positioned in the acrylic stack and permanently encased by adhering the acrylic pieces together. Finally, the end of the stainless steel plates that protruded slightly to serve as the contacting portion of the electrode head was filed to remove any burrs or sharp edges. The total footprint of the array was set at 3.95 by 6.85 mm, a dimension based on measurements performed on the hind limbs of multiple adult animals,. The two outer strips (to serve as current-injecting electrodes) were 0.55 mm wide and 3.95 mm long; the two inner strips (to serve as voltage-drop measuring electrodes) were 0.55 mm wide and 2.85 mm long. The strips were 0.55 mm apart (measured from the center of each strip). The head of the device was affixed to a rotatable arm that could be placed squarely over the animals gastrocnemius muscle. The rotatable arm included an embedded plastic disc with angle markers allowing the array to be consistently placed relative to the long axis of the limb. The electrode wires extended through the center and out the top of the rotatable arm where they connected to the EIM Vet1102 system designed by Skulpt Inc (Medford, MA). In addition, a dowel pin extension parallel to the rotatable arm allowed for the addition of weights to ensure consistent contact pressure of the device against the muscle with each measurement [14].
Fig. 1.

The electrode device, showing a rotatable arm used to change the direction of the electrode array; the angle marker and the bar for the removable weights. See text for further details.
D. Data analysis
Comparisons between dehydration and control groups at each certain time were made by Mann-Whitney U test. For all analyzes, significance was taken at p<0.05, two tailed.
III. Measurements
A. Body mass
All animals from 2 groups were weighed prior to any measurement at 0, 12, 24, 36, 48, 72, and 96 hours. Zero time point measurements were performed immediately prior to initiation of fluid restriction.
B. Electrical impedance myography (EIM) measurements
Electrical impedance measurements were performed immediately after each body mass measurement, while the animal was placed under 1% isoflurane anesthesia delivered by nosecone with a heating pad underneath the limb to maintain consistent temperature. After the fur was clipped, a depilatory agent was applied to the skin to remove all remaining fur before first measurement only. Then the skin was cleaned with 0.9% saline solution. The leg was then taped to the measuring surface at an approximately 45 degree angle extending out from the body. To assist in repeat placement of electrodes, a pinpoint tattoo was placed close to the center of the gastrocnemius muscle at a point approximately 2/3 rd of the distance between the midpoint of the lumbar spine and the base of the heel pad of each mouse.
IV. Experimental results and discussion
Note in Figure 2 both fluid-restricted and non-fluid-restricted animals showed major changes from baseline measurement at 12 h likely due to the application of the depilatory agent. We believe that the depilatory agent creates substantial edema in the skin that reduces the absolute values of the impedance data. This alteration is not usually observed when performing EIM in animal models because the data is obtained shortly after the depilatory agent is applied immediately not hours later as is the case here. Generally, additional measurements are not repeated until several days later long after these effects would have resolved.
Fig. 2.
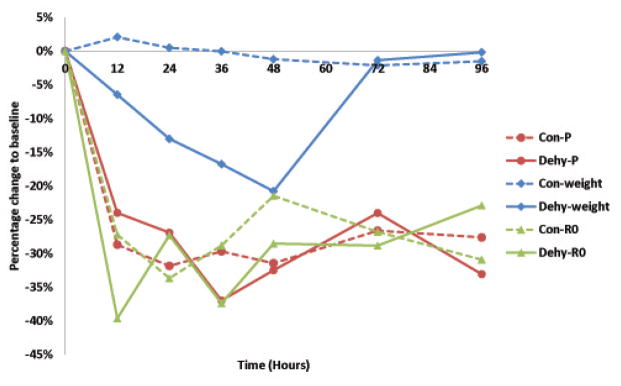
Example of the evolution of the parameters analyzed in one control animal and dehydration animal; phase (P) at 50 kHz, weight and R0 from the Cole impedance model [15], [16]. Note at the end of the period of water deprivation (48 h), relative weight loss is 20% but the relative variations in the value of R0 and phase are similar to the values of the control group. Dashed lines control, solid dehydrated.
Data shown in Figure 3 support that, despite substantial dehydration (~ 26% water loss, Figure 4), R0, an indirect volume measure of the extracellular fluid [17], [7], did not increase significantly at the end of the 48 hour period of dehydration. Moreover, the fact the phase of the electrical impedance did not change significantly (1%, Figure 4) reveals the integrity of the muscle fibers membranes remained intact for the that period of time.
Fig. 3.

Mean value and standard deviation relative changes normalized with respect to the control group so as to remove the effect of the depilatory agent. The recovery period started at 48 hours when drinking water was provided to dehydration group.
Fig. 4.

Comparison of baseline to maximal dehydration at 48 h. Sorted from least (green) to most severe (red), 1% phase at 50 kHz, 8% R0 [15], 19.6% body weight loss and 26.1% body water loss.
Other additional explanations for the moderate changes both in R0 are (1) the experimental placement of the electrodes and (2) the distance between electrodes. Firstly, the electrode apparatus (see Figure 1) used compresses the superficial tissue physically thus ensuring a good electrode-muscle contact while simultaneously compressing any superficial veins. Secondly, note that unlike whole BIA where the two-pair of electrodes are placed in the body separate far apart, EIM are localized measurements where most of the sensing part is confined to the superficial aspects of the muscle [18]. Both explanations together could also contribute to mitigate changes in R0 due to changes in the intravascular volume.
After the 48 h period of dehydration shown in Figure 3, one can see complete weight recovery in 24 h. Overall, the evolution of the parameters analyzed remain constant within the range of uncertainty.
Next, figure 4 is a summary to further emphasize the impact of a short-term dehydration into each of the parameters analyzed, sorted from least (green) to most severe (red). As one can see, the more drastic short-term changes happen in the water and weight loss with a relative change of 26.1% and 19.6% respectively, followed by changes in the value of R0 (8%) and finally the phase at 50 kHz (1%).
Early approaches to EIM [19] actually utilized a segmental BIA-type approach [20] in which current electrodes were placed at a distance from the voltage-drop measuring electrodes. While also providing useful data on neuromuscular status, there were a number of limitations to such an approach, including the fact that talterations could not be attributed to a single muscle under study. Morever, such an approach is likely to be substantially impacted by the amount of intravascular volume since the current measured across the limb will travel throughout the entire limb not just the tissue immediately underlying the electrode array. As EIM is now applied, in which the current electrodes are in close-proximity to the voltage-measuring electrodes, electrical current remains confined predominantly to the superficial regions of the muscle [18] and thus is relatively unlikely to be influenced by the intravascular volume status.
The absence of an association between EIM data and substantial fluid volume loss, however, should not be interpreted as meaning that fluid volume status has no effect on EIM data. In point of fact, fluid overload (e.g., edema) would still be anticipated to have marked alterations on the measured impedance signature [21]. Tissue edema can be caused directly by muscle fiber breakdown or inflammation and thus the identification of muscle edema can assist in neuromuscular diagnosis. However such alterations may be an accompaniment to other non-neuromuscular conditions, such as renal or congestive heart failure, and thus potentially obscuring unrelated primary muscle alterations.
V. Conclusions
Our findings reveal that electrical impedance myography (EIM), unlike standard body impedance analysis (BIA), is not significantly impacted by even severe dehydration and thus can appropriately be applied to individuals with substantial fluid volume loss. This finding helps widen the potential application of EIM to measurement of muscle conditions where simultaneous dehydration is anticipated.
Acknowledgments
This work was supported by grant R01NS055099 to the Beth Israel Deaconess Medical Center General Clinical Research Center from the National Institute of Health.
References
- 1.Rutkove SB. Electrical impedance myography: Background, current state, and future directions. Muscle & nerve. 2009 Dec;40(6):936–46. doi: 10.1002/mus.21362. [DOI] [PMC free article] [PubMed] [Google Scholar]
- 2.Rutkove SB, Shefner JM, Gregas M, Butler H, Caracciolo J, Lin C, Fogerson PM, Mongiovi P, Darras BT. Characterizing spinal muscular atrophy with electrical impedance myography. Muscle & nerve. 2010 Dec;42(6):915–21. doi: 10.1002/mus.21784. [DOI] [PubMed] [Google Scholar]
- 3.Rutkove SB, Caress JB, Cartwright MS, Burns TM, Warder J, David WS, Goyal N, Maragakis NJ, Clawson L, Benatar M, Usher S, Sharma KR, Gautam S, Narayanaswami P, Raynor EM, Watson ML, Shefner JM. Electrical impedance myography as a biomarker to assess ALS progression. Amyotrophic lateral sclerosis: official publication of the World Federation of Neurology Research Group on Motor Neuron Diseases. 2012 Sep;13(5):439–45. doi: 10.3109/17482968.2012.688837. [DOI] [PMC free article] [PubMed] [Google Scholar]
- 4.Tarulli AW, Duggal N, Esper GJ, Garmirian LP, Fogerson PM, Lin CH, Rutkove SB. Electrical impedance myography in the assessment of disuse atrophy. Archives of physical medicine and rehabilitation. 2009 Oct;90(10):1806–10. doi: 10.1016/j.apmr.2009.04.007. [DOI] [PMC free article] [PubMed] [Google Scholar]
- 5.Li J, Spieker AJ, Rosen GD, Rutkove SB. Electrical impedance alterations in the rat hind limb with unloading. Journal of musculoskeletal & neuronal interactions. 2013 Mar;13(1):37–44. [PMC free article] [PubMed] [Google Scholar]
- 6.Sung M, Li J, Spieker AJ, Spatz J, Ellman R, Ferguson VL, Bateman TA, Rosen GD, Bouxsein M, Rutkove SB. Spaceflight and hind limb unloading induce similar changes in electrical impedance characteristics of mouse gastrocnemius muscle. Journal of musculoskeletal & neuronal interactions. 2013 Dec;13(4):405–11. [PMC free article] [PubMed] [Google Scholar]
- 7.Jaffrin MY, Morel H. Body fluid volumes measurements by impedance: A review of bioimpedance spectroscopy (BIS) and bioimpedance analysis (BIA) methods. Medical engineering & physics. 2008 Dec;30(10):1257–69. doi: 10.1016/j.medengphy.2008.06.009. [DOI] [PubMed] [Google Scholar]
- 8.Kanai H, Sakamoto K, Haeno M. Electrical measurement of fluid distribution in human legs: estimation of extra- and intra-cellular fluid volume. The Journal of microwave power. 1983 Sep;18(3):233–43. doi: 10.1080/16070658.1983.11689328. [DOI] [PubMed] [Google Scholar]
- 9.Hoffer EC, Meador CK, Simpson DC. Correlation of whole-body impedance with total body water volume. Journal of applied physiology. 1969 Oct;27(4):531–4. doi: 10.1152/jappl.1969.27.4.531. [DOI] [PubMed] [Google Scholar]
- 10.Lukaski HC, Johnson PE, Bolonchuk WW, Lykken GI. Assessment of fat-free mass using bioelectrical impedance measurements of the human body. The American journal of clinical nutrition. 1985 Apr;41(4):810–7. doi: 10.1093/ajcn/41.4.810. [DOI] [PubMed] [Google Scholar]
- 11.Lukaski HC, Bolonchuk WW. Estimation of body fluid volumes using tetrapolar bioelectrical impedance measurements. Aviation, space, and environmental medicine. 1988 Dec;59(12):1163–9. [PubMed] [Google Scholar]
- 12.Kotler DP, Burastero S, Wang J, Pierson RN. Prediction of body cell mass, fat-free mass, and total body water with bioelectrical impedance analysis: effects of race, sex, and disease. The American journal of clinical nutrition. 1996 Sep;64(3 Suppl):489S–497S. doi: 10.1093/ajcn/64.3.489S. [DOI] [PubMed] [Google Scholar]
- 13.Miller RG, Jackson CE, Kasarskis EJ, England JD, Forshew D, Johnston W, Kalra S, Katz JS, Mitsumoto H, Rosenfeld J, Shoe-smith C, Strong MJ, Woolley SC. Practice parameter update: the care of the patient with amyotrophic lateral sclerosis: multidisciplinary care, symptom management, and cognitive/behavioral impairment (an evidence-based review): report of the Quality Standards Subcommittee of the American. Neurology. 2009 Oct;73(15):1227–33. doi: 10.1212/WNL.0b013e3181bc01a4. [DOI] [PMC free article] [PubMed] [Google Scholar]
- 14.Li J, Staats WL, Spieker A, Sung M, Rutkove SB. A technique for performing electrical impedance myography in the mouse hind limb: data in normal and ALS SOD1 G93A animals. PloS one. 2012 Jan;7(9):e45004. doi: 10.1371/journal.pone.0045004. [DOI] [PMC free article] [PubMed] [Google Scholar]
- 15.Cole KS, Cole RH. Dispersion and Absorption in Dielectrics I. Alternating Current Characteristics. The Journal of Chemical Physics. 1941;9(4):341. [Google Scholar]
- 16.Sanchez B, Bandarenka AS, Vandersteen G, Schoukens J, Bragos R. Novel approach of processing electrical bioimpedance data using differential impedance analysis. Medical engineering & physics. 2013 Sep;35(9):1349–57. doi: 10.1016/j.medengphy.2013.03.006. [DOI] [PubMed] [Google Scholar]
- 17.Cornish BH, Thomas BJ, Ward LC. Improved prediction of extracellular and total body water using impedance loci generated by multiple frequency bioelectrical impedance analysis. Physics in medicine and biology. 1993 Mar;38(3):337–46. doi: 10.1088/0031-9155/38/3/001. [DOI] [PubMed] [Google Scholar]
- 18.Jafarpoor M, Li J, White JK, Rutkove SB. Optimizing electrode configuration for electrical impedance measurements of muscle via the finite element method. IEEE transactions on biomedical engineering. 2013 May;60(5):1446–52. doi: 10.1109/TBME.2012.2237030. [DOI] [PMC free article] [PubMed] [Google Scholar]
- 19.Rutkove SB, Aaron R, Shiffman CA. Localized bioimpedance analysis in the evaluation of neuromuscular disease. Muscle & nerve. 2002 Mar;25(3):390–7. doi: 10.1002/mus.10048. [DOI] [PubMed] [Google Scholar]
- 20.Alizadehkhaiyat O, Hawkes DH, Kemp GJ, Howard A, Frostick SP. Muscle strength and its relationship with skeletal muscle mass indices as determined by segmental bio-impedance analysis. European journal of applied physiology. 2014 Jan;114(1):177–85. doi: 10.1007/s00421-013-2764-y. [DOI] [PubMed] [Google Scholar]
- 21.Ward L, Cornish BH. A method and device for measuring tissue oedema. 2000/79255 A1. WO. 2000 Nov;