Abstract
Evaluation of a potential risk of metabolic drug–drug interactions (DDI) is of high importance in the clinical setting. In this study, a physiologically based pharmacokinetic (PBPK) model was developed for oxycodone and its two primary metabolites, oxymorphone and noroxycodone, in order to assess different DDI scenarios using published in vitro and in vivo data. Once developed and refined, the model was able to simulate pharmacokinetics of the three compounds and the DDI extent in case of coadministration with an inhibitor, as well as the oxymorphone concentration variation between CYP2D6 extensive metabolizers (EM) and poor metabolizers (PM). The reliability of the model was tested against published clinical studies monitoring different inhibitors and dose regimens, and all predicted area under the concentration–time curve (AUC) ratios were within the twofold acceptance range. This approach represents a strategy to evaluate the impact of coadministration of different CYP inhibitors using mechanistic incorporation of drug-dependent and system-dependent available in vitro and in vivo data.
Metabolic drug–drug interactions (DDI) can lead to serious toxicological consequences in patients. Important drug interactions are caused by inhibition of cytochrome P450 (CYP) metabolic enzymes or drug transporters. Oxycodone is a semisynthetic μ-opioid receptor agonist, used for the treatment of moderate to severe pain. It can be administered orally, intravenously, or rectally. It has a significantly higher bioavailability (between 42 and 87%) than morphine with an estimated bioavailability range of 22–48%.1 The complete metabolism of oxycodone has not yet been defined. It has been reported that oxycodone is extensively metabolized in the liver and less than 10% of the dose is excreted unchanged in urine.2 CYP3A4 and CYP2D6 are the main phase I enzymes involved in its metabolism. CYP3A4 catalyzes the N-demethylation of oxycodone to noroxycodone, the most abundant metabolite. CYP2D6 catalyzes the O-demethylation of oxycodone to oxymorphone, which is 14 times more potent than the parent compound and its affinity for the μ-opioid receptor three to five times higher than morphine.3 Both oxymorphone and noroxycodone are transformed to another possibly active metabolite, noroxymorphone, by CYP3A4 and CYP2D6, respectively. Other step-down metabolites such as glucuronides, oxycodone-oxide, α- and β-oxycodol, and α- and β-oxymorphol have also been proposed.4,5
The involvement of different CYPs in the metabolism, elimination, and bioactivation of oxycodone makes the treatment sensitive to clinically meaningful DDI leading to altered analgesic or adverse effects profile. Samer et al.6 reported that a single 100 mg quinidine dose decreased subjective pain threshold in 10 healthy volunteers and higher pharmacodynamic (PD) effects (analgesia and sedation) were observed after CYP3A blockade by a single dose 400 mg ketoconazole. In another study (12 healthy volunteers), a 4-day treatment with ritonavir 100 mg and lopinavir/ritonavir 400/100 mg increased the area under the concentration–time curve (AUC) of 10 mg oral oxycodone by 3.0- and 2.6-fold, respectively. Lopinavir/ritonavir treatment increased the AUC of oxymorphone by about twofold and both treatments led to higher self-reported opioid effects.7 On the other hand, induction of CYP3A by rifampicin has been studied by Nienminen et al. where rifampicin 600 mg was administered to 12 healthy volunteers for 7 days. The mean AUC values of both oxycodone and oxymorphone were decreased by ~86 and 90%. Rifampicin raised the plasma metabolite/parent ratio for noroxycodone and noroxymorphone. Concordantly, less drowsiness, drug effect and performance impairment were reported in the rifampicin group.8
To better understand the contribution of each enzyme in oxycodone metabolism and to estimate the magnitude of potential pharmacokinetic (PK) interactions, a physiologically based pharmacokinetic (PBPK) model was developed during this study for oxycodone and its two main primary metabolites, oxymorphone and noroxycodone, using Simcyp software. PBPK models divide the body into physiologically meaningful compartments in which drug-dependent (e.g., physico-chemical properties), body-dependent (e.g., physiology, ethnicity, gender, and genetics), and trial-dependent (e.g., dose, route and frequency of administration, concomitant drugs) components are considered and interact with each other in a dynamic way. Models were initially developed using available published data and subsequently refined by top-down approach using a clinical trial.9 Ultimately, the reliability of the model was tested against four other clinical studies monitoring different inhibitors and dose regimens. The combination of “bottom-up” (in vitro) with top-down (clinical) approaches to give a “middle-out” strategy with adequate independent verification has been previously discussed.10
Results
PBPK model building and refining in healthy volunteers
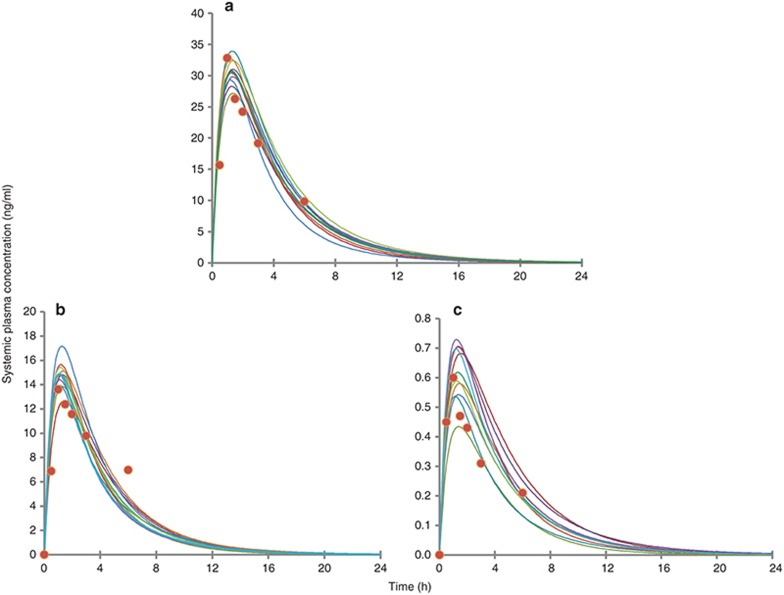
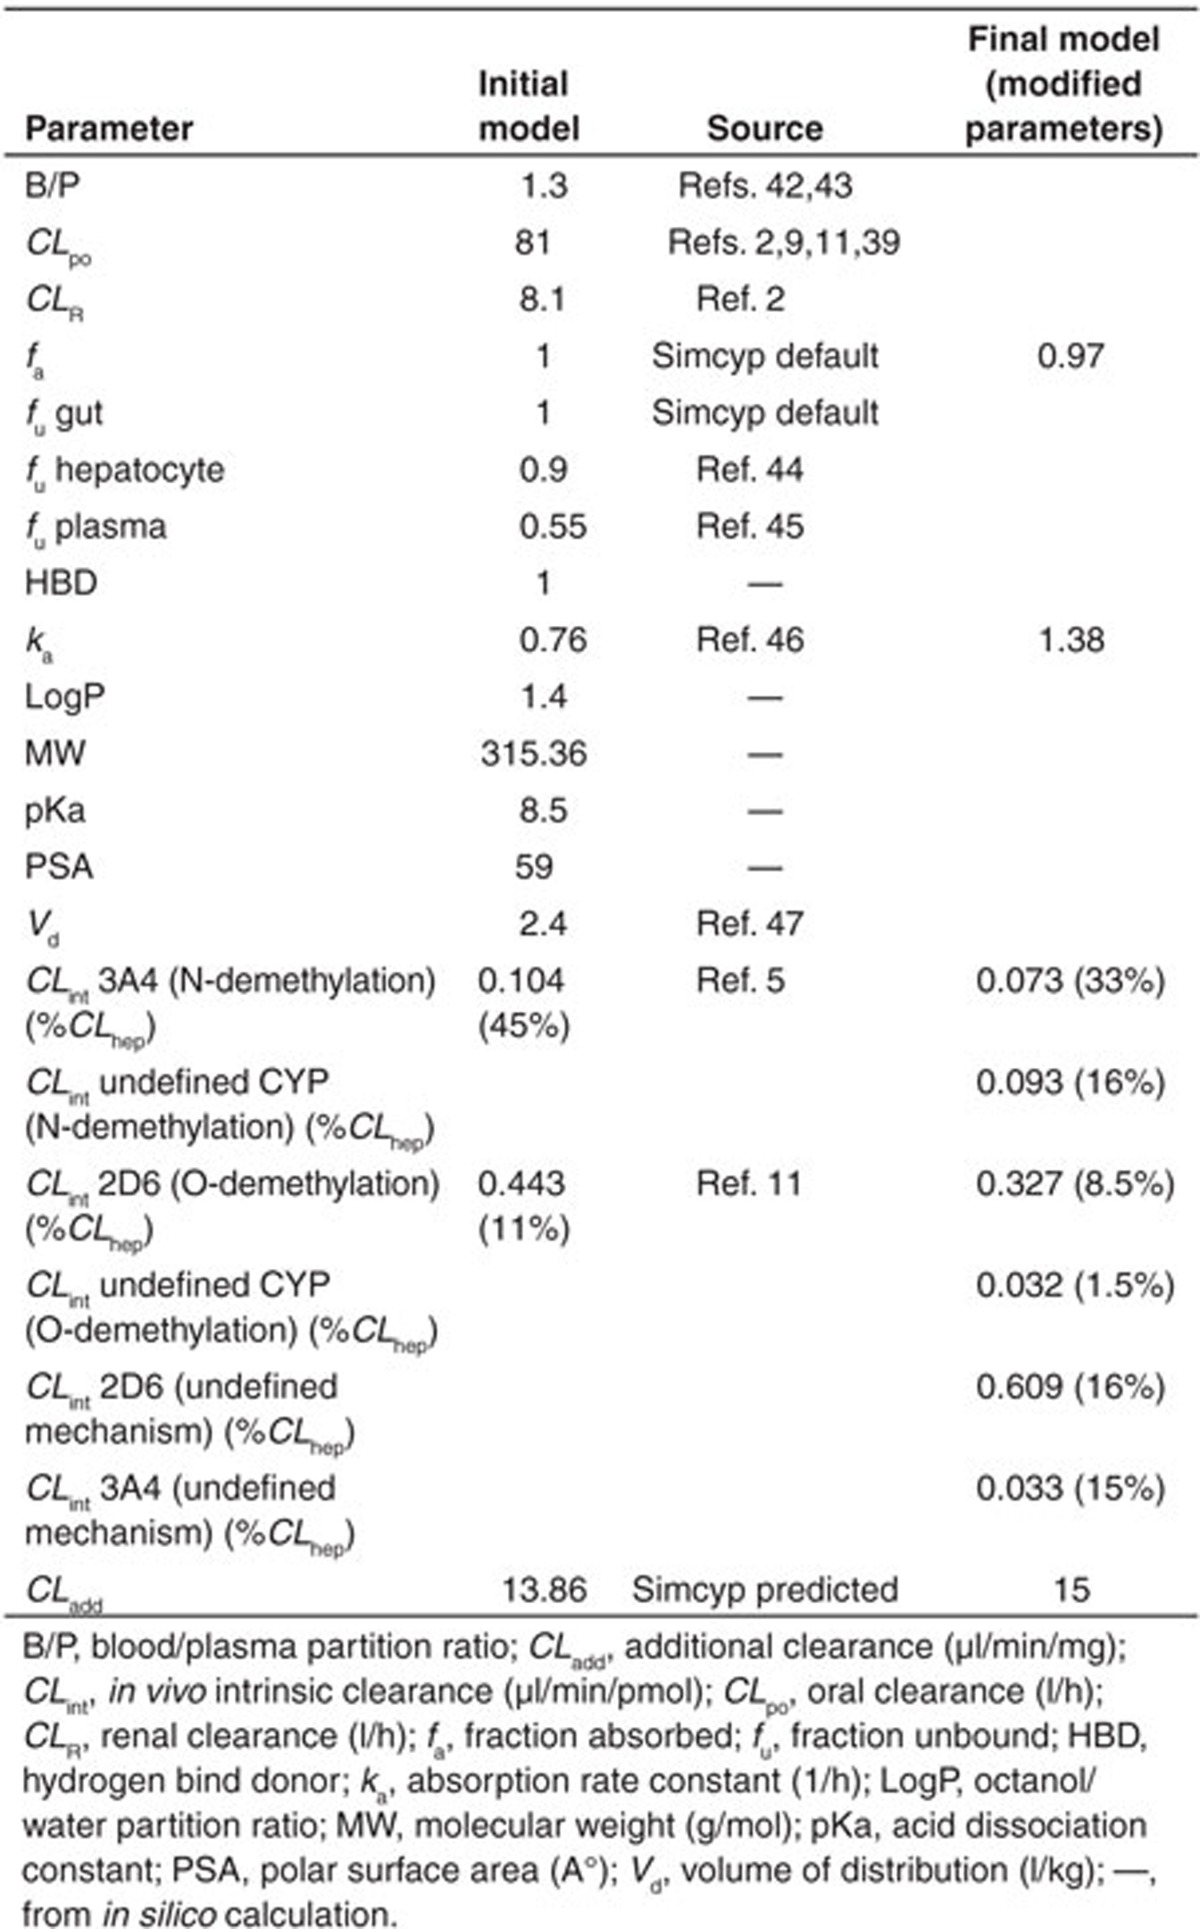
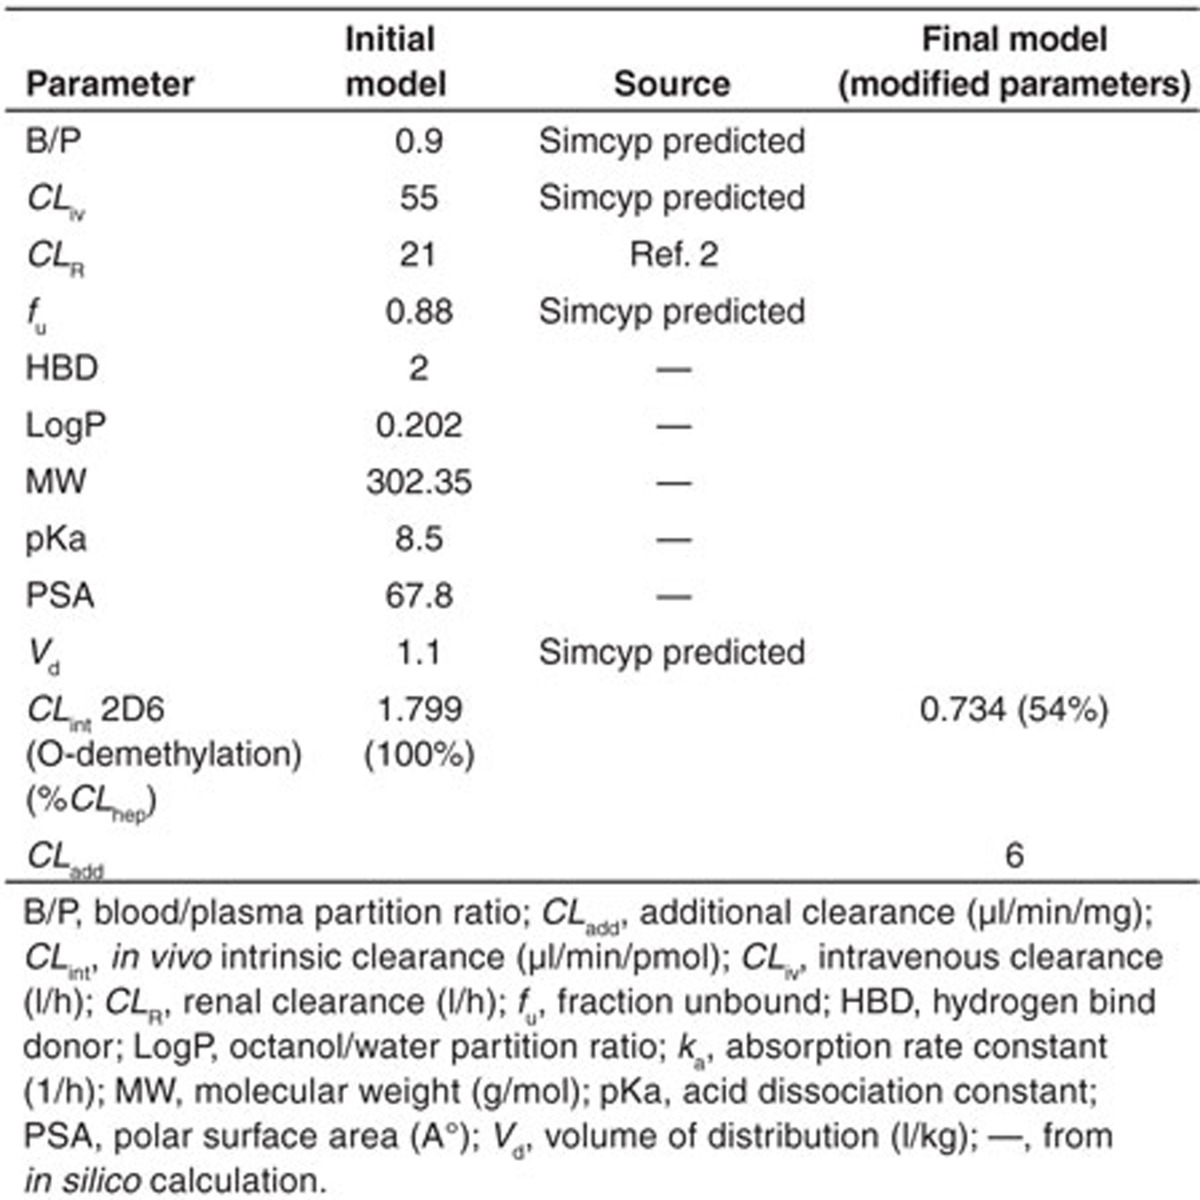
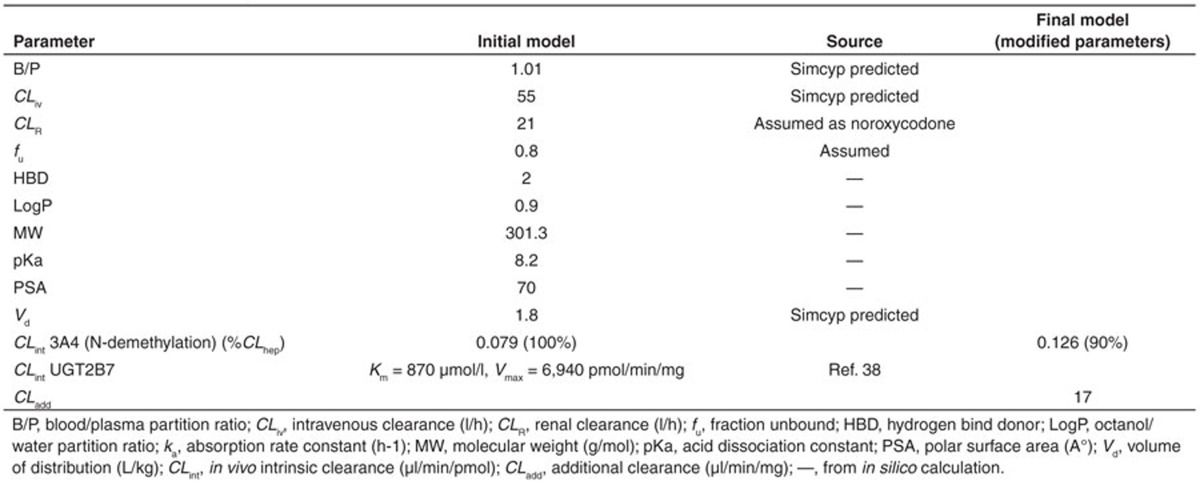
Simulated concentration–time profiles for oxycodone, oxymorphone, and noroxycodone after a single 0.2 mg/kg oral dose of oxycodone, using the final refined parameters provided a consistent representation of the observed data by Samer et al. (Figure 1). In the initial model, the N-demethylation of oxycodone to noroxycodone via CYP3A4 was considered 45% and the O-demethylation of oxycodone to oxymorphone via CYP2D6 was considered 11% as in previously published data.5,11 During the model optimization phase, it was noticed that both interactions with CYP3A inhibitor and CYP2D6 phenotype impact were overestimated. Therefore, the N-demethylation of oxycodone to noroxycodone via CYP3A4 was reduced to 33% and O-demethylation of oxycodone to oxymorphone via CYP2D6 was decreased to 8.5% (for a total O-demethylation of 10%). Implication of new pathways has been proposed for three compounds and remaining clearances were assigned to undefined pathways. Initial and final parameters for oxycodone, noroxycodone, and oxymorphone models are presented in Tables 1, 2, and 3, respectively.
Figure 1.
Observed and simulated concentration–time profiles of oxycodone (a), noroxycodone (b), and oxymorphone (c) following a 0.2 mg/kg single-dose oxycodone in 10 trials of 10 healthy male volunteers. Circles represent mean concentrations observed by Samer et al., and the solid lines represent mean concentration profile for each simulated trial using refined parameters.
Table 1. Input parameters for oxycodone model.
Table 2. Input parameters for noroxycodone model.
Table 3. Input parameters for oxymorphone model.
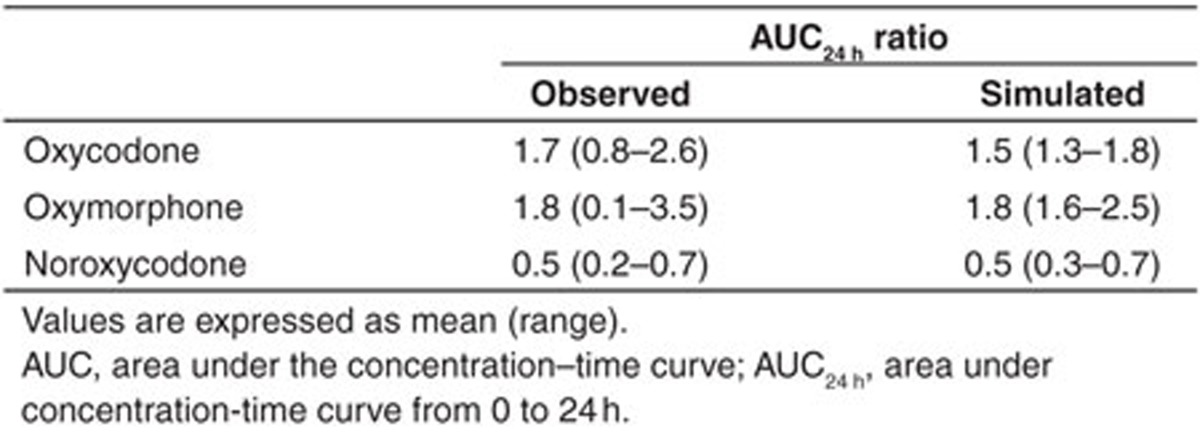
The simulated mean AUC24 h of oxymorphone in CYP2D6 poor metabolizers (PMs) and extensive metabolizers (EMs) were in close agreement with observed values in the Samer et al. study, namely 31 vs. 44 ng⋅min/ml and 229 vs. 268 ng⋅min/ml, respectively. Accordingly, the simulated ratio of oxymorphone AUC in PM vs. EM was 0.13, which is in close agreement with the ratio observed in the clinical trial by Samer et al. (0.14) and Stamer et al. (0.12).9,12 The impact of cotreatment with ketoconazole observed by Samer et al. was used to refine the fraction of dose of the drug metabolized by CYP3A4 (fm-3A4). Predicted AUC ratios were 90, 100, and 100% of the observed values for oxycodone, oxymorphone, and noroxycodone, respectively. Results of these simulations are presented in Table 4.
Table 4. Model refining by quantitative prediction of drug–drug interactions: clinical and simulated AUC ratios after coadministration with ketoconazole 400 mg single dose, derived from clinical trial by Samer et al.9.
Model testing and validation
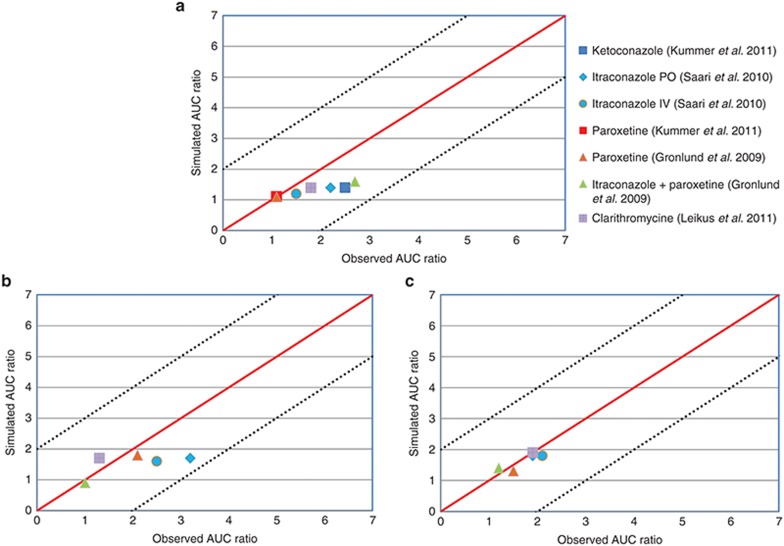
The PBPK models for oxycodone, noroxycodone, and oxymorphone were developed from in vitro and in vivo published parameters and each enzyme’s CLint and fm were refined based on the ketoconazole impact on the plasma concentration of compounds as well as the oxymorphone concentration in PMs and EMs derived from the reference clinical trial. In order to evaluate the DDI prediction validity of the created models, they were tested against seven CYP450-mediated DDI scenarios and results were compared with published clinical observations. The impact of CYP3A inhibition by ketoconazole, itraconazole, and clarithromycine and CYP2D6 inhibition by paroxetine were successfully simulated for oxycodone and its two metabolites (Figure 2). Concerning oxycodone, observed AUC ratio/simulated AUC ratio following ketoconazole, clarithromycine, intravenous and oral itraconazole, and combination of itraconazole and paroxetine were 1.8, 1.3, 1.2, 1.6, and 1.7, respectively. With regards to 2D6 inhibition, clinical AUC ratio/simulated AUC ratio following paroxetine administration alone were 0.9 and 1. Regarding noroxycodone, clinical/simulated AUC ratio following oral and intravenous itraconazole, clarithromycine, and paroxetine administration were 1.0, 1.2, 1.0, and 1.1. This ratio following combination of both itraconazole and paroxetine was 0.9 for noroxycodone. With respect to oxymorphone, clinical AUC ratio/simulated AUC ratio after CYP3A4 blockade following oral and intravenous administration of itraconazole was 1.8 and 1.6, respectively. The simulation involving mechanism-based CYP3A4 inhibition by clarithromycine led to a clinical AUC ratio/simulated AUC ratio of 0.8. On the other hand, simulated CYP2D6 inhibition by paroxetine and combination of paroxetine and itraconazole led to clinical AUC ratio/simulated AUC ratio of 1.2 and 1.1, respectively. Among tested clinical studies, the phenotype of participants was not defined in the Grönlund et al. study. In the Leikus et al. study, CYP2D6 PM, ultra-rapid metabolizers, and EM participants accounted for 10, 5, and 85% of included subjects, respectively, but the possible association of CYP2D6 phenotype and oxycodone PK was not evaluated. In the Kummer et al. study, all subjects were CYP2D6 extensive metabolizers. With regards to Saari et al., CYP2D6 PM, ultra-rapid metabolizers, EM, and intermediate metabolizer participants accounted for 9, 8, 58, and 25% of all participants, respectively. We noticed that CYP3A inhibition by itraconazole appeared to have a more important impact on oxycodone and oxymorphone pharmacokinetics in PM as compared to EM subjects (with a simulated AUC ratio of 2.2 in PMs vs. 1.7 in EMs for oxymorphone, and 1.6 in PMs vs. 1.3 in EMs for oxycodone), which was in agreement with the observations by Saari et al.13
Figure 2.
Summary of prediction success (with respect to area under the concentration–time curve ratios) of oxycodone (a), oxymorphone (b), and noroxycodone (c) after coadministration with ketoconazole, paroxetine, itraconazole, clarithromycine, and association of paroxetine and itraconazole using Simcyp default models of each inhibitor. The solid line and dashed lines represent the line of unity and twofold margins, respectively.
Discussion
PBPK models can be developed to predict drug’s plasma concentration–time profile and to predict potential DDI by integrating available in vitro and in vivo data and mechanistic incorporation of both drug-dependent and system-dependent parameters. Reliability of a model depends closely to that of input parameters. Oxycodone is mainly metabolized to noroxycodone by CYP3A4 (via N-demethylation) and to oxymorphone by CYP2D6 (via O-demethylation). Both metabolites are further transformed to noroxymorphone by CYP2D6 and CYP3A4, respectively. Therefore, the concomitant use of oxycodone and potent CYP2D6 or CYP3A4 inhibitors should be considered.
In vitro, Lalovic et al.5 reported that O-demethylation accounted for up to 11% of oxycodone oxidative metabolism (oxymorphone, α- and β-oxymorphol) and that N-demethylation of oxycodone to noroxycodone represented the major oxidative metabolic pathway. In another study conducted on healthy human subjects, the urinary metabolites of oxycodone derived from N-demethylation (noroxycodone and noroxymorphone including α- and β-noroxycodol) accounted for 45% of the dose.11 Thus, in this study, the initial PBPK model was developed based on 11% 2D6-mediated O-demethylation and 45% 3A4-mediated N-demethylation. Models were then adjusted to accurately predict the interaction between oxycodone and ketoconazole, as well as the plasma concentration of oxymorphone in PMs and EMs in 10 healthy male subjects using a published clinical trial by Samer et al.9 During the model optimization phase, it was noticed that interactions were overestimated when only CYP3A4 and CYP2D6 were considered for metabolism of oxycodone. Since fm value can have an important role in the magnitude of DDI predictions, a top-down fitting was applied to optimize the implication of CYP3A4 in oxycodone metabolism as well as its two primary metabolites. The use of in vivo interaction data to improve enzyme contribution in a probe drug metabolism can be applied as a supporting strategy to perform robust DDI predictions.14 The combination of “bottom-up” (in vitro) and “top-down” (clinical) approaches is widely used in PBPK modeling since it gives the opportunity to use a maximum of available in vitro/in vivo information. It is of particular value in certain settings such as pediatrics or pregnancy predictions.10,15,16,17
In the refined model, the N-demethylation of oxycodone to noroxycodone via CYP3A4 was 33% (for a total N-demethylation of 50%) and O-demethylation of oxycodone to oxymorphone via CYP2D6 was 8.5% (for a total O-demethylation of 10%). In an in vitro assay by Lalovic et al.,5 involvement of at least two enzymes (such as CYP2D6 and CYP2C19) in the O-demethylation of oxycodone to oxymorphone was suggested. The isoenzyme CYP2C19 was also proposed by Moore et al.4 in healthy subjects. On the other hand, the in vitro study by Lalovic et al.5 suggested the possibility of involvement of a non-CYP3A component in N-demethylation of oxycodone to noroxycodone at higher substrate concentrations. Concordantly, Moore et al.4 proposed various CYP isoenzymes such as CYP1A2, CYP2B6, CYP2C9, or CYP2C19 for formation of noroxycodone. Thus N-demethylation of oxycodone to noroxycodone by an undefined CYP was proposed in the metabolic schema.
Final models were ultimately tested against published clinical studies where oxycodone was coadministered with CYP2D6 inhibitor paroxetine or CYP3A inhibitors ketoconazole, itraconazole, clarithromycine, or combination of two inhibitors. Following ketoconazole 200 mg twice a day, the simulated AUC ratio of oxycodone was 44% smaller than the clinical observation, whereas a close value was predicted with ketoconazole 400 mg once a day in the refining step. One possible explanation can be the persistent inhibition of CYP3A4 by ketoconazole in enterocytes. This phenomenon previously described by Gibbs et al.18 may have an amplified effect after multiple dosing of ketoconazole as in the tested study where 200 mg was administered once a day for 3 days. On the other hand, the clinical AUC ratio of oxycodone after itraconazole treatment was higher following oral administration as compared to intravenous administration suggesting an intestinal P-glycoprotein (P-gp) inhibition by itraconazole leading to a higher bioavailability of oxycodone.19,20,21 Controversial results have been reported concerning oxycodone being a substrate of P-gp. Boström et al.22 reported that oxycodone was not a P-gp substrate in rats, but two other studies suggested the implication of the latter efflux transporter in the PK of oxycodone.23,24
An approximate 40% underestimation of oxymorphone AUC ratio was observed after itraconazole and ketoconazole treatment. A possible reason is that both inhibitors are reported to inhibit UDP-glucuronosyltransferase (UGT) enzymes.25,26,27,28,29 However, the published Ki values for the latter inhibitors represent a large interlaboratory variability, and up to 100-fold difference can be noticed. In order to obtain better DDI predictions, the appropriate Ki values for inhibition of the corresponding UGT enzymes should be entered into Simcyp for ketoconazole and itraconazole. In any event, the magnitude of UGT-involved DDIs is smaller than CYP-involved interactions and AUC ratios are generally lower than twofold, which is in concordance with our results.30,31,32
The final metabolism schema for oxycodone, oxymorphone, and noroxycodone is proposed in Supplementary Figure S1. PBPK modeling can be particularly helpful with respect to subjects with genetic variations in metabolic enzymes or transporters whose recruitment in clinical trials in a sufficient number can be difficult.33 As the fm of every isoenzyme can vary in different populations based on pathologies, genotypes, age, importance of other metabolic pathways, etc, even at a fixed concentration of a perpetrator drug different DDI effect may be observed in various individuals.34,35
In this study, the effect of potential PK nonlinearity (e.g., saturation) could not be considered in created models as CLint was taken into account instead of Km and Vmax of every isoenzyme. The concentrations of tested compounds were assumed to be below the Km values of relevant enzymes. Noroxymorphone is the secondary metabolite of oxycodone with three times higher affinity for the µ-opioid receptor. This metabolite was not included in the current model due to lack of in vitro and in vivo data and the complexity of a four-compound system. Inclusion of appropriate Ki values for inhibition of UGT2B7 enzyme by different inhibitors in the simulator appears relevant and would improve the prediction accuracy. Since assumptions are important aspect of a PBPK model in case of lack of information, an experimental in vitro or in vivo confirmation of these assumptions should be considered. Future perspective consists of combining created PK models with corresponding pharmacodynamic response. This step might be of particular complexity since the analgesic effect cannot be assigned to one compound and the conclusion on the magnitude of each metabolite’s implication in PD effect of oxycodone remains subject of debate.
In summary, this study outlines a strategy to use available in vitro and in vivo information to predict oxycodone exposure changes in the presence of DDIs once a valid model for a given inhibitor is available. This approach is of particular interest when clinical studies are not yet available. PBPK modeling can also be helpful for individuals with genetic variations in metabolic enzymes or transporters, whose recruitment in clinical trials in a sufficient number may be difficult, by incorporating their physiological parameters in a virtual population. As every isoenzyme fm can vary in diverse populations, different DDI effect may be observed in various individuals even at a fixed concentration of a perpetrator drug. Therefore, beside mean AUC ratio prediction for a population, individuals having theoretical extreme risk of DDIs can be identified by accounting for their genotype and/or physiological parameters.
Methods
PBPK model building and refining in healthy volunteers. Initial PBPK models for oxycodone, oxymorphone, and noroxycodone were developed in 10 healthy male volunteers using the Simcyp Population-based ADME Simulator (version 12.0, Simcyp Limited). Equations describing compounds kinetics in Simcyp are published and various sources of interindividual variability of principal parameters are previously discussed.33,36,37 A minimal-PBPK model including three compartments was chosen for oxycodone: central, liver, and gut compartments. This model can be used for compounds with relatively small distribution volume (<4 l/kg) like oxycodone (~2.4 l/kg). Physicochemical and PK characteristics of oxycodone, oxymorphone, and noroxycodone were used to develop the models, using in vitro and in vivo published data. Oxycodone distribution was considered to be perfusion-rate limited assuming that the diffusion through capillary membrane occurs very quickly and the rate-limiting factor for distribution into tissues is the blood flow. Active transporters were not included in the model. A first-order process for absorption of oxycodone from the gut lumen was chosen. In the Simcyp Simulator, the distribution of metabolites throughout the body is assumed to be instantaneous and formed metabolites are instantly available for further metabolism.37 Some of metabolites parameters such as distribution volume and systemic clearance were estimated using parameter estimation and sensitivity analysis functions provided in the simulator. Oxymorphone glucuronidation by UGT2B7 enzyme was derived from in vitro data.38
With regards to clearance, different in vitro systems such as human liver microsomes (HLM) or recombinantly expressed systems can be used to determine the intrinsic clearance (CLint) of a compound by a specific CYP isoform. Obtained CLint can be incorporated into Simcyp to estimate the net intrinsic clearance of the total liver by scaling methods. For that, CLint of different metabolic pathways for each enzyme involved in the metabolism of the compound will be added up after taking into account enzyme’s abundance in the studied population, milligrams of microsomal protein per gram of liver and total liver weight for each individual.36 Besides common in vitro-in vivo extrapolation strategy, hepatic first pass can also be estimated after decomposing the systemic clearance (oral or intravenous clearance) to its renal and hepatic components. Therefore, the net intrinsic hepatic clearance (CLuH,int) will be back-calculated from in vivo clearance value by Eqs. 1–3 using the retrograde mode in the simulator:
 |
 |
 |
where CL is the systemic plasma clearance (L/h), CLpo is the oral clearance (L/h), fa is the fraction absorbed, fh and fg are fractions metabolized escaping metabolism, respectively in the liver and gut, CLmet is the hepatic metabolic clearance in blood (L/h), CLR is the renal clearance (L/h), B:P is the blood to plasma partition ratio, fu,B is the fraction unbound in blood and QH is the hepatic blood flow (84.8 L/h). The estimated net intrinsic clearance will then be divided by the average liver weight, the microsomal protein per gram of liver value for every isoenzyme and the fraction metabolized by each isoenzyme to obtain the intrinsic clearance value for each isoenzyme. Intravenous clearance can also be used applying only Eqs. 2 and 3 (ref. 37). The top-down approach is of particular value when sufficient reliable in vitro data are not available. Therefore, it was preferred for this study using published clinical clearance values for oxycodone and its metabolites. The initial PBPK model was developed based on 11% 2D6-mediated O-demethylation and 45% 3A4-mediated N-demethylation derived from previously published in vitro studies.5,11
In a second step, the initially incorporated parameters were refined by comparing model predictions and observed data in the clinical trial by Samer et al.9 where PK profiles of 0.2 mg/kg single dose oxycodone and its 3 metabolites were monitored in different DDI scenarios. Simulations were performed with trials of 10 nonsmoking healthy male volunteers with age range of 18–30 years and the populations were set with the same CYP2D6 phenotype proportion as the clinical trial, namely six EMs, two PMs, and two ultra-rapid metabolizers. Genetics, physiological, and demographic characteristics of each individual of virtual populations were generated by the simulator from its population database using Monte Carlo approach. The fm value for each isoenzyme is a key element to obtain reliable predictions of both DDIs and metabolite formation, and the accuracy of extrapolation is very sensitive to reliable fm value assigned to each enzyme. In the refining step, the fm of CYP3A was fine-tuned to better describe the observed impact of ketoconazole administration on PK profiles of oxycodone and metabolites. Pertaining to CYP2D6-mediated O-demethylation, fm-2D6 was refined in order to obtain the closest agreement between simulated and clinical plasma concentrations of oxymorphone in PMs and EMs observed by Samer et al. There are currently no defined criteria for validation of PBPK models. Therefore, visual comparisons to observed profiles were performed and simulated profiles within the corresponding variation observed in the reference clinical study were regarded as successful.
The extent of a clinical interaction can be quantitatively assessed in Simcyp by including enzyme kinetics, inhibition properties of the perpetrator drug (Ki, Kinact, etc.) as well as inhibition mechanism (competitive, mechanism-based, etc.) combined with the concentration of substrate and inhibitor at the enzyme’s active site.33 Inhibition parameters for ketoconazole-400 mg-QD are reported in the Supplementary Table S1. The dynamic mode (PK profile) was chosen in the simulator; so, the plasma concentrations of oxycodone and its two metabolites were linked to those of the inhibitor in a time-dependent manner. The dose, dosing duration, and interval for oxycodone and ketoconazole were replicated as in the clinical trial. Briefly, oxycodone was administered alone or coadministered with a single-dose ketoconazole 400 mg 2 h before the oxycodone intake.
Model testing. In order to verify the validity of the final models of oxycodone, oxymorphone and noroxycodone for prediction of different DDIs, seven CYP450-mediated interaction scenarios including ketoconazole, paroxetine, itraconazole, and clarithromycine were simulated in healthy volunteers and results were compared to reference published data.13,39,40,41 All studies were conducted with oral doses of oxycodone except one where the impact of 200 mg oral itraconazole on both oral and intravenous oxycodone was assessed.13 Aforementioned inhibitors were chosen as they already exist in the default library of Simcyp inhibitors and all their parameters were used as Simcyp library files in V12. The reliability of all used inhibitor files has been previously verified using published DDI clinical trials (data not shown). Overview of trial designs of the clinical studies used to test the DDI prediction success is presented in Table 5. When available, CYP2D6 phenotypes were taken into account during simulations. Inhibition parameters for all inhibitors are reported in the Supplementary Table S1.
Table 5. Overview of trial designs of four clinical studies (seven scenarios) used to test the drug–drug interactions prediction success.
Authors Contributions
C.S., J.D., Y.D., and S.R. designed the research. N.M., L.A., and H.H. performed the research. N.M. and Y.D. wrote the manuscript. C.S., N.M., and Y.D. analyzed the data.
Conflict of Interest
H.H. and L.A. are employees of Simcyp Limited. However, no sources of funding were used to conduct this study or to prepare this manuscript, and all authors declare no conflicts of interest relevant to the content of this article.
Study Highlights
Acknowledgments
Simcyp Limited., a Certara Company, is gratefully acknowledged for an academic license for the Simcyp Population-based Simulator and for providing user support.
Supplementary Material
References
- Riley, J., Eisenberg, E., Müller-Schwefe, G., Drewes, A.M. & Arendt-Nielsen, L. Oxycodone: a review of its use in the management of pain. Curr. Med. Res. Opin. 24, 175–192 (2008). [DOI] [PubMed] [Google Scholar]
- Pöyhiä, R., Seppälä, T., Olkkola, K.T. & Kalso, E. The pharmacokinetics and metabolism of oxycodone after intramuscular and oral administration to healthy subjects. Br. J. Clin. Pharmacol. 33, 617–621 (1992). [DOI] [PMC free article] [PubMed] [Google Scholar]
- Chen, Z.R., Irvine, R.J., Somogyi, A.A. & Bochner, F. Mu receptor binding of some commonly used opioids and their metabolites. Life Sci. 48, 2165–2171 (1991). [DOI] [PubMed] [Google Scholar]
- Moore, K.A., Ramcharitar, V., Levine, B. & Fowler, D. Tentative identification of novel oxycodone metabolites in human urine. J. Anal. Toxicol. 27, 346–352 (2003). [DOI] [PubMed] [Google Scholar]
- Lalovic, B., Phillips, B., Risler, L.L., Howald, W. & Shen, D.D. Quantitative contribution of CYP2D6 and CYP3A to oxycodone metabolism in human liver and intestinal microsomes. Drug Metab. Dispos. 32, 447–454 (2004). [DOI] [PubMed] [Google Scholar]
- Samer, C.F. et al. Genetic polymorphisms and drug interactions modulating CYP2D6 and CYP3A activities have a major effect on oxycodone analgesic efficacy and safety. Br. J. Pharmacol. 160, 919–930 (2010). [DOI] [PMC free article] [PubMed] [Google Scholar]
- Nieminen, T.H. et al. Oxycodone concentrations are greatly increased by the concomitant use of ritonavir or lopinavir/ritonavir. Eur. J. Clin. Pharmacol. 66, 977–985 (2010). [DOI] [PubMed] [Google Scholar]
- Nieminen, T.H. et al. Rifampin greatly reduces the plasma concentrations of intravenous and oral oxycodone. Anesthesiology 110, 1371–1378 (2009). [DOI] [PubMed] [Google Scholar]
- Samer, C.F. et al. The effects of CYP2D6 and CYP3A activities on the pharmacokinetics of immediate release oxycodone. Br. J. Pharmacol. 160, 907–918 (2010). [DOI] [PMC free article] [PubMed] [Google Scholar]
- Tsamandouras, N., Rostami-Hodjegan, A. & Aarons, L. Combining the “bottom-up” and “top-down” approaches in pharmacokinetic modelling: fitting PBPK models to observed clinical data. Br. J. Clin. Pharmacol. (in press). DOI: 10.1111/bcp.12234. [DOI] [PMC free article] [PubMed]
- Lalovic, B., Kharasch, E., Hoffer, C., Risler, L., Liu-Chen, L.Y. & Shen, D.D. Pharmacokinetics and pharmacodynamics of oral oxycodone in healthy human subjects: role of circulating active metabolites. Clin. Pharmacol. Ther. 79, 461–479 (2006). [DOI] [PubMed] [Google Scholar]
- Stamer, U.M., Zhang, L., Book, M., Lehmann, L.E., Stuber, F. & Musshoff, F. CYP2D6 genotype dependent oxycodone metabolism in postoperative patients. PLoS One 8, e60239 (2013). [DOI] [PMC free article] [PubMed] [Google Scholar]
- Saari, T.I. et al. Effects of itraconazole on the pharmacokinetics and pharmacodynamics of intravenously and orally administered oxycodone. Eur. J. Clin. Pharmacol. 66, 387–397 (2010). [DOI] [PubMed] [Google Scholar]
- Ohno, Y., Hisaka, A. & Suzuki, H. General framework for the quantitative prediction of CYP3A4-mediated oral drug interactions based on the AUC increase by coadministration of standard drugs. Clin. Pharmacokinet. 46, 681–696 (2007). [DOI] [PubMed] [Google Scholar]
- Edginton, A.N. Knowledge-driven approaches for the guidance of first-in-children dosing. Paediatr. Anaesth. 21, 206–213 (2011). [DOI] [PubMed] [Google Scholar]
- Ke, A.B., Rostami-Hodjegan, A., Zhao, P. & Unadkat, J.D. Pharmacometrics in pregnancy: An unmet need. Annu. Rev. Pharmacol. Toxicol. 54, 53–69 (2014). [DOI] [PubMed] [Google Scholar]
- Jiang, X.L., Zhao, P., Barrett, J.S., Lesko, L.J. & Schmidt, S. Application of physiologically based pharmacokinetic modeling to predict acetaminophen metabolism and pharmacokinetics in children. CPT Pharmacometrics Syst. Pharmacol. 2, e80 (2013). [DOI] [PMC free article] [PubMed] [Google Scholar]
- Gibbs, M.A., Baillie, M.T., Shen, D.D., Kunze, K.L. & Thummel, K.E. Persistent inhibition of CYP3A4 by ketoconazole in modified Caco-2 cells. Pharm. Res. 17, 299–305 (2000). [DOI] [PubMed] [Google Scholar]
- Wandel, C., Kim, R.B., Kajiji, S., Guengerich, P., Wilkinson, G.R. & Wood, A.J. P-glycoprotein and cytochrome P-450 3A inhibition: dissociation of inhibitory potencies. Cancer Res. 59, 3944–3948 (1999). [PubMed] [Google Scholar]
- Wang, E.J., Lew, K., Casciano, C.N., Clement, R.P. & Johnson, W.W. Interaction of common azole antifungals with P glycoprotein. Antimicrob. Agents Chemother. 46, 160–165 (2002). [DOI] [PMC free article] [PubMed] [Google Scholar]
- Sugimoto, H. et al. Establishment of in vitro P-glycoprotein inhibition assay and its exclusion criteria to assess the risk of drug-drug interaction at the drug discovery stage. J. Pharm. Sci. 100, 4013–4023 (2011). [DOI] [PubMed] [Google Scholar]
- Boström, E., Simonsson, U.S. & Hammarlund-Udenaes, M. Oxycodone pharmacokinetics and pharmacodynamics in the rat in the presence of the P-glycoprotein inhibitor PSC833. J. Pharm. Sci. 94, 1060–1066 (2005). [DOI] [PubMed] [Google Scholar]
- Hassan, H.E., Myers, A.L., Lee, I.J., Coop, A. & Eddington, N.D. Oxycodone induces overexpression of P-glycoprotein (ABCB1) and affects paclitaxel’s tissue distribution in Sprague Dawley rats. J. Pharm. Sci. 96, 2494–2506 (2007). [DOI] [PMC free article] [PubMed] [Google Scholar]
- Zwisler, S.T. et al. The antinociceptive effect and adverse drug reactions of oxycodone in human experimental pain in relation to genetic variations in the OPRM1 and ABCB1 genes. Fundam. Clin. Pharmacol. 24, 517–524 (2010). [DOI] [PubMed] [Google Scholar]
- Walsky, R.L. et al. Optimized assays for human UDP-glucuronosyltransferase (UGT) activities: altered alamethicin concentration and utility to screen for UGT inhibitors. Drug Metab. Dispos. 40, 1051–1065 (2012). [DOI] [PubMed] [Google Scholar]
- Yong, W.P., Ramirez, J., Innocenti, F. & Ratain, M.J. Effects of ketoconazole on glucuronidation by UDP-glucuronosyltransferase enzymes. Clin. Cancer Res. 11, 6699–6704 (2005). [DOI] [PubMed] [Google Scholar]
- Uchaipichat, V., Mackenzie, P.I., Elliot, D.J. & Miners, J.O. Selectivity of substrate (trifluoperazine) and inhibitor (amitriptyline, androsterone, canrenoic acid, hecogenin, phenylbutazone, quinidine, quinine, and sulfinpyrazone) “probes” for human udp-glucuronosyltransferases. Drug Metab. Dispos. 34, 449–456 (2006). [DOI] [PubMed] [Google Scholar]
- Liu, Y., She, M., Wu, Z. & Dai, R. The inhibition study of human UDP-glucuronosyltransferases with cytochrome P450 selective substrates and inhibitors. J. Enzyme Inhib. Med. Chem. 26, 386–393 (2011). [DOI] [PubMed] [Google Scholar]
- Raungrut, P., Uchaipichat, V., Elliot, D.J., Janchawee, B., Somogyi, A.A. & Miners, J.O. In vitro-in vivo extrapolation predicts drug-drug interactions arising from inhibition of codeine glucuronidation by dextropropoxyphene, fluconazole, ketoconazole, and methadone in humans. J. Pharmacol. Exp. Ther. 334, 609–618 (2010). [DOI] [PubMed] [Google Scholar]
- Williams, J.A. et al. Drug-drug interactions for UDP-glucuronosyltransferase substrates: a pharmacokinetic explanation for typically observed low exposure (AUCi/AUC) ratios. Drug Metab. Dispos. 32, 1201–1208 (2004). [DOI] [PubMed] [Google Scholar]
- Kiang, T.K., Ensom, M.H. & Chang, T.K. UDP-glucuronosyltransferases and clinical drug-drug interactions. Pharmacol. Ther. 106, 97–132 (2005). [DOI] [PubMed] [Google Scholar]
- Miners, J.O., Mackenzie, P.I. & Knights, K.M. The prediction of drug-glucuronidation parameters in humans: UDP-glucuronosyltransferase enzyme-selective substrate and inhibitor probes for reaction phenotyping and in vitro-in vivo extrapolation of drug clearance and drug-drug interaction potential. Drug Metab. Rev. 42, 196–208 (2010). [DOI] [PubMed] [Google Scholar]
- Jamei, M., Dickinson, G.L. & Rostami-Hodjegan, A. A framework for assessing inter-individual variability in pharmacokinetics using virtual human populations and integrating general knowledge of physical chemistry, biology, anatomy, physiology and genetics: A tale of ‘bottom-up’ vs ‘top-down’ recognition of covariates. Drug Metab. Pharmacokinet. 24, 53–75 (2009). [DOI] [PubMed] [Google Scholar]
- Crewe, H.K., Ellis, S.W., Lennard, M.S. & Tucker, G.T. Variable contribution of cytochromes P450 2D6, 2C9 and 3A4 to the 4-hydroxylation of tamoxifen by human liver microsomes. Biochem. Pharmacol. 53, 171–178 (1997). [DOI] [PubMed] [Google Scholar]
- Collins, C., Levy, R., Ragueneau-Majlessi, I. & Hachad, H. Prediction of maximum exposure in poor metabolizers following inhibition of nonpolymorphic pathways. Curr. Drug Metab. 7, 295–299 (2006). [DOI] [PubMed] [Google Scholar]
- Rostami-Hodjegan, A. & Tucker, G.T. Simulation and prediction of in vivo drug metabolism in human populations from in vitro data. Nat. Rev. Drug Discov. 6, 140–148 (2007). [DOI] [PubMed] [Google Scholar]
- Rowland Yeo, K., Jamei, M., Yang, J., Tucker, G.T. & Rostami-Hodjegan, A. Physiologically based mechanistic modelling to predict complex drug-drug interactions involving simultaneous competitive and time-dependent enzyme inhibition by parent compound and its metabolite in both liver and gut - the effect of diltiazem on the time-course of exposure to triazolam. Eur. J. Pharm. Sci. 39, 298–309 (2010). [DOI] [PubMed] [Google Scholar]
- Coffman, B.L., King, C.D., Rios, G.R. & Tephly, T.R. The glucuronidation of opioids, other xenobiotics, and androgens by human UGT2B7Y(268) and UGT2B7H(268). Drug Metab. Dispos. 26, 73–77 (1998). [PubMed] [Google Scholar]
- Grönlund, J., Saari, T.I., Hagelberg, N.M., Neuvonen, P.J., Olkkola, K.T. & Laine, K. Exposure to oral oxycodone is increased by concomitant inhibition of CYP2D6 and 3A4 pathways, but not by inhibition of CYP2D6 alone. Br. J. Clin. Pharmacol. 70, 78–87 (2010). [DOI] [PMC free article] [PubMed] [Google Scholar]
- Kummer, O., Hammann, F., Moser, C., Schaller, O., Drewe, J. & Krähenbühl, S. Effect of the inhibition of CYP3A4 or CYP2D6 on the pharmacokinetics and pharmacodynamics of oxycodone. Eur. J. Clin. Pharmacol. 67, 63–71 (2011). [DOI] [PubMed] [Google Scholar]
- Liukas, A., Hagelberg, N.M., Kuusniemi, K., Neuvonen, P.J. & Olkkola, K.T. Inhibition of cytochrome P450 3A by clarithromycin uniformly affects the pharmacokinetics and pharmacodynamics of oxycodone in young and elderly volunteers. J. Clin. Psychopharmacol. 31, 302–308 (2011). [DOI] [PubMed] [Google Scholar]
- Boström, E., Simonsson, U.S. & Hammarlund-Udenaes, M. In vivo blood-brain barrier transport of oxycodone in the rat: indications for active influx and implications for pharmacokinetics/pharmacodynamics. Drug Metab. Dispos. 34, 1624–1631 (2006). [DOI] [PubMed] [Google Scholar]
- Moore, C., Kelley-Baker, T. & Lacey, J. Interpretation of oxycodone concentrations in oral fluid. J. Opioid Manag. 8, 161–166 (2012). [DOI] [PubMed] [Google Scholar]
- Korjamo, T., Tolonen, A., Ranta, V.P., Turpeinen, M. & Kokki, H. Metabolism of oxycodone in human hepatocytes from different age groups and prediction of hepatic plasma clearance. Front. Pharmacol. 2, 87 (2011). [DOI] [PMC free article] [PubMed] [Google Scholar]
- Leow, K.P., Wright, A.W., Cramond, T. & Smith, M.T. Determination of the serum protein binding of oxycodone and morphine using ultrafiltration. Ther. Drug Monit. 15, 440–447 (1993). [DOI] [PubMed] [Google Scholar]
- Kokki, M. et al. Absorption of different oral dosage forms of oxycodone in the elderly: a cross-over clinical trial in patients undergoing cystoscopy. Eur. J. Clin. Pharmacol. 68, 1357–1363 (2012). [DOI] [PubMed] [Google Scholar]
- Pöyhiä, R., Olkkola, K.T., Seppälä, T. & Kalso, E. The pharmacokinetics of oxycodone after intravenous injection in adults. Br. J. Clin. Pharmacol. 32, 516–518 (1991). [DOI] [PMC free article] [PubMed] [Google Scholar]
Associated Data
This section collects any data citations, data availability statements, or supplementary materials included in this article.


