

Abstract
Physiologically based pharmacokinetic (PBPK) models are increasingly being used to provide human pharmacokinetic (PK) predictions for organic anion-transporting polypeptide (OATP) substrates based on in vitro assay data. As a natural extension in the application of these models, in this study, we incorporated in vitro information of three major OATP1B1 genetic variants into a previously reported PBPK model to predict the impact of OATP1B1 polymorphisms on human PK. Using pravastatin and rosuvastatin as examples, we showed that the predicted plasma concentration–time profiles in groups carrying different OATP1B1 genetic variants reasonably matched the clinical observations from multiple studies. This modeling and simulation approach may aid decision making in early pharmaceutical research and development as well as patient-specific dose adjustment in clinical practice.
Membrane transporters play a significant role in the pharmacokinetic (PK) profiles of many drugs,1,2 to which functional genetic variations in transporters can contribute. The organic anion-transporting polypeptide 1B1 (OATP1B1), encoded by the gene SLCO1B1, is an uptake transporter expressed on the basolateral membrane of human hepatocytes. OATP1B1 has a broad substrate specificity and is important in both systemic and liver exposure of many drugs.3 OATP1B1 genetic variants with decreased activity may increase systemic exposure, and hence the chance of dose/concentration related adverse drug reactions. For example, the incidence of severe myopathy with statin (OATP1B1 substrates) therapy is related to dose.4 On the other hand, genetic variants with increased activity may decrease the plasma concentration to subtherapeutic levels. Additionally, the impact of OATP1B1 polymorphisms on liver exposure, associated pharmacodynamic effect of liver-targeting compounds, and potential toxicity of nonliver-targeting compounds have not been well characterized and deserve attention.
Multiple SLCO1B1 single nucleotide polymorphisms (SNPs) have been identified, among which there are two that are relatively common and widely studied, i.e., c.521T>C in exon 5 and c.388A>G in exon 4 (where c. represents coding DNA sequence, the number refers to the first nucleotide affected, and “>” indicates a substitution at DNA level). The two SNPs lead to four haplotypes, known as *1a (wild-type, c.388A and c.521T), *1b (c.388G and c.521T), *5 (c.388A and c.521C), and *15 (c.388G and c.521C).3 Adding to the complexity, individuals can be homozygous or heterozygous for these haplotypes. Compared with *1a, the haplotypes *5 and *15 usually have decreased uptake rate,3 while *1b may increase the uptake rate due to increased OATP1B1 expression.5 Although the prevalence and functional implications of other SLCO1B1 SNPs lead to different haplotypes (e.g., *14 (c.388G, c.521T and c.463A)), these have not been widely studied as the four haplotypes listed above.3
The aim of this study is to predict human PK of OATP1B1 substrates for carriers of SLCO1B1 variants through physiologically based pharmacokinetic (PBPK) modeling. Such a model could aid decision making in early pharmaceutical research as well as patient-specific dose adjustment in clinical practice. Rosuvastatin and pravastatin are used in this study to demonstrate the prediction strategy, because there are multiple in vitro pharmacogenetic and in vivo genotyped pharmacokinetic datasets available for the two compounds.
Results
PBPK modeling of nongenotyped clinical data and estimation of OATP1B1 activity
The nongenotyped clearance and absorption parameters including total hepatic active uptake clearance (CLact, tot), biliary clearance (CLbile), passive diffusion clearances in liver (CLpass, liver), absorption rate (ka), and the fraction of the dose absorbed from gastro-intestinal (GI) tract (Fa·Fg) are estimated by fitting nongenotyped mean intravenous infusion and oral dosing data.6,7 Model characterization of the data and the values of both fitted and predicted parameters generated in this study are indicated in Figure 1 and Table 1. The model-derived values of Fa·Fg for pravastatin and rosuvastatin (i.e., 0.46 and 0.50) are lower than what would be obtained via noncompartmental analysis (i.e., 0.52 and 0.72). This is likely due to an overestimation of Fa·Fg via noncompartmental analysis in the presence of enterohepatic recirculation. Consistent with this, a smaller difference is observed with pravastatin due to the relatively greater contribution of renal (rather than biliary) clearance.
Figure 1.

Observed and fitted human plasma time–concentration profiles of (a) pravastatin and (b) rosuvastatin. Circles and crossings represent observed profiles after IV infusion (9.9 mg for pravastatin, 8 mg for rosuvastatin) and oral dosing (19.2 mg for pravastatin, 40 mg for rosuvastatin), respectively.6,7 Solid and dashed lines represent simulations after IV infusion and oral dosing, respectively.
Table 1. Values of parameters for clearance and absorption.

Predictions of uptake clearance in OATP variants and PK in genotyped Caucasian and Japanese populations
The active uptake clearance of OATP1B1 *1a, *1b, and *15 (CLact, *1a, CLact, *1b, and CLact, *15) for the Caucasian population are calculated from in vitro data and nongenotyped active uptake clearance through OATP1B1 (CLact, OATP1B1) (Table 1) as described in the methods section, where *5 and *15 are treated as the same group due to relatively similar activity of the two variants.8 With calculated values of CLact, *1a, CLact, *1b, and CLact, *15, the model reasonably predicts observed human plasma pravastatin profiles of Caucasian *1a, *1b, and *15 groups (Figure 2a).
Figure 2.

Observed and predicted human plasma time–concentration profiles of pravastatin (a) following 40 mg oral dosing in Caucasian population and (b) following 10 mg oral dosing in Japanese population. Red triangles and lines represent observed and predicted profiles of *1a group. Black squares and solid lines represent observed and predicted profiles of *1b group. Blue circles and lines represent observed and predicted profiles of *15 group. Error bars indicate observed standard deviations. The digitized observations are from the one study performed with Caucasian population, and two studies with Japanese population.13,14,20
A previous publication indicates that there is an intrinsic ethnic variability in the activity of OATP1B1,9 where the ratio of Japanese/Caucasians is 0.584. Keeping all other parameters unchanged, predictions using this correction on CLact, tot also match the observations in a previously published study on pravastatin pharmacokinetics in Japanese subjects (Figure 2b). A similar prediction is not done for rosuvastatin due to the lack of the genotyped rosuvastatin pharmacokinetic data in Japanese population.
Pravastatin as well as rosuvastatin concentration–time profiles of c.521TT and c.521CC groups were also reasonably well predicted under the assumption that (in the absence of c388A>G information) these largely represent the *1a and *15 genotypes (Figure 3). The differences between the observations and predictions are within 70% of the observed values for plasma AUC, 75% of the observed values for Cmax, and 10% of the observed values for tmax (Table 2). Considering the relatively large intra- and interstudy variability (Table 2), the observed and predicted pharmacokinetics are reasonably close.
Figure 3.

Observed and predicted human intravenous plasma time–concentration profiles of (a) pravastatin and (b) rosuvastatin in Caucasian population. Red triangles and blue circles represent observed c.521TT and c.521CC groups. Red solid lines and blue dashed lines represent predicted *1a and *15 groups, assuming c.521TT and c.521CC groups are equivalent to *1a and *15 groups, respectively. Error bars indicate observed standard deviations. The digitized observations are three studies for pravastatin, and one study for rosuvastatin.15,16,17,18
Table 2. Observed and predicted pharmacokinetic variables in relation to OATP1B1 polymorphism.

Local sensitivity analysis
The sensitivities of plasma and liver concentration, and AUCplasma up to 8 h for pravastatin and 24 h for rosuvastatin in OATP1B1 genotyped Caucasian population, were evaluated for compound specific parameters. The parameters with normalized sensitivity coefficients greater than 0.3 or less than −0.3 are reported. The plasma concentration is sensitive to unbound fraction in plasma (fu, p), blood to plasma ratio (RB/P), unbound fraction in liver tissue (fu, liver), renal clearance (CLrenal), CLact, OATP1B1, active uptake clearance through non-OATP1B1 transporters (CLact, other), CLbile, CLpass, liver, ka, and Fa·Fg. The liver concentration is also sensitive to these parameters except for RB/P and CLrenal. Plasma concentration is more sensitive towards CLact, OATP1B1 than the liver concentration (data not shown), consistent with a previous PBPK study for pravastatin.10 In addition, the plasma concentration is sensitive to different parameters during different phases (Figure 4), consistent with previous observations.11 AUCplasma is sensitive to fu, p, CLact, OATP1B1, CLact, other, CLbile, CLpass, liver, and Fa·Fg. In general, results are similar between pravastatin and rosuvastatin among *1a, *1b, and *15 groups, except that pravastatin AUCplasma is not sensitive to CLact, other, and rosuvastatin AUCplasma is not sensitive to CLact, *15.
Figure 4.

Time-dependent local sensitivity of compound specific parameters on plasma concentration of (a) pravastatin and (b) rosuvastatin. The local sensitivity analysis shown here is conducted with parameter values associated with OATP1B1 *1b group, however similar results are observed for *1a and *15 groups.
Because the predicted CLact, tot in genotyped populations are calculated using in vitro data, a local sensitivity analysis was performed on predicted CLact, tot (in *1a, *15, and *1b populations) towards the parameters estimated in the in vitro assays (i.e., the ratio between CLact, *1a and CLact, *1b, the ratio between CLact, *1a and CLact, *15, and the fraction of CLact, tot mediated by OATP1B1) (Table 3). In general, as the fraction of CLact, tot mediated by OATP1B1 increases, the predicted CLact, tot across populations is more sensitive to the ratio between CLact, *1a and CLact, *1b (or CLact, *15). When OATP1B1 mediates over 60% CLact, tot, the predicted CLact, tot for all three genotyped populations is relatively sensitive to the ratio between CLact, *1a and CLact, *1b (i.e., the sensitivity coefficient is 0.3 or greater), while only CLact, tot,*15 is sensitive to the ratio between CLact, *1a and CLact, *15 under most situations (i.e., only CLact, tot,*15 but not CLact, tot,*1a or CLact, tot,*1b has sensitivity coefficient larger than 0.1). Simulated plasma concentration–time profiles using the values of the ratio between CLact, *1a and CLact, *15 reported from two in vitro studies (Supplementary Figure S1) are consistent with the sensitivity analysis results in Table 3, that only CLact, tot,*15 is sensitive to the ratio between CLact, *1a and CLact, *15.
Table 3. The local sensitivity analysis on CLact, tot of different genetic variant groups with respect to the parameters estimated in the in vitro assays.

Discussion
The effects of SLCO1B1 polymorphisms on transporter activity for selected OATP substrates and human PK have been established in both in vitro and in vivo studies;3 however, a mechanistic model describing these behaviors and connecting in vitro discoveries with in vivo observations has not been developed previously. In this study, we incorporated in vitro OATP1B1 information for genetic variants into a previously published PBPK model for OATP substrates12 to predict PK profiles of variant carriers.
The uniqueness of this approach relies on the use of in vitro estimated fraction of OATB1B1 in total hepatic active uptake clearance and the ratio of uptake activities between variants. In combination with hepatic clearance and absorption estimated from average plasma concentrations of ungenotyped population, the proposed approach can reasonably predict plasma concentration–time profiles for genotyped groups. The prediction relies on the key assumptions that the contribution of OATP1B1 to total uptake and the effect of SLCO1B1 polymorphisms on uptake activities are relatively consistent between in vitro and in vivo conditions, and only CLact, OATP1B1 changes without the need for adjustment of other parameters and the model structure.
Accounting for differences in OATP1B1 activity between Caucasians and Japanese,9 the model can also predict observations in Japanese pravastatin study13,14 (Figure 2). Application of the same approach to rosuvastatin pharmacokinetics determined in ungenotyped Japanese subjects suggests that the ethnic difference in OATP activity may be larger for this compound (0.3 rather than 0.584, data not shown). As such, further study is required to understand the genotype-dependence of rosuvastatin pharmacokinetics in Japanese and to determine the ethnic dependence of OATP uptake for this compound.
Given the available data, several assumptions are made to simplify the problem. We assume that the fraction of three OATP1B1 variants in nongenotyped Caucasian IV studies follows that in European population. We assume that heterozygotes have the same activity as the homozygotes if the pharmacokinetic study grouped heterozygotes and homozygotes together. This may lead to the misprediction of the pharmacokinetics, because heterozygous clearance may be different from homozygous clearance.15 We further assume that in Figure 3 the c.521TT group is the same as the *1a group in the studies for which SNP c.388A>G or c.463C>A is not sequenced;15,16,17,18 the assumed *1a (c.521TT, c.388AA, and c.463CC) group may be confounded by *1b (c.521TT, c.388GG and c.463CC) and/or *14 (c.521TT, c.388GG, and c.463AA) genotypes. The *1b genotype is associated with the increased OATP1B1 expression level,5 while the *14 genotype may be associated with the reduction in the intrinsic OATP1B1 uptake rate.19 In addition, in Figure 2 where data are digitized from the studies sequencing c.388A>G,13,14,20 *1b group could also be confounded by *14 carrier if c.463C>A was not genotyped. We further assumed that polymorphisms of other transporters only play minor roles in drug disposition and do not affect plasma PK, and no gene interactions between OATP1B1 and other transporters. The use of these assumptions is supported by the good agreement between predictions and observations in the two case examples.
In vitro assay data indicate *1b increases OATP1B1 expression by twofold,5 which is assumed to affect all substrates. In the prediction for rosuvastatin, we assume that the uptake rate of *1b is higher than that of *1a and *15. However, the observed in vivo *1b uptake rate is slightly lower than *1a rate.21,22 The predicted AUC0–24 h of the *1b group (24.1 ng·h/ml) is less than the predicted AUC0–24 h of the *1a group (32.6 ng·h/ml), in contrast with the observation that average AUC0–t of *1b group is slightly higher than that of the *1a group.21,22 The reason for the inconsistency is unknown, but can be that protein expression differences do not proportionally translate to functional differences. Assuming that *1b does not increase OATP1B1 expression level in rosuvastatin studies, we re-estimate clearance for the three variants without the expression difference incorporated, leading to a result consistent with clinical observations (data not shown). In addition, if c.463 C>A is not sequenced in these study,21,22 subjects carrying *14 may exit in *1b or c.388A>G group. Since *14 may lead to reduction in intrinsic uptake rate as discussed above, it would compensate for increase in mean uptake rate due to *1b carriers.
The mechanistic modeling approach proposed here helps our understanding of the pharmacokinetic properties of OATP substrates in populations carrying OATP variants. For example, a previous in vivo study shows that the SLCO1B1 polymorphism (i.e., SNP c.521T>C) has no impact on fluvastatin PK.17 Based on this result, several studies claim that fluvastatin is not an OATP1B1 substrate,17,23,24 which leads to an obvious inconsistency with in vitro uptake assay results where fluvastatin is an OATP1B1 substrate.25 This phenomenon can be explained using our approach. Previously published in vitro pharmacogenetic studies have shown that this SNP does not result in impaired OATP1B1 uptake activity for fluvastatin.26,27
 |
CLact, other, fluvastatin is believed to be the same between *15 and *1a group here, hence
 |
As such, even if fluvastatin is an OATP1B1 substrate as shown in vitro, SNP c.521T>C will not change the in vivo PK profile of fluvastatin, because *15 and *1a have the same hepatic clearance. In fact, the impact of SLCO1B1 polymorphisms is known to be compound dependent.27 As such, in vitro functional evaluation of OATP polymorphisms can provide useful information on the prediction and interpretation of clinical pharmacokinetics.
In the sensitivity analysis, the rosuvastatin AUCplasma is not sensitive to CLact, *15, mainly because given the current model parameter values, clearance of rosuvastatin by OATP1B1 *15 is not significant compared with clearance by other transporters. Similarly, pravastatin AUCplasma is not sensitive to CLact, other, largely because the clearance of pravastatin by other transporter is not significant compared with clearance by OATP1B1. The genotyped CLact, tot is calculated from in vitro data. To assess the impact of variability in the in vitro data on the calculated CLact, tot, we performed another sensitivity analysis (Table 3). Based on this analysis, if in vitro assay results indicate OATP1B1 mediates more than 60% of the CLact, tot, it is likely that the variability in the in vitro estimated intrinsic activity ratio between CLact, *1a and CLact, *1b will affect the calculation of the genotyped CLact, tot, and the PK prediction for each genotype. On the other hand, even if CLact, tot is solely mediated by OATP1B1, the variability in the in vitro estimated ratio between CLact, *1a and CLact, *15 may only affect CLact, tot, *15 estimation (results which are further illustrated in Supplementary Figure S1).
In this study, we performed analysis with PBPK rather than traditional pharmacokinetic modeling. For OATP substrates, the PBPK model has the ability to predict the pharmacokinetics in the liver, where tissue concentration to plasma concentration ratio is not constant. This is important in estimating efficacy for liver-targeting compounds (e.g., statins),28,29 potential liver toxicity of nonliver-targeting compounds (e.g., endothelin receptor antagonists),30 or potential drug–drug interactions in the liver.31 Additionally, although the current model uses nongenotyped human plasma data as a starting point, when combined with previously published modeling efforts to predict mean human pharmacokinetic response for compounds in the preclinical development,11,12 the model has the potential to prospectively predict pharmacokinetics in OATP1B1 genetic variant populations without using any human data.
Rose et al. recently published a study where a PBPK model was applied to assess the impact of OATP1B1 genetic variation on the pharmacodynamics of rosuvastatin.29 They estimated clearances by fitting genotyped human plasma data and evaluated the impact of OATP1B1 genetic variation on the pharmacodynamics. Our study uses in vitro estimated clearances together with nongenotyped clinical pharmacokinetics to prospectively predict how the OATP1B1 genetic variation affects the pharmacokinetics. Although using a different approach to evaluate the clearance values of the genotyped groups, and a slightly different liver model structure (three compartments (i.e., liver blood, liver extracellular tissue, and liver intracellular tissue) versus five pairs of liver blood and liver tissue) as well as different physiological parameters, the sensitivity analysis in our study reaches a similar conclusion as the published study:29 the rosuvastatin concentration in plasma is more sensitive to the genetic variability of OATP1B1 while the liver concentration is less sensitive. As such, the genetic variation in OATP1B1 may not affect the pharmacodynamic effects of liver-targeting compounds as much as the systemic pharmacokinetics. However, the OATP1B1 genetic variation may affect pharmacodynamics or toxicity in other tissues due to its effects on systemic exposure.
In conclusion, these results indicate that in vitro functional pharmacogenetic data can be used to support reasonably accurate predictions for groups carrying specific variants through the proposed PBPK modeling approach. Such an approach may be useful in the evaluation of drug candidates in drug discovery, the design of clinical trials and ultimately for dose adjustments in clinical practice. Lastly, this framework also provides a starting place from which to systematically evaluate some simplifying assumptions which are currently necessary due to the lack of information as more data become available (e.g., expression/activity of heterozygous vs. homozygous variants, expression/activity of variants beyond those examined in this particular study, gene interactions with other transporters).
Methods
PBPK modeling of nongenotyped clinical data and estimation of OATP1B1 activity
The structural model (Supplementary Figure S2) is based upon a previously published PBPK model.12 Equations were added to describe enterohepatic recirculation.
 |
where Cbile and CIC represent drug concentrations in the bile and liver tissue; CLbile is biliary clearance; fu, liver is the unbound fraction of compound in liver tissue; and Vbile and Qliver, bile are the volume of bile ducts in the liver and the bile flow rate. Vbile and Qliver, bile were 0.318% of liver volume32 and 350 ml/day.33 The GI lumen is modeled as
 |
where Xlumen is the amount of compound in GI lumen compartment. ka is the absorption rate; Fa is fractional absorption, Fg is the fraction that escapes from metabolism or efflux in the GI tract.
Gallbladder emptying after meals was not included in the modeling because feeding schedules were not available. The equation for the gut compartment is
 |
where Vgut is volume of gut; Qgut is blood flow; Ca and Cgut are the concentrations in arterial blood and gut compartment; and RB/P and Kpgut are the blood to plasma ratio and tissue to plasma partition coefficient. (Equations and parameter values not reported in text are given in Supplementary Material.)
CLact, tot is modeled as the sum of CLact, OATP1B1 and CLact, other:
 |
The nongenotyped CLact, tot, CLbile, CLpass, ka, Fa·Fg were estimated by fitting the model to plasma concentration–time course data following intravenous infusion and oral dosing in nongenotyped studies.6,7 The ratios of CLpass between liver, adipose and muscle and values of all other parameters are fixed at previously published values.12 The model is implemented in MATLAB (Version 2013a, Mathworks, Natick, MA) and differential equations are compiled as a MEX file (MATLAB code and MEX file are given in Supplementary Material). A stochastic global optimization method, differential evolution (DE) with nonlinear sampling, was used to estimate these parameters as described before.34 The 95% confidence intervals for the optimized parameters were approximated using a residual bootstrap method developed before.12
Fa·Fg is also estimated using a previously published noncompartmental method35 to compare with the value estimated from fitting PBPK model to plasma data. The liver blood flow and RB/P in the noncompartmental analysis are set to the values we used in the PBPK model.
Predictions of uptake clearance in OATP variants and PK in genotyped Caucasian populations
To predict PK profiles of carriers of specific genetic variants, we keep all the parameters in PBPK model unchanged, but replace the nongenotyped CLact, OATP1B1 in Eq. 6 with predicted CLact, *1a, CLact, *1b, or CLact, *15 to generate new CLact, tot. For example, for the group carrying *15 after pravastatin dosing, we have
 |
To simplify the problem, *5 is treated as *15 considering the relatively similar activities of the two variants.8 The diplotypes are restricted to homozygous *1a/*1a, *1b/*1b, and *15/*15 (or *5/*15, *5/*5). For the published concentration–time curves15,16,17 without information about SNP c.388A>G, we attribute the c.521TT group in these studies as *1a, and the c.521CC group as *5 and *15.
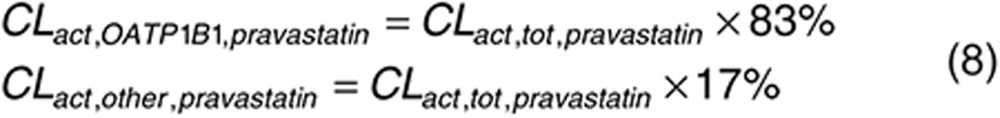
Consistent with that reported previously, we assumed the fraction of pravastatin uptake clearance due to OATP1B1 to be 83%.23 The remaining 17% is believed to be due to OATP1B3. We assume that pravastatin is not the substrate of other uptake transporter (e.g., Na+-taurocholate cotransporting polypeptide (NTCP)), because currently there is no evidence. However, if later research indicates other uptake transporter is involved in hepatic uptake of pravastatin, such information should be incorporated into calculation. With the fitted CLact, tot, we calculate CLact, OATP1B1 and CLact, other for nongenotyped population as below:
 |
For rosuvastatin, 35% of total active uptake is due to NTCP activity,36 while 77% of the remaining 65% is mediated by OATP1B1.37 As such, OATP1B1 is expected to account for 50% of total uptake clearance of rosuvastatin.
 |
Because CLact, OATP1B1 is calculated from CLact, tot estimated using mean data,6,7 CLact, OATP1B1 of nongenotyped population is treated as the average values of active uptake clearance of three major OATP1B1 genetic variants weighted by the proportion of participants carrying them (P*1a, P*1b, and P*15).
 |
Since the participants were not genotyped for OATP1B1 polymorphisms in the published studies with intravenous infusion data from which we estimate CLact, tot,6,7 we assume that the proportion of OATP1B1 genetic variants follows the reported proportion in the European population (i.e., *1a, 56%; *1b, 26%; *5 and *15, 18%),38 considering the participants in the intravenous infusion studies were Caucasians.6,7
The ratios of intrinsic uptake clearances between *1a and *1b, and *1a and *15 are estimated from reported in vitro assay results. For pravastatin, the intrinsic uptake activities of *1b and *15 are reduced to 81% (ref. 8) and 35% (average value of the two reports)8,26 of the activity of *1a. The expression level of *1b is twice of *1a, while the expression level of *15 is about the same as *1a.5 Since a previous in vivo study has shown that *1b can lead to increased clearance,20 we assume that the active uptake clearance is proportional to the expression level.
 |
For rosuvastatin, similarly, the intrinsic uptake activities of *1b and *5&*15 are reduced to 82% (ref. 36) and 15% (average value of the two reports)26,36 of the activity of *1a. For prediction purpose, we assumed that CLact,*1b for rosuvastatin is also increased due to the increased expression level, although this has not been supported by the clinical observation.22
 |
Combining Eqs. 10 with 11 and 12 we get what the expected mean clearance would be amongst the general population.
 |
 |
Finally, CLact, *1a, CLact, *1b, and CLact, *15 can be estimated from CLact, OATP1B1. With CLact, other estimated above, CLact, tot for three variants can be calculated using Eq. 7 and applied in PBPK model for PK predictions.
To compare predictions with observations, pravastatin human plasma concentration–time course data are digitized from four previously published studies, where Caucasian participants were genotyped for OATP1B1 polymorphisms and dosed orally with 40 mg pravastatin.15,16,17,20 Observed rosuvastatin human plasma concentration–time course data are also digitized from a previously published study, where Caucasian participants were genotyped for OATP1B1 polymorphisms and dosed orally with 10 mg rosuvastatin.18
Predictions of uptake clearance in OATP variants and PK in genotyped Japanese populations
To test if the model can be applied to other populations by using a published ratio of intrinsic OATP1B1 activity between Japanese and Caucasians (i.e., 0.584),9 we correct CLact, *1a, CLact, *1b, and CLact, *15 with this value and assume that the ratio of Japanese/Caucasians for CLact, other is also 0.584. Liver weight and hepatic blood flow are assumed to be same between Caucasian and Japanese populations.39 All other parameters are unchanged. To compare predictions with observations, clinical plasma concentration–time profiles are digitized from two published studies of pravastatin performed with Japanese populations.13,14 To date, similar data for rosuvastatin in a Japanese population are not available.
Local sensitivity analyses
Local sensitivity analyses for the in vivo model were conducted as before11 where each compound specific parameter is raised by 1% with respect to its value in the PK simulations for genotyped Caucasian populations. The values of the plasma and liver concentrations throughout the time course, and AUCplasma are obtained. Sensitivity coefficients are normalized to both the parameter value and the model output value.
In addition, using Eqs. 7–14, we evaluated the local sensitivity of predicted CLact, tot for *1a, *1b, and *15 populations to the parameters estimated from the in vitro assays (i.e., intrinsic uptake activity ratio between CLact, *1a and CLact, *1b; intrinsic uptake activity ratio between CLact, *1a and CLact, *15; and the fraction of CLact, tot mediated by OATP1B1). In this analysis, population parameters (i.e., P*1a, P*1b, P*15 for Caucasian population) and parameters estimated by fitting in vivo data (i.e., nongenotyped CLact, tot) are fixed. The intrinsic uptake activity ratio between CLact, *1a and CLact, *1b (or CLact, *15) is raised by 1%; and the value of the genotyped CLact, tot (i.e., CLact, tot, *1a, CLact, tot, *1b, and CLact, tot, *15) is re-evaluated. The local sensitivity coefficient is calculated as the difference between the new value of the genotyped CLact, tot and its nominal value (Table 1), divided by the nominal value and 1%. As the new value of genotyped CLact, tot is also sensitive to the estimated fraction of CLact, tot mediated (also determined in vitro), the sensitivity analysis was performed over a range of fractional OATP1B1 contributions between 0.2 and 1.
To visualize how actual interstudy variability in the in vitro data might impact these results, concentration–time profiles of pravastatin were generated over the range of CLact, *1a and CLact, *15 intrinsic uptake activity ratios reported in the literature (i.e., 0.20 (ref. 8) and 0.50 (ref. 26)). The ratio between CLact, *1a and CLact, *15 of pravastatin is selected because (i) its value is available from two independent studies, while values of most other parameters are only available from single in vitro studies; (ii) its value of pravastatin shows the largest difference between two studies (the value for rosuvastatin is also available from two studies, which however reported almost identical numbers);26,36 and (iii) OATP1B1 contributes over 80% of total hepatic active uptake of pravastatin, hence has a more pronounced impact on pharmacokinetics. The intrastudy variability is not included in the current study, considering it is generally small with the coefficient of variation below 60%.5,8,26,36,37
Author contributions
T.M., R.L., and H.B. wrote the manuscript. T.M., R.L., and H.B. designed the research. R.L. performed the research. R.L. analyzed the data
Conflict of interest
The authors declared no conflict of interest.
Study Highlights

Supplementary Material
References
- The International Transporter Consortium. Membrane transporters in drug development. Nat. Rev. Drug Discov. 9, 215–36 (2010). [DOI] [PMC free article] [PubMed] [Google Scholar]
- Kalliokoski, A. & Niemi, M. Impact of OATP transporters on pharmacokinetics. Br. J. Pharmacol. 158, 693–705 (2009). [DOI] [PMC free article] [PubMed] [Google Scholar]
- Niemi, M., Pasanen, M.K. & Neuvonen, P.J. Organic anion transporting polypeptide 1B1: a genetically polymorphic transporter of major importance for hepatic drug uptake. Pharmacol. Rev. 63, 157–181 (2011). [DOI] [PubMed] [Google Scholar]
- Generaux, G.T., Bonomo, F.M., Johnson, M. & Doan, K.M. Impact of SLCO1B1 (OATP1B1) and ABCG2 (BCRP) genetic polymorphisms and inhibition on LDL-C lowering and myopathy of statins. Xenobiotica. 41, 639–651 (2011). [DOI] [PubMed] [Google Scholar]
- Nies, A.T. et al. Genetics is a major determinant of expression of the human hepatic uptake transporter OATP1B1, but not of OATP1B3 and OATP2B1. Genome Med. 5, 1 (2013). [DOI] [PMC free article] [PubMed] [Google Scholar]
- Singhvi, S.M., Pan, H.Y., Morrison, R.A. & Willard, D.A. Disposition of pravastatin sodium, a tissue-selective HMG-CoA reductase inhibitor, in healthy subjects. Br. J. Clin. Pharmacol. 29, 239–243 (1990). [DOI] [PMC free article] [PubMed] [Google Scholar]
- Martin, P.D. et al. Metabolism, excretion, and pharmacokinetics of rosuvastatin in healthy adult male volunteers. Clin. Ther. 25, 2822–2835 (2003). [DOI] [PubMed] [Google Scholar]
- Kameyama, Y., Yamashita, K., Kobayashi, K., Hosokawa, M. & Chiba, K. Functional characterization of SLCO1B1 (OATP-C) variants, SLCO1B1*5, SLCO1B1*15 and SLCO1B1*15+C1007G, by using transient expression systems of HeLa and HEK293 cells. Pharmacogenet. Genomics 15, 513–522 (2005). [DOI] [PubMed] [Google Scholar]
- Tomita, Y., Maeda, K. & Sugiyama, Y. Ethnic variability in the plasma exposures of OATP1B1 substrates such as HMG-CoA reductase inhibitors: a kinetic consideration of its mechanism. Clin. Pharmacol. Ther. 94, 37–51 (2013). [DOI] [PubMed] [Google Scholar]
- Watanabe, T., Kusuhara, H., Maeda, K., Shitara, Y. & Sugiyama, Y. Physiologically based pharmacokinetic modeling to predict transporter-mediated clearance and distribution of pravastatin in humans. J. Pharmacol. Exp. Ther. 328, 652–662 (2009). [DOI] [PubMed] [Google Scholar]
- Jones, H.M. et al. Mechanistic pharmacokinetic modeling for the prediction of transporter-mediated disposition in humans from sandwich culture human hepatocyte data. Drug Metab. Dispos. 40, 1007–1017 (2012). [DOI] [PubMed] [Google Scholar]
- Li, R. et al. A “middle-out” approach to human pharmacokinetic predictions for OATP substrates using physiologically-based pharmacokinetic modeling. J. Pharmacokinet. Pharmacodyn. 41, 197–209 (2014). [DOI] [PubMed] [Google Scholar]
- Nishizato, Y. et al. Polymorphisms of OATP-C (SLC21A6) and OAT3 (SLC22A8) genes: consequences for pravastatin pharmacokinetics. Clin. Pharmacol. Ther. 73, 554–565 (2003). [DOI] [PubMed] [Google Scholar]
- Maeda, K. et al. Effects of organic anion transporting polypeptide 1B1 haplotype on pharmacokinetics of pravastatin, valsartan, and temocapril. Clin. Pharmacol. Ther. 79, 427–439 (2006). [DOI] [PubMed] [Google Scholar]
- Ho, R.H. et al. Effect of drug transporter genotypes on pravastatin disposition in European- and African-American participants. Pharmacogenet. Genomics 17, 647–656 (2007). [DOI] [PMC free article] [PubMed] [Google Scholar]
- Niemi, M. et al. High plasma pravastatin concentrations are associated with single nucleotide polymorphisms and haplotypes of organic anion transporting polypeptide-C (OATP-C, SLCO1B1). Pharmacogenetics 14, 429–440 (2004). [DOI] [PubMed] [Google Scholar]
- Niemi, M., Pasanen, M.K. & Neuvonen, P.J. SLCO1B1 polymorphism and sex affect the pharmacokinetics of pravastatin but not fluvastatin. Clin. Pharmacol. Ther. 80, 356–366 (2006). [DOI] [PubMed] [Google Scholar]
- Pasanen, M.K., Fredrikson, H., Neuvonen, P.J. & Niemi, M. Different effects of SLCO1B1 polymorphism on the pharmacokinetics of atorvastatin and rosuvastatin. Clin. Pharmacol. Ther. 82, 726–733 (2007). [DOI] [PubMed] [Google Scholar]
- Tamraz, B. et al. OATP1B1-related drug-drug and drug-gene interactions as potential risk factors for cerivastatin-induced rhabdomyolysis. Pharmacogenet. Genomics 23, 355–364 (2013). [DOI] [PMC free article] [PubMed] [Google Scholar]
- Mwinyi, J., Johne, A., Bauer, S., Roots, I. & Gerloff, T. Evidence for inverse effects of OATP-C (SLC21A6) 5 and 1b haplotypes on pravastatin kinetics. Clin. Pharmacol. Ther. 75, 415–421 (2004). [DOI] [PubMed] [Google Scholar]
- Choi, J.H., Lee, M.G., Cho, J.Y., Lee, J.E., Kim, K.H. & Park, K. Influence of OATP1B1 genotype on the pharmacokinetics of rosuvastatin in Koreans. Clin. Pharmacol. Ther. 83, 251–257 (2008). [DOI] [PubMed] [Google Scholar]
- Lee, E. et al. Rosuvastatin pharmacokinetics and pharmacogenetics in white and Asian subjects residing in the same environment. Clin. Pharmacol. Ther. 78, 330–341 (2005). [DOI] [PubMed] [Google Scholar]
- Shitara, Y., Maeda, K., Ikejiri, K., Yoshida, K., Horie, T. & Sugiyama, Y. Clinical significance of organic anion transporting polypeptides (OATPs) in drug disposition: their roles in hepatic clearance and intestinal absorption. Biopharm. Drug Dispos. 34, 45–78 (2013). [DOI] [PubMed] [Google Scholar]
- Elsby, R., Hilgendorf, C. & Fenner, K. Understanding the critical disposition pathways of statins to assess drug-drug interaction risk during drug development: it’s not just about OATP1B1. Clin. Pharmacol. Ther. 92, 584–598 (2012). [DOI] [PubMed] [Google Scholar]
- Noé, J., Portmann, R., Brun, M.E. & Funk, C. Substrate-dependent drug-drug interactions between gemfibrozil, fluvastatin and other organic anion-transporting peptide (OATP) substrates on OATP1B1, OATP2B1, and OATP1B3. Drug Metab. Dispos. 35, 1308–1314 (2007). [DOI] [PubMed] [Google Scholar]
- Choi, M.K., Shin, H.J., Choi, Y.L., Deng, J.W., Shin, J.G. & Song, I.S. Differential effect of genetic variants of Na(+)-taurocholate co-transporting polypeptide (NTCP) and organic anion-transporting polypeptide 1B1 (OATP1B1) on the uptake of HMG-CoA reductase inhibitors. Xenobiotica. 41, 24–34 (2011). [DOI] [PubMed] [Google Scholar]
- Deng, J.W. et al. The effect of SLCO1B1*15 on the disposition of pravastatin and pitavastatin is substrate dependent: the contribution of transporting activity changes by SLCO1B1*15. Pharmacogenet. Genomics 18, 424–433 (2008). [DOI] [PubMed] [Google Scholar]
- Lennernäs, H. & Fager, G. Pharmacodynamics and pharmacokinetics of the HMG-CoA reductase inhibitors. Similarities and differences. Clin. Pharmacokinet. 32, 403–425 (1997). [DOI] [PubMed] [Google Scholar]
- Rose, R.H., Neuhoff, S., Abduljalil, K., Chetty, M., Rostami-Hodjegan, A. & Jamei, M. Application of a Physiologically Based Pharmacokinetic Model to Predict OATP1B1-Related Variability in Pharmacodynamics of Rosuvastatin. CPT. Pharmacometrics Syst. Pharmacol. 3, e124 (2014). [DOI] [PMC free article] [PubMed] [Google Scholar]
- Hoeper, M.M. Liver toxicity: the Achilles’ heel of endothelin receptor antagonist therapy? Eur. Respir. J. 34, 529–530 (2009). [DOI] [PubMed] [Google Scholar]
- Barton, H.A. et al. Model-based approaches to predict drug-drug interactions associated with hepatic uptake transporters: preclinical, clinical and beyond. Expert Opin. Drug Metab. Toxicol. 9, 459–472 (2013). [DOI] [PubMed] [Google Scholar]
- Casali, A.M., Siringo, S., Sofia, S., Bolondi, L., Di Febo, G. & Cavalli, G. Quantitative analysis of intrahepatic bile duct component in normal adult human liver and in primary biliary cirrhosis. Pathol. Res. Pract. 190, 201–206 (1994). [DOI] [PubMed] [Google Scholar]
- Davies, B. & Morris, T. Physiological parameters in laboratory animals and humans. Pharm. Res. 10, 1093–1095 (1993). [DOI] [PubMed] [Google Scholar]
- Kleinstein, S.H., Bottino, D., Georgieva, A., Sarangapani, R. & Scott Lett, G. Nonuniform Sampling for Global Optimization of Kinetic Rate Constants in Biological Pathways. Simulation Conference, 2006 WSC 06 Proceedings of the Winter, Monterey, CA, 3–6 December 2006. 1611–6.
- Varma, M.V. et al. Physicochemical space for optimum oral bioavailability: contribution of human intestinal absorption and first-pass elimination. J. Med. Chem. 53, 1098–1108 (2010). [DOI] [PubMed] [Google Scholar]
- Ho, R.H. et al. Drug and bile acid transporters in rosuvastatin hepatic uptake: function, expression, and pharmacogenetics. Gastroenterology 130, 1793–1806 (2006). [DOI] [PubMed] [Google Scholar]
- Kitamura, S., Maeda, K., Wang, Y. & Sugiyama, Y. Involvement of multiple transporters in the hepatobiliary transport of rosuvastatin. Drug Metab. Dispos. 36, 2014–2023 (2008). [DOI] [PubMed] [Google Scholar]
- Pasanen, M.K., Neuvonen, P.J. & Niemi, M. Global analysis of genetic variation in SLCO1B1. Pharmacogenomics 9, 19–33 (2008). [DOI] [PubMed] [Google Scholar]
- Barter, Z.E., Tucker, G.T. & Rowland-Yeo, K. Differences in cytochrome p450-mediated pharmacokinetics between chinese and caucasian populations predicted by mechanistic physiologically based pharmacokinetic modelling. Clin. Pharmacokinet. 52, 1085–1100 (2013). [DOI] [PubMed] [Google Scholar]
Associated Data
This section collects any data citations, data availability statements, or supplementary materials included in this article.