Abstract
Craniosynostosis, a disorder in which one or more fibrous joints of the skull fuse prematurely, causes skull malformation and may be associated with increased intracranial pressure and developmental delays. In order to perform medical research studies that relate phenotypic abnormalities to outcomes such as cognitive ability or results of surgery, biomedical researchers need an automated methodology for quantifying the degree of abnormality of the disorder. This paper addresses that need by proposing a set of features derived from CT scans of the skull that can be used for this purpose. A thorough set of experiments is used to evaluate the features as compared to two human craniofacial experts in a ranking evaluation.
I. Introduction
Craniosynostosis, a birth defect that occurs when one or more sutures, the fibrous joints of the skull, fuse prematurely; it occurs in one in 2,000 to 2,500 live births [1]. Often, a misshapen head and abnormal facial features are induced [2], as illustrated in Fig. 1, which shows the most common cases of synostosis: 1) sagittal, 2) unilateral coronal, and 3) metopic. Although clinicians can easily diagnose craniosynostosis and classify its type, being able to quantify the condition (i.e., shape-deformity) automatically is important. Manual coding by expert reviewers is expensive, time-consuming, and probably unreliable without extensive pre-training. Automated platforms, once they are developed, are a fast, reliable and relatively inexpensive method for obtaining precise quantification of large data sets. Future clinical applications, in which for example a surgeon might want to quantify pre- to post-surgery change, would be quite impractical using manual ratings in a clinical setting.
Fig. 1.
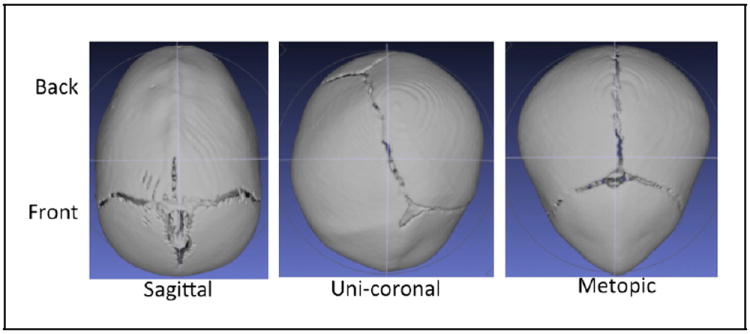
Sagittal, uni-coronal and metopic synostosis skulls.
In previous work, Atmosukarto et al. [3] determined several measures for quantifying the severity of deformational plagiocephaly (DP), a postnatal flattening of the back of the skull. Her descriptors used the concept of an azimuth-elevation-angle histogram of the surface normals of the back of the head and produced severity errors that were functions of the left and right side bins of these histograms.
Yang et at. [4] developed a severity-based retrieval system that produced a variation of Ruiz-Correa’s cranial image [5]. To assess severity, Yang used logistic regression, L1-regularized logistic regression, the fused lasso and the clustering lasso classifiers but the method required a high-dimensional 100 × 100 distance matrix and it was both computational and memory costly. Her method was also sensitive to poor resolution, noise or other imperfections on the original CT scans; consequently, only 70 skull images could be used.
In our own previous work [6] on classification, we developed a general platform upon which basic shape measures, both single-valued and vector-valued were extracted from a single plane projection of the 3D skull. This technique allowed us to process images that would otherwise be eliminated due to poor resolution or noise on their original CT scans and to distinguish with high accuracy between abnormal cases in each class and controls. In the current paper, the features are expanded to become more descriptive so that they can be used to score all the images in each class according to different measures of shape-deformity.
II. Methodology
Our system is a general platform for 3D craniofacial shape analysis that was described in detail in [6] and will be briefly summarized here.
A. Preprocessing, ROI, and Contour Extraction
Seattle Children’s Hospital acquired the CT images from Atlanta, Chicago, Seattle and St. Louis sites. From the CT volume data of the head, our system first extracts the skull slices and creates a single 3D image of the skull surface mesh. Each mesh contains between 140,000 and 850,000 vertices. Next, our system performs normalization on the surface mesh to ensure the skull poses are symmetrical and use the same coordinate and orientation. The final step in preprocessing is landmarking. We use only two landmark points: nasion and opisthion to define our base plane as shown in Fig. 2. The mesh on and above this base plane is considered to be the region of interest (ROI), which our algorithm extracts. Subsequently, the coordinate reference of the 3D ROI is re-oriented.
Fig. 2.
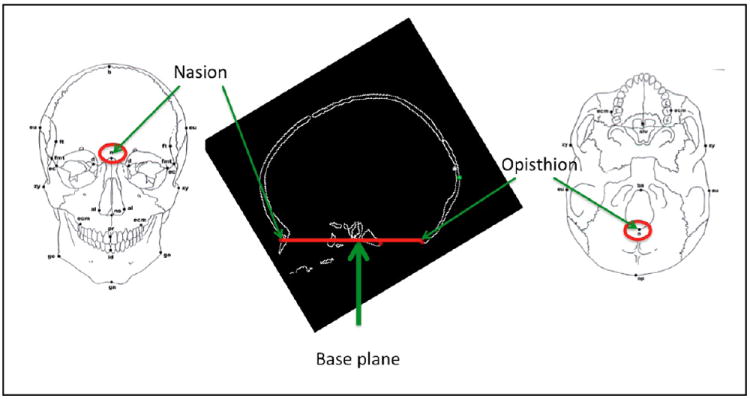
Locating the base plane.
Our contour extraction module first projects a top view of the 3D ROI onto a 2D plane. Then it extracts only the exterior contour points uniformly in one-degree steps for a 360-degree sweep. The top view of a 3D extracted ROI and its 2D external contour after being cleaned are shown in Fig. 3.
Fig. 3.
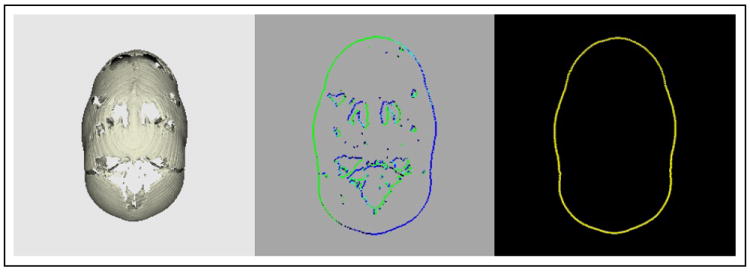
Extracting a 2D external contour (right) by first projecting the 3D surface mesh (left) onto a 2D plane (middle) and keeping only the exterior points from the silhouette.
B. Features used for Quantification of the Deformation
This study uses both low-level and aggregate features to produce six single-valued scores. Features 1 and 2 were used for classification in [6]. Single-valued features 3, 4, and 5 are derived from the 360-D Angle feature in [6], which describes the angle between a line with the slope of two neighboring contour points and the horizontal axis as shown on the left of Fig. 4.
Fig. 4.
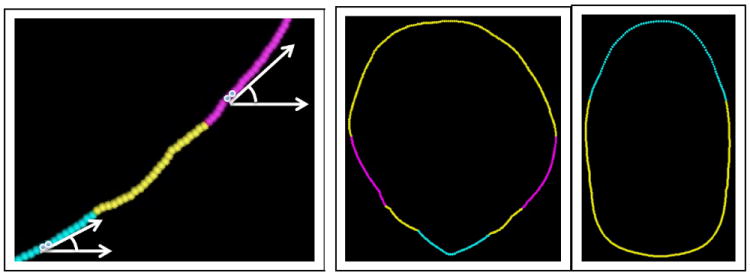
(left) Components of the Angle vector at two different points along a contour; (middle) front-center contour in magenta and front-tip contour in cyan; (right) back contour in cyan.
Compare to Circle (cmp2C) compares the 2D contour to a circle. A higher error score value indicates a less circular skull. For instance, the skull in Fig. 3 is a less circular skull.
Symmetry (symCmp) compares the contour points of the left and right sides to determine the symmetry of a skull. A higher error score value indicates a more asymmetrical skull.
Average Slope Angle of Front Tip (front) and
Average Slope Angle of Back (back) are the two averages of the Angle vectors describing the front tip (shown in cyan in the middle of Fig. 4) and the back (shown in cyan on the right of Fig. 4) of a skull, respectively.
Change of Average Slope Angle Towards Front Tip (COA) describes the angular difference between the average angle of the front-center contour (shown in magenta in the middle of Fig. 4) and the front-tip (shown in cyan in the middle of Fig. 4). For a more deformed metopic skull, the sharpness of its front angle tends to reduce less from the center towards the tip area.
Width to Length Ratio (w2l) describes the ratio of the width to the length of a skull. This is the simplest and perhaps the most widely used craniofacial feature, though not the most powerful in this experiment. A more deformed sagittal synostosis skull usually has a lower width to length ratio value.
III. Experiments and Results
A. Clinician ranking orders
The 115-subject pre-surgery dataset used in this study includes 57 sagittal, 33 left or right unilateral coronal, and 25 metopic skull images. Within each of these 3 synostosis categories, two medical doctors, Expert1 and Expert2, separately used an interactive application to examine the 3D images and rank them according to the degree of their shape-deformity from least deformed (Rank 1) to most (Rank N).
B. Correlations and Ranking comparisons
For all the images in each of the three synostosis classes, the six features that were described in Section II-B were computed, followed by an analysis of the Spearman’s correlation coefficients between these features and the ranking orders provided by the two experts. Features that achieved correlations close to or above 0.5 are shown for each of the classes in the following order: 1) metopic, 2) sagittal, and 3) uni-coronal. The ordering of the classes reflects the success of the automated methods in correlating with the expert opinions. Correlations between the two experts are also given and also are highest for metopic, next highest for sagittal, and quite low for uni-coronal.
Note that the use of all six features combined did not improve correlation to the ranking orders provided by the two clinicians. Our goal was to identify and use only the highly effective features for deformity assessment and class ranking.
1) metopic class
As shown in Table I, the metopic ranking orders from the two experts were highly correlated at 0.7723. Nevertheless, a machine generated feature, COA, correlated at 0.8019 to Expert1 and at 0.8592 to Expert2, the highest correlation we found. As demonstrated on the left of Fig. 5, the slope of the front contour changes less and remains sharp from the center towards the tip of the more deformed skull. Another feature, front, indicates the average angular slope sharpness of the front tip. Feature front was correlated at 0.7261 to Expert1 and at 0.7281 to Expert2.
TABLE I.
Correlation coefficients of metopic ranking orders.
| Expert1 | Expert2 | COA | front | |
|---|---|---|---|---|
| Expert1 | 1 | 0.7723 | 0.8019 | 0.7261 |
| Expert2 | 0.7723 | 1 | 0.8592 | 0.7287 |
| COA | 0.8019 | 0.8592 | 1 | 0.7411 |
| front | 0.7261 | 0.7287 | 0.7411 | 1 |
Fig. 5.
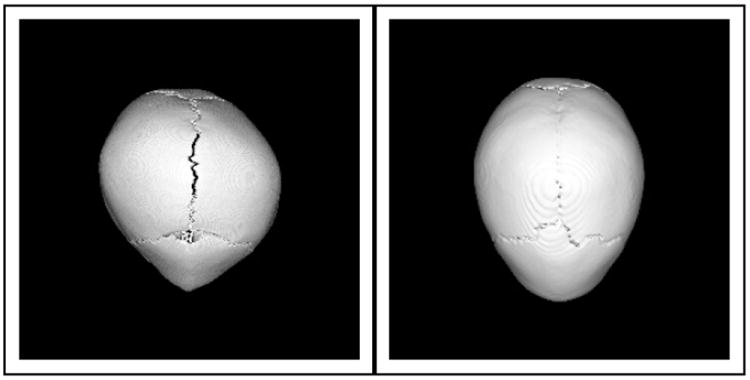
Illustration of a more shape-deformed metopic skull (left), which has less angular change at the front of a skull and a more persistent sharp angle towards the front tip, than a less shape-deformed metopic skull (right), whose contour gradually reduces in angular sharpness towards the front tip.
Fig. 6 and Fig. 7 show the top five most deformed and top five least deformed metopic class skulls in order of ranking by the COA feature and in comparison to the rankings of the front feature and those assigned by Expert1 and Expert2. Here, the four sets of ranking orders are reasonably consistent. However, the ranking of medium deformed skulls was less consistent, as ranking results show in Fig. 8. One way to explain this is to look at Fig. 9, where the horizontal axis shows the scoring values provided by the COA feature and the red crosses and blue asterisks show the rankings provided by Expert1 and Expert2, respectively. There is close agreement on the most or least scored skulls, but quite a lot of disagreement in between.
Fig. 6.

5 metopic most shape-deformed skulls. COA and front were machine ranked based on features that have demonstrated high correlation to ranks provided by the two human experts.
Fig. 7.
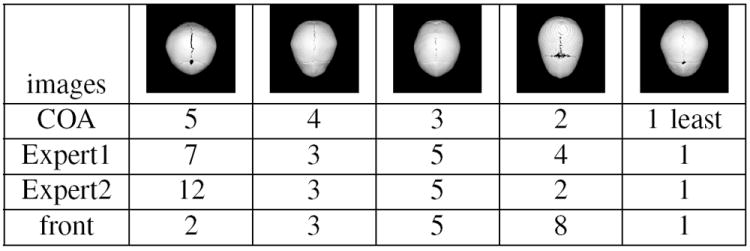
5 metopic least shape-deformed skulls.
Fig. 8.
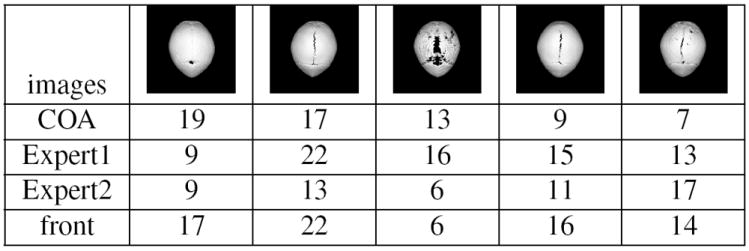
5 metopic inconsistently ranked skulls
Fig. 9.
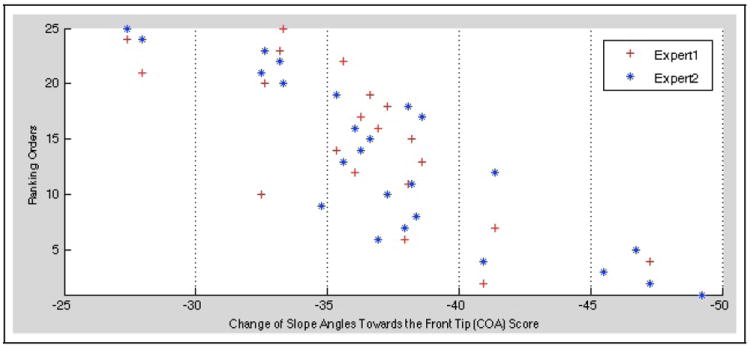
Ranking orders provided by the two experts in correlation to machine ranking measure, COA.
2) sagittal class
As shown in Table II, the sagittal ranking orders from the two experts were moderately correlated at 0.5135. In contrast, a machine generated feature, back, correlated at 0.6512 to Expert1 and 0.5808, slightly less so, to Expert2. As shown on the left of Fig. 10, the more angular is the back of a sagittal skull, the more shape-deformed is the skull. Feature cmp2C is also correlated to the shape-deformity of a sagittal skull; the less circular is a sagittal skull, the more shape-deformed it is (as shown on the left of Fig. 10). Feature w2l is a simple ratio of width over length of a skull. It has a negative correlation, therefore, to deformity; when the skull is narrower or longer in proportion (also shown on the left of Fig. 10), the ratio value is lower and the deformity is higher. Feature w2l had a negative correlation of -0.4436, moderately inversely correlated to Expert2 and only -0.3510 to Expert1.
TABLE II.
Correlation coefficients of sagittal ranking orders.
| Expert1 | Expert2 | back | cmp2C | w2l | |
|---|---|---|---|---|---|
| Expert1 | 1 | 0.5135 | 0.6512 | 0.5190 | -0.3510 |
| Expert2 | 0.5135 | 1 | 0.5808 | 0.4868 | -0.4436 |
| back | 0.6512 | 0.5808 | 1 | 0.8434 | -0.7584 |
| cmp2C | 0.5190 | 0.4868 | 0.8434 | 1 | -0.9450 |
| w2l | -0.3510 | -0.4436 | -0.7584 | -0.9450 | 1 |
Fig. 10.
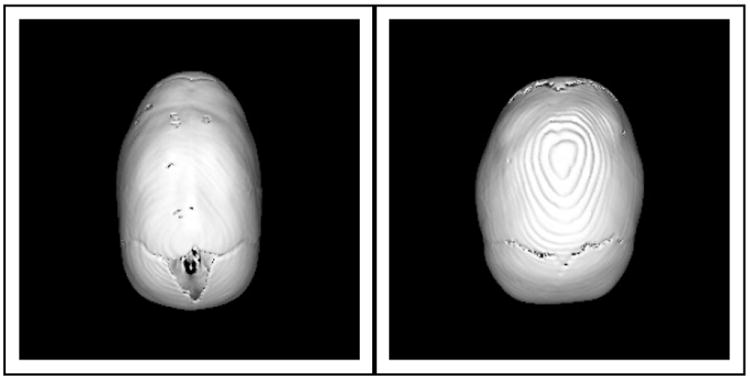
Illustration of a more shape-deformed sagittal skull (left), whose back is more angular and as a whole, it is less circular; whereas a less shape-deformed sagittal skull (right), whose back is less angular and as a whole, it is more circular.
Figures 11, 12, and 13 show the five most deformed, five least deformed, and five of the middle group of sagittal skulls in order of ranking by the back feature and compared to the cmp2C feature, Expert1, and Expert2. Again there is much more agreement in the top five and bottom five groups and much less in the middle, as one would expect.
Fig. 11.
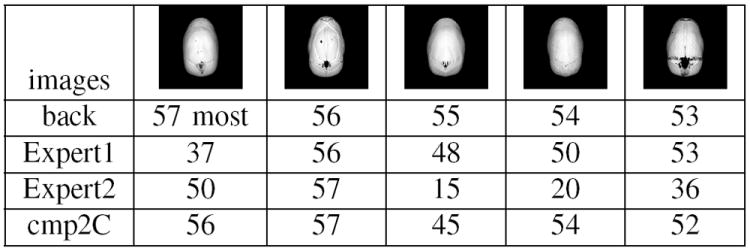
5 sagittal most shape-deformed ranks. Back and cmp2C are machine ranked based on features that have demonstrated high correlation to ranking orders from the two experts.
Fig. 12.
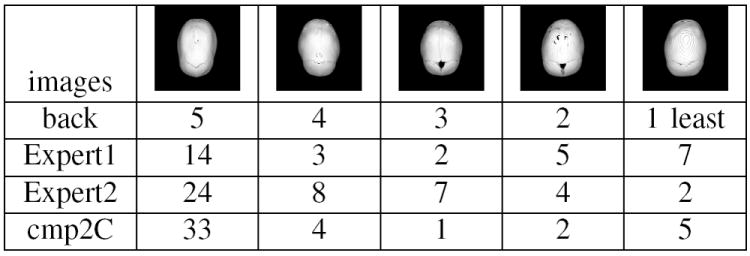
5 sagittal least shape-deformed ranks.
Fig. 13.
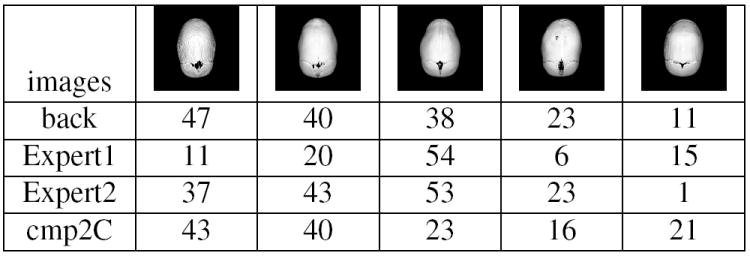
5 sagittal inconsistently ranked skulls.
3) unilateral coronal class
The unilateral coronal class was most challenging. The experiment did not achieve good results. The correlation between Expert1 and Expert2 was only 0.3165. The feature w2l showed a slightly higher correlation of 0.3470 to Expert1 and almost no correlation to Expert2. Similarly, feature symCmp showed a correlation of 0.3240 to Expert1 and hardly any to Expert2, as shown in table III.
TABLE III.
Correlation results of uni-coronal ranking orders.
| Expert1 | Expert2 | w2l | symCmp | |
|---|---|---|---|---|
| Expert1 | 1 | 0.3165 | 0.3470 | 0.3240 |
| Expert2 | 0.3165 | 1 | 0.0810 | -0.0469 |
| w2l | 0.3470 | 0.0810 | 1 | 0.0917 |
| symCmp | 0.3240 | -0.0469 | 0.0917 | 1 |
IV. Discussions and Conclusions
In this paper, we have described a methodology for quantifying skull deformity using six features obtained from a projection of the top view of the skull of craniosynostosis subjects. Our methods are simple, yet powerful, allowing feature extraction even on low-quality CT images. Each of our features allows a score to be assigned to a skull indicating the degree of deformation according to that feature. In order to assess the utility of our features, we computed correlations between expert rankings of the skulls in each class and the rankings of our program with each feature. For the metopic class, two of our features, change of average slope angle towards front tip and average slope angle of front tip, were highly correlated with both expert rankings, which were also highly correlated to one another. For the sagittal class, there was a medium correlation between two of our features, average slope angle of back and compare to circle, and the experts, and a medium correlation between the two experts. For the unilateral coronal case, two of our features, width to length ratio and symmetry, achieved a low positive correlation with one of the experts, and the experts had a low positive correlation with each other. The different definitions of deformity used to assess severity by the two experts, a pediatrician and a surgeon, may account for some of their disagreement. The purpose of the computer algorithms was to provide a consistent, non-subjective, and precise measure of the deformation. The process of comparing our rankings and those of the experts has produced a number of new insights that we will employ in designing new features and new scoring mechanisms.
Acknowledgments
This research was supported by NIH/NIDCR under grant number U01 DE 020050 (Dr. Shapiro) and grant number R01 DE 13813 (Dr. Speltz).
References
- 1.Slater B, Lenton K, Kwan M, Gupta D, Wan D, Logaker M. Cranial sutures: a brief review. Plast Reconstr Surg. 2008 Apr;121(no. 4):170e–178e. doi: 10.1097/01.prs.0000304441.99483.97. [DOI] [PubMed] [Google Scholar]
- 2.Panchal J, Uttchin V. Management of craniosynostosis. Plast Reconstr Surg. 2003 May;111(no. 6):2032–48. doi: 10.1097/01.PRS.0000056839.94034.47. [DOI] [PubMed] [Google Scholar]
- 3.Atomsukarto I, Shapiro L, Starr J, Heike C, Collett B, Cunningham M, Speltz M. 3d head shape quantification for infants with and without deformational plagiocephaly. Cleft Palate Craniofac J. 2010;47(4):368–377. doi: 10.1597/09-059.1. [DOI] [PMC free article] [PubMed] [Google Scholar]
- 4.Yang S, Shapiro L, Cunningham M, Speltz M, Birgfeld C, Atomsukarto I, Lee S. Proceedings of the MICCAI Workshop on Medical Content Based Retrieval for Clinical Decision Support. Springer; 2012. Skull retrieval for craniosynostosis using sparse logistic regression models. [DOI] [PMC free article] [PubMed] [Google Scholar]
- 5.Ruiz-Correa S, Sze R, Lin H, Shapiro L, Speltz M, Cunningham M. Classifying craniosynostosis deformations by skull shape imaging. 18th IEEE Symposium on Computer-Based Medical Systems; 2005. pp. 335–340. [DOI] [PubMed] [Google Scholar]
- 6.Lam I, Cunningham M, Speltz M, Shapiro L. Classifying craniosynostosis with a 3d projection-based feature extraction system. IEEE 27th International Symposium On Computer-Based Medical Systems; May 2014; [DOI] [PMC free article] [PubMed] [Google Scholar]


