

Abstract
Recent work suggests that older adults’ decision-making behavior is highly affected by recent events. In the present work younger and older adults performed a two-choice task where one option provided a larger average reward, but there was a large amount of noise around the mean reward for each option which led to sharp improvements or declines in rewards over trials. Older adults showed greater responsiveness to recent events than younger adults as evidenced by fits of Reinforcement Learning (RL) models. Older adults were particularly sensitive to recent negative events, which was evidenced by a strong tendency for older adults to switch to the other option following steep declines in reward. This tendency led to superior performance for older adults in one condition where heightened sensitivity to recent negative events was advantageous. These results extend prior work that has found an older adult bias toward negative feedback, and suggest that older adults engage in more abrupt switching in response to negative outcomes than younger adults.
People of all ages must make many decisions on a daily basis with varying degrees of uncertainty regarding the outcomes. One critical aspect in decision-making under uncertainty involves learning from the consequences, or outcomes of each decision. Observation of long-term trends regarding which options, on average, lead to better payoffs than other competing options is a crucial aspect of decision-making. Similarly, observation of short-term trends or abrupt changes in reward outcomes can also strongly affect decisions (Kovach et al., 2012; Otto, Markman, & Love, 2012).
Recent work has demonstrated that older adults may rely on simple heuristics during decision-making more than younger adults (Besedes, Deck, Sarangi, & Shor, 2012; Castel, Rossi, & McGillivray, 2012; Worthy & Maddox, 2012). One commonality among these heuristics is an increased reliance on recent events. For example, older adults are more likely than younger adults to endorse the “hot-hand” heuristic in basketball, which gives greater weight to recent shot outcomes than the shooter’s long-term average in determining the probability that the next shot will be made (Castel et al., 2012). Similarly, older adults are more likely to utilize a “win-stay-lose-shift” (WSLS) heuristic during decision-making tasks, which entails focusing only on changes in the most recent decision outcomes. In contrast, younger adults’ behavior is better characterized by a Temporal-Difference Reinforcement Learning (Sutton & Barto, 1998) strategy that relies on an exponentially-weighted average of past rewards (Worthy & Maddox, 2012; Worthy Otto, & Maddox, 2012).
Based on these findings we reasoned that older adults may show enhanced sensitivity to recent events during decision-making, namely marked improvements or declines in reward for each option. Additionally, we proposed that the greater attention given to recent events by older adults would be most prevalent following recent negative outcomes, or declines in reward, relative to previous trials. Supporting this prediction, a number of recent studies demonstrate that older adults learn more from negative rather than positive outcomes (Eppinger, Hammerer, & Lee, 2011; Eppinger & Kray, 2011; Frank & Kong, 2008; Hammerer et al., 2010; Simon, Howard, & Howard, 2010). These studies utilized probabilistic reinforcement learning tasks with binary-valued outcomes where participants were told that they were either correct or incorrect on each trial. These types of tasks mirror many real-world decision-making situations where decisions can be dichotomously classified as “correct” or “incorrect.”
However, the positive and negative feedback following choices often comes in varying magnitudes, and moreover, these magnitudes fluctuate over time. For example, financial investments can result in varying amounts of gains or losses. Here, we examine whether older adults are more sensitive than younger adults to recent fluctuations in reward, and if their putative focus on negative feedback makes them more likely to switch away from an option following steep declines in reward. To test this, we had older and younger adults perform two conditions of a simple two- choice task where one option provided larger rewards, on average, than the other option, but there was a large variance around the mean reward given by each option. This led to large fluctuations in reward, affording examination of responsiveness to recent positive and negative events. We predicted that both younger and older adults would learn which option provided larger average rewards, but at the same time, older adults would attend more to recent events, particularly negative events, compared to younger adults. To test the latter prediction, we employ nuanced behavioral metrics and computational modeling to elucidate how recent reward trends influence participants’ choices. In the first condition, termed the ‘consistent rewards’ condition, the mean reward provided by each option remained consistent over all trials but there was noise around each option’s mean reward value. We expected older adults to be more likely to switch following steep declines in reward, relative to the selected option’s expected value. However, because these declines in reward were not indicative of longer-term trends in expected value of the choice options, we did not expect differences in overall task performance, as measured by cumulative reward earned.
To provide a corroborative test of our hypothesis we had a second group of older and younger adults make choices in a similar task structure where switching based on recent negative events should result in better overall performance. In this ‘variable rewards’ condition, if participants switched following a reward that was less than the current average reward provided for the option they selected they would receive a temporary “bonus” in the rewards they received for both options. This bonus was equivalent to the difference between the current average reward for the option they had selected and the reward they received prior to switching. Thus, if older adults tended to switch more following steep declines in reward then they would be temporarily rewarded with larger rewards for both options, improving their performance (see below for more detailed information). To summarize, we predicted that older adults would show similar behavior across the two conditions, where they would be more likely to switch following steep declines in reward, and that this would lead to superior performance, relative to younger adults, in the variable rewards condition.
Method
Forty-seven older adults (Mean Age=67.43, SD=5.05, Range=61–78) and forty-nine younger adults (Mean Age=20.02, SD=1.88, Range=18–26) were paid $8 per hour to complete the experiment. There were twenty-three older adults and twenty five younger adults in the consistent rewards condition, and twenty-four older and younger adults in the variable rewards condition.
Older adult participants were recruited through an advertisement in the local newspaper and through flyers posted at locations throughout the area. Younger adults were recruited from flyers and email solicitations. Our stopping rule for data collection was to recruit 25 participants in each condition and to stop when we were no longer receiving responses from interested participants.
Neuropsychological Testing Procedure
Older adults were given a series of standardized neuropsychological tests. The battery of tests was designed to assess general intellectual ability and included: WAIS-III Digit Span, Wechsler, 1997; Trails Making Test A&B (TMT; Reitan, 1958); FAS, Lezak, 1995; Wisconsin Card Sorting Task (WCST; Heaton, 1981), and the California Verbal Learning Test (CVLT; Delis, Kramer, Kaplan, & Ober, 1987). The tests were administered in a single one hour session, in the same basic order to all subjects. The delay period for the CVLT was kept constant, and was comprised of other tests not requiring any long term memory storage.
The standard, age appropriate, published norms were used to calculate normative scores for each subject. Table 1 shows the means, standard deviations and ranges of standardized z-scores on each test for older adult participants in the study. For the WAIS digit-span test, the percentile was calculated according to testing instructions, and this score was then converted to a standardized z-score. For the CVLT and WCST standardized T-scores were calculated according to testing directions, and this score was then converted to a standardized z-score. Finally, for the TMT, standard z-scores were calculated according to the testing instructions. There were no subjects two standard deviations below the standardized mean on more than two neuropsychological tests. The neuropsychological testing session was held before the experimental session, and only participants who were within normal ranges were asked to participate in the experiment.
Table 1.
| Neuropsychological Test | Mean (SD) | Range |
|---|---|---|
| Digit Span | 0.45 (.91) | −1.3 – 2.5 |
| Trails A | −.14 (.81) | −.1.75 – 1.61 |
| Trails B | −.23 (.72) | −1.54 – 2.5 |
| FAS | −.21 (.83) | −1.81 – 2.15 |
| WCST Errors | .75 (1.35) | −2.3 – 2.5 |
| WCST perseveration | .80 (1.07) | −1.9 – 2.5 |
| CVLT Immediate Recall | .63 (1.02) | −1.5 – 2.5 |
| CVLT Delayed Recall | 0.31 (.94) | −1.5 – 2.00 |
Decision Making Task Procedure
Participants were given a cover story that they were astronauts on Mars testing two systems that extracted oxygen from the Martian atmosphere (Figure 1A). Their goal was to extract as much oxygen as possible. In the consistent rewards condition System A extracted a mean of 65 units of oxygen per trial, while System B extracted a mean of only 55 units of oxygen per trial (Figure 1B). The standard deviation around each system’s mean payoff was 10 units.1 Thus, while System A yielded more reward on average than System B, both options rewards’ exhibited large variance.
Figure 1.


(a.) Sample screen-shot from the experiment. (b.) Rewards provided by each option in the consistent rewards condition. In the variable rewards condition the rewards shown were provided in addition to the bonus amount (ε) given by Equation 1.
In the variable rewards condition both options provided the same rewards, and an additional value, ε was added to the mean rewards for each option from the consistent rewards condition. The quantity ε changed the average rewards provided by each option from the consistent rewards condition, serving as a bonus when positive, and a penalty when negative. The ε value was initialized at 0 and updated each time participants switched to a different option according to:
| (1) |
where X̄r,i,t−1 is the mean reward value from the consistent rewards condition for the chosen option, i, on the preceding trial and rt−1 is the reward that was received on the previous trial. Thus, ε was positively incremented if participants switched following rewards that were less than the current average, and negatively incremented if participants switched following rewards that were greater than the current average. Note that if recent events had no effect on participants’ switching behavior then the amount of oxygen collected in the consistent and variable rewards conditions should be equivalent.
In both conditions, participants accumulated oxygen by selecting either system on each of 100 trials. They were not told anything about the rewards they could expect to see from each option, but had to learn from experience. In the consistent condition participants were given a goal equivalent to extracting 6,300 units of oxygen by end of the experiment. This was roughly equivalent to what would be achieved by selecting System A on 80% of trials, whereas in the variable condition the goal was equivalent to extracting 7,000 units of oxygen as we predicted that participants would collect more oxygen due to the addition of the bonus amount.
On each trial participants selected one of two systems and a small oxygen meter on the right-hand side of the screen filled up a certain amount in blue representing the amount of oxygen that had just been extracted. The oxygen was then transferred into a larger tank representing the amount they had cumulatively extracted (Figure 1A). At the end of the experiment participants were told whether or not they reached their goal and thanked for their participation. We did not include any additional measures or experimental conditions other than what are reported below.
Results
Figure 2a shows the average cumulative reward for participants in each condition. A 2 (Age) × 2 (Condition) ANOVA revealed a significant effect of age, F(1,92)=6.87, p<.01, η2=.069, a significant effect of condition, F(1,92)=40.39, p<.001, η2=.305, and a significant age × condition interaction, F(1,92)=6.83, p<.01, η2=.069. Pairwise comparisons between older and younger adults within each experimental condition revealed no effect of age on performance within the consistent rewards condition, t(46)=.016, p=.99 (older adults M=6,249, SD=175; younger adults M=6,248, SD=189), but a significant effect of age on performance within the variable rewards condition, t(46)=2.70, p<.01 (older adults M=7,203, SD=711; younger adults M=6,646, SD=718).
Figure 2.

(a.) Average cumulative amount of oxygen gathered for participants in each group. (b.) Average proportion of System A selections. Error bars represent standard errors of the mean.
We also examined the proportion of trials that participants selected System A, the advantageous option (Figure 2b). There was no main effect for age (F<1) or condition (F=1.14) and no age × condition interaction (F<1). Thus, the superior performance for older adults in the variable rewards condition was not simply due to their selecting the better option more often than younger adults.
Next, we fit each participant’s data individually with a Basic and Expanded version of a Reinforcement-Learning (RL) model to investigate the degree to which participants utilized recent and long-term reward outcomes. RL models have proven to be a valuable tool in much prior work for conducting more thorough analyses of decision-making behavior (e.g. Busemeyer & Stout, 2002; Worthy, Maddox & Markman, 2007; Yechiam & Busemeyer, 2005).
The models both assumed that the expected value (V) for each option is an exponentially weighted average of the rewards that have been received after selecting each option. Vs for all options were initialized at 60 units which is the midpoint between the average rewards provided by each option. Vs were updated only for the chosen option, i, based on the prediction error (δt), which represents the difference between the reward received (rt) and the expected reward value:
| (2) |
For the Basic RL model the expected value for the chosen option (Vi) was then updated according to the following updating rule:
| (3) |
Learning is modulated by a learning rate parameter (α), 0 ≤ α ≤ 1 that weighs the degree to which the model updates the Vs for each option based on the prediction error (δ). As α approaches 1 greater weight is given to the most recent rewards in updating Vs, and as α approaches 0 recent rewards are given less weight.
The Expanded version of the RL model also used Equation 3 to update expected values but the model included separate learning rate parameters for trials with positive (αpos) and negative (αneg) prediction errors. The inclusion of separate learning rate parameters for positive and negative prediction errors allows the model to account for participants tendencies to update expected values at different rates following positive or negative trends. The Expanded RL model’s ability to differentially weigh positive and negative prediction errors echoes prominent cognitive learning models (e.g the Expectancy Valence and Prospect Valence Learning models; Ahn, Busemeyer, Wagenmakers, & Stout, 2008; Busemeyer & Stout, 2002), which allow for different weighting of gains versus losses, and is further supported by biological dissociation of these weightings (Frank, Moustafa, Haughey, Curran, & Hutchison, 2007; Frank, Doll, Oas-Terpstra, & Moreno, 2009).
We also included an autocorrelation term (A) in both models that accounts for any autocorrelation in choices not explained by changes in reward (Daw, 2011; Lau & Glimcher, 2005)2. The recent selection term for option i is simply 1 if that option was chosen on the previous trial, and 0 otherwise:
| (4) |
This term models the tendency to switch or stay with the same option regardless of the payoffs received.
Choice Rule
The probability for selecting each option is determined by a Softmax rule that includes the value (V), and autocorrelation terms (A) for each option.
| (5) |
Here inverse temperature parameters, βv, and βA, weight the degree to which the value (V) and autocorrelation terms (A) terms contribute to each choice.
Model Comparison
The RL models’ fits were assessed based on their ability to predict each choice a participant would make on the next trial, by estimating parameter values that maximized the log-likelihood of each model given the participant’s choices. To avoid recovering parameters at local minima, we fit each model with 500 random starting points.
The Basic RL model was nested within the Expanded RL model as a special case when αpos is equivalent to αneg. Accordingly, we first used a likelihood ratio test to assess whether the addition of a second learning rate parameter significantly improved the fit. The G2 statistic, which is twice the difference in log-likelihood between each model follows a chi-square distribution, with df equal to the difference in the number of free parameters for each model (Maddox & Ashby, 1993):
| (6) |
The G2 (likelihood ratio) test evaluates the contribution of the additional learning rate parameter in the Expanded Model (Kovach et al., 2012; McCullagh and Nelder, 1999).
To compare the Expanded RL model with the nested Basic RL model within younger and older adults, we summed the G2 values over all participants in each group, with df equal to the number of participants in each group (Daw, 2011; Kovach et al., 2012). The full model provided a better description than the nested model within both the consistent rewards (p<.01, df=48) and variable rewards conditions (p<.01, df=48).
As a second method of comparing the fit of each model we computed each model’s Bayesian Information Criterion (BIC; Schwarz, 1978):
| (7) |
Here k equals the difference in the number parameters between the models and N equals the number of observations. Positive values indicate a better fit for the RL model and negative values indicate a better fit for the Baseline model. BIC is one of the more conservative methods for evaluating models due to its harsher penalization of models with additional free parameters compared to other methods like the likelihood ratio test presented above (Collins & Frank, 2012; Vrieze, 2012; Wagenmakers & Farrell, 2004).
We also fit a Baseline model that assumed stochastic responding. This model had one free parameter that represented participants’ tendencies to select System A on each trial, regardless of their recent choice history (Yechiam & Busemeyer, 2005).
Table 2 lists the average log-likelihood and BIC values for each model for each group of participants. Both of the RL models provided a better fit than the Baseline model for all groups. The inclusion of an additional learning rate parameter in the Extended RL model resulted in a very small improvement in log-likelihood. Average BIC values were lower for the Basic RL model than for the Extended RL model for each group of participants, suggesting that the Extended model did not provide a significantly improved fit, according to BIC. Thus while the results of the G2 likelihood ratio test indicated that the addition of a second learning rate parameter in the Extended RL model significantly improved the fit, the more conservative BIC comparison suggested that the improvement in fit was a modest one.
Table 2.
Average log-likelihood and BIC Values for Each RL Model
| Younger Adults | Older Adults | |
|---|---|---|
| Consistent Rewards Condition | ||
| Log-likelihood | ||
| Basic RL Model | 45.81 (16.04) | 41.08 (15.93) |
| Extended RL Model | 44.84 (15.59) | 40.51 (16.14) |
| Baseline Model | 57.71 (12.76) | 55.83 (14.03) |
| BIC | ||
| Basic RL Model | 105.46(32.08) | 95.98 (31.86) |
| Extended RL Model | 108.11(33.18) | 99.45 (32.28) |
| Baseline Model | 120.02 (25.52) | 116.27 (28.08) |
| Variable Rewards Condition | ||
| Log-likelihood | ||
| Basic RL Model | 38.34 (20.22) | 30.99 (19.00) |
| Extended RL Model | 36.62 (21.29) | 30.16 (18.74) |
| Baseline Model | 53.40 (18.49) | 49.52 (20.49) |
| Basic RL Model | 90.50 (40.44) | 75.79 (38.00) |
| Extended RL Model | 91.66 (42.58) | 78.75 (37.48) |
| Baseline Model | 111.40 (36.98) | 103.65 (40.98) |
Note: Standard deviations are listed in parentheses.
As a second method of evaluating the ability of the RL models to account for behavior in the task we performed simulations of each task using participants’ best-fitting parameter estimates. This has become an increasingly common additional check for how well computational models account for behavior (e.g. Steingrover, Wetzels, & Wagenmakers, 2013; Worthy, Pang, & Byrne, 2013; Worthy, Hawthorne, & Otto, 2013). For both models we performed 1,000 simulations for each task for both older and younger adults by randomly sampling with replacement a set of parameter values for each simulation. We then computed the points earned in 25-trial blocks in the task and compared the average points earned by participants. Figure 3 shows the simulation results for the Basic (Figure 3a) and Extended (Figure 3b) RL models for the consistent rewards condition and Figure 4 shows the same results for the variable rewards condition. Both models are able to simulate performance that is highly similar to the performance of our participants3. For both models, the simulations predict better performance for older than for younger adults in the variable rewards condition, although both models slightly over-predict performance for younger adults and under-predict performance for older adults.
Figure 3.

(a.) Simulation results for the Basic RL model in the consistent rewards condition. (b.) Simulation results for the Extended RL model in the consistent rewards condition. Error bars represent 95% confidence intervals.
Figure 4.

(a.) Simulation results for the Basic RL model in the variable rewards condition. (b.) Simulation results for the Extended RL model in the variable rewards condition. Error bars represent 95% confidence intervals.
As a final test of the RL models we used the Generalization Criterion Method (Ahn et al., 2008; Busemeyer & Wang, 2000; Yechiam & Busemeyer, 2005; Yechiam & Busemeyer, 2008) to assess the ability of each model to predict behavior in one condition (a generalization condition) using parameter estimates from participants who performed in another condition (a calibration condition). We had the consistent rewards condition represent the calibration condition and the variable rewards condition represent the generalization condition. Using parameter estimates from the consistent rewards condition we conducted 1,000 simulations in the variable rewards condition for each model and for both younger and older adults. Next we computed the mean squared error (MSE) between the average points earned by participants on each trial and the average points earned across all simulated trials. Lower values indicate a more reliable prediction for the amount of points participants earned on each trial. The MSE values for each model are listed in Table 2. These values are lower for the Basic RL model than for the Extended model for both younger and older adults which suggests parameter estimates from the simpler model may be more reliable as predictors for different tasks.
Best-Fitting Parameter Values
We next examined the estimated parameter values for younger and older adults. We first examined differences across both conditions and then within each condition (see Table 4). Across both conditions a Mann-Whitney U-test revealed a significant difference in α for the Basic RL model, U=746.00, p<.01. For the Extended RL model older adults had significantly larger αpos values than younger adults, U=859.00, p<.05, and significantly larger αneg values, U=584.50, p<.001. There were no age group differences in the value or autocorrelation inverse temperature parameters (all p>.10).
Table 4.
Average Best-Fitting Parameter Values for Each RL Model
| Younger Adults | Older Adults | |
|---|---|---|
| Consistent Rewards Condition | ||
| Basic RL Model | ||
| Learning Rate (α) | .48 (.43)* | .73 (.36)* |
| Value Inverse Temp. (βv) | 2.12 (4.02)* | .12 (.15)* |
| Autocorrelation Inverse Temp. (βA) | .45 (1.06) | .63 (.96) |
| Extended RL Model | ||
| Positive Learning Rate (αpos) | .55 (.48) | .74 (.42) |
| Negative Learning Rate (αneg) | .32 (.41)* | .61 (.41)* |
| Value Inverse Temp. (βv) | 3.38 (4.53)* | 1.12 (2.91)* |
| Autocorrelation Inverse Temp. (βA) | .47 (1.10) | .63 (1.02) |
| Variable Rewards Condition | ||
| Basic RL Model | ||
| Learning Rate (α) | .45 (.37) | .63 (.45) |
| Value Inverse Temp. (βv) | 1.63 (3.55) | 1.22 (3.01) |
| Autocorrelation Inverse Temp. (βA) | .74 (2.36) | .56 (2.21) |
| Extended RL Model | ||
| Positive Learning Rate (αpos) | .54 (.44) | .70 (.40) |
| Negative Learning Rate (αneg) | .33 (.39)** | .65 (.38)** |
| Value Inverse Temp. (βv) | 2.14 (3.90) | .80 (2.35) |
| Autocorrelation Inverse Temp. (βA) | .12 (2.46) | .32 (2.37) |
Note:
Significant age group difference at p<.05 level.
Significant age group difference at p<.01 level. Standard deviations are listed in parentheses.
Within the consistent rewards condition Mann-Whitney U-tests revealed a significant difference between groups in α for the Basic RL model U=165.50, p<.05. For the Extended RL model older adults had significantly larger αneg values than younger adults, U=135.00, p<.01, suggesting that recent negative events exerted greater influence on this group’s choices. However, while older adults’ data were also best fit by larger αpos values, the difference was not reliable, U=200.00, p=.052.
Within the variable rewards condition older adults’ data were best fit by larger α values for the Basic RL model, although the difference did not reach significance, U=212.00, p=.115. For the Extended RL model there was no age difference in estimated αpos values, U=226.00, p=.182, but there was a significant age difference in estimated αneg values, U=151.50, p<.01. We also examined whether larger estimated αneg values predicted better performance in this condition. A simultaneous regression with all four of the parameters for the Extended RL model entered as predictors and total cumulative points entered as the outcome variable revealed that estimated αneg values predicted better performance on the task, β=.34, p<.05. However, there was no relationship between αpos values and performance, β=.11, p=.53.
Prediction Errors Preceding Stay and Switch Trials
Next we examined prediction errors (δ) on trials that preceded “stay” and “switch” trials to examine responsiveness to recent events, corroborating the results of the modeling analysis. Because the Basic RL model provided a better fit to the data based on the more conservative BIC criterion and based on the results of the Generalization Criterion method test, we used the average best-fitting α value from the Basic RL model across both age groups to update expected values. Prediction errors were computed as in Equation 2 above4. Intuitively, a decision-maker sensitive to recent negative events would be more likely to switch from selecting a currently favored option after observing large negative prediction errors. To test this possibility, we assessed whether average prediction errors differed between groups on stay and switch trials.
Figure 5 depicts the average prediction errors on stay and switch trials for the option that was chosen on the previous trial. A 2 (age) × 2 (condition) × 2 (trial-type) repeated measures ANOVA showed a main effect of trial-type, F(1,92)=63.51, p<.001, η2=.408, a significant effect of age, F(1,92)=15.31, p<.001, η2=.143, and a significant age × trial-type interaction, F(1,92)=9.98, p<.01, η2=.098. There was no difference between age groups in average prediction errors on trials that preceded stay trials, t(94)=.76, p=.45, but average prediction errors on trials preceding switch trials differed significantly between groups, t(94)=−3.65, p<.001. Prediction errors for trials preceding switch trials were significantly larger in magnitude for older adults (M=−5.71, SD=4.97) than for younger adults (M=−2.26, SD=4.28). The age difference was significant within both the consistent rewards condition, t(46)= −3.29, p<.01, and the variable rewards condition, t(46)= −2.05, p<.05.
Figure 5.
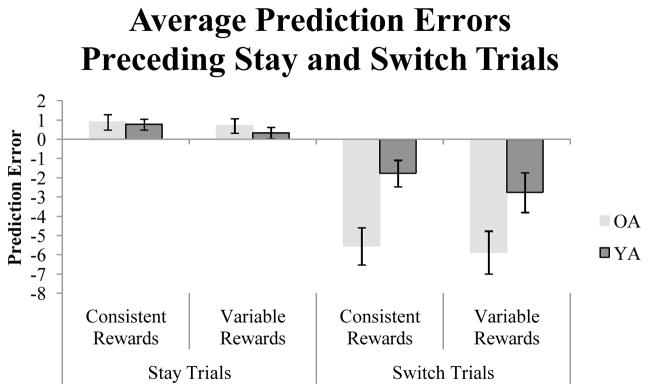
Average prediction errors on trials that preceded stay and switch trials. Error bars represent standard errors of the mean.
Discussion
Our results provide support for the hypothesis that older adults’ choice behavior is more responsive to recent events than that of younger adults. Despite no age-group differences in the proportion of times participants selected each option, older adults performed better in the variable rewards condition, where switching following steep declines in reward was advantageous. The computational modeling and average prediction error analyses revealed further evidence of age-based differences in responses to recent events during decision-making. Older adults utilized recent reward information to a significantly greater extent than younger adults in evaluating each option. These differences were most noticeable following large negative decreases in rewards, where older adults tended to shift immediately to the other option, while younger adults’ switches were not related to as steep of declines in reward.
There is emerging evidence that older adults learn more from negative than from positive feedback during learning and decision-making (Eppinger, Hammerer, & Lee, 2011; Eppinger & Kray, 2011; Frank & Kong, 2008; Hammerer, Li, Muller, & Lindenburger, 2010; Simon et al., 2010). Our results suggest that this focus on negative feedback extends to relative declines in reward magnitudes in addition to binary feedback (e.g. incorrect vs. correct, or loss versus no loss). However, it is important to note that our modeling results suggest that older adults were more sensitive negative trends overall, regardless of the valence.
However, changes in responsiveness to positive versus negative information that accompany healthy aging has been the source of some debate, with evidence of reduced brain activity in older adults in regions implicated in reward-based decision making when anticipating monetary losses, but not when anticipating monetary gains (Samanez-Larkin et al., 2007). Other work has found evidence for heightened anticipatory skin-conductance responses in high-performing older adults when selecting the advantageous options, which have net positive outcomes over trials, during the Iowa Gambling Task (Denburg, Tranel, & Bechara, 2005; Wood et al., 2005). Additionally, a prominent theory of how aging affects socioemotional functioning suggests that older adults focus on positive rather than negative cues in their environment (Carstensen, 1992). One explanation for these conflicting findings is that older adults may focus more on the positive aspects of their decisions when anticipating the outcomes, but focus more on negative information when processing feedback or evaluating the outcomes of their decisions (Eppinger et al., 2011; Eppinger, Kray, Mock, & Mecklinger, 2008).
Additionally, these results are not necessarily inconsistent with the extensive evidence for the “positivity effect” in older adults, whereby they engage in emotion regulation mechanisms to enhance memories for positive information and diminish memories for negative information (Mather & Carstensen, 2005). One interpretation of our finding that older adults tend to shift to a different option following sharp drops in reward is that older adults have a heightened tendency to avoid the possibility of selecting an option that is declining in value. This may be related to their tendency for stronger regulation against negative information.
While the present results reveal that older adults are more sensitive to recent negative events, future work is needed to pinpoint possible mechanisms underlying this apparent age difference. One prominent neurobiological theory proposes that the enhanced responsivity to negative feedback in older adults is at least partially due to age-related declines in dopamine levels, which enhance learning from negative outcomes (Frank & Kong, 2008). Additionally, working memory impairments are known to accompany older age which may be responsible for older adults’ reliance on more recent reward outcomes (Rypma & D’Esposito, 2000). However, our study did not directly address the link between working memory and decision-making behavior. Future work could examine this relationship and whether certain experimental manipulations might decrease older adults’ reliance on recent information.
This work also highlights the importance of applying computational models to behavioral data, particularly for special populations (e.g. Busemeyer & Stout, 2002; Yechiam et al., 2005). Decision-making is a complex task and gross measures of performance are often inadequate for providing a full account of behavior. We found that utilization of a Basic RL model, combined with more nuanced behavioral metrics uncovered a robust age-related difference in responsivity to recent events.
Table 3.
MSE Values from the Generalization Criterion Method
| Younger Adults | Older Adults | |
|---|---|---|
| Basic RL Model | 7.14 | 8.69 |
| Extended RL Model | 11.60 | 9.52 |
Acknowledgments
Research was funded by NIA grant AG043425 to WTM and DAW and NIDA grant DA032457 to WTM. We thank Anna Anthony for help with data collection.
Footnotes
Rewards were sampled using Matlab’s normrnd function which provides random arrays from a normal distribution. The actual observed values for System 1 were (M=54.12, SD=9.82), and for System 2 were (M=65.84, SD=10.70).
See also Otto, Markman, Gureckis, & Love (2010) for an alternative method of accounting for autocorrelation that was affected by a manipulation of motivational state.
The decline in cumulative reward during block 4 for both participants and the models is likely due to the Advantageous option providing smaller rewards on average during block 4 (M=64.5 units) than in blocks 2 (M=67.1 units) and 3 (M=68.5 units). Thus, the decline was at least partially attributable to sampling error in the reward distributions.
We also conducted the same analysis using several different values for α and the same general pattern shown in Figure 5 was observed regardless of what the α value was.
References
- Ahn WY, Busemeyer JR, Wagenmakers EJ, Stout JC. Comparison of decision learning models using the generalization criterion method. Cognitive Science. 2008;32:1376–1402. doi: 10.1080/03640210802352992. [DOI] [PubMed] [Google Scholar]
- Besedes T, Deck C, Sarangi S, Shor M. Age effects and heuristics in decision-making. The Review of Economics and Statistics. 2012;94:580–595. doi: 10.1162/REST_a_00174. [DOI] [PMC free article] [PubMed] [Google Scholar]
- Busemeyer JR, Stout JC. A contribution to cognitive decision models to clinical assessment: Decomposing performance in the Bechara Gambling Task. Psychological Assessment. 2002;14:253–262. doi: 10.1037//1040-3590.14.3.253. [DOI] [PubMed] [Google Scholar]
- Busemeyer JR, Wang Y. Model comparisons and model selections based on the generalization criterion methodology. Journal of Mathematical Psychology. 2000;44:171–189. doi: 10.1006/jmps.1999.1282. [DOI] [PubMed] [Google Scholar]
- Carstensen LL. Social and emotional patterns in adulthood: Support for socioemotional selectivity theory. Psychology and Aging. 1992;7:331–338. doi: 10.1037//0882-7974.7.3.331. [DOI] [PubMed] [Google Scholar]
- Castel AD, Rossi AD, McGillivray S. Beliefs about the “hot hand” in basketball across the adult lifespan. Psychology and Aging. 2012;27:601–605. doi: 10.1037/a0026991. [DOI] [PubMed] [Google Scholar]
- Collins AGE, Frank MJ. How much of reinforcement learning is working memory, not reinforcement learning? A behavioral, computational, and neurogenetic analysis. European Journal of Neuroscience. 2012;35:1024–1035. doi: 10.1111/j.1460-9568.2011.07980.x. [DOI] [PMC free article] [PubMed] [Google Scholar]
- Daw ND. Trial-by-trial data analysis using computational models (tutorial review) In: Delgado MR, Phelps EA, Robbins TW, editors. Decision making, affect, and learning: attention and performance. 1. XXIII. Oxford: Oxford UP; 2011. p. 3. [Google Scholar]
- Delis DC, Kramer JH, Kaplan E, Ober BA. California Verbal Learning Test: Adult Version Manual. San Antonio, TX: The Psychological Corporation; 1987. [Google Scholar]
- Denburg NL, Tranel D, Bechara A. The ability to decide advantageously declines prematurely in some normal older persons. Neuropsychologia. 2005;43:1099–1106. doi: 10.1016/j.neuropsychologia.2004.09.012. [DOI] [PubMed] [Google Scholar]
- Eppinger B, Kray J, Mock B, Mecklinger A. Better or worse than expected? Aging, learning, and the ERN. Neuropsycholgia. 2008;46:521–539. doi: 10.1016/j.neuropsychologia.2007.09.001. [DOI] [PubMed] [Google Scholar]
- Eppinger B, Hammerer D, Li SC. Neuromodulation of reward-based learning and decision making in human aging. Annals of the New York Academy of Sciences. 2011;1235:1–17. doi: 10.1111/j.1749-6632.2011.06230.x. [DOI] [PMC free article] [PubMed] [Google Scholar]
- Eppinger B, Kray J. To choose or to avoid: age differences in learning from positive and negative feedback. Journal of Cognitive Neuroscience. 2011;23:41–52. doi: 10.1162/jocn.2009.21364. [DOI] [PubMed] [Google Scholar]
- Frank MJ, Doll BB, Oas-Terpstra J, Moreno F. Prefrontal and striatal dopaminergic genes predict individual differences in exploration and exploitation. Nature Neuroscience. 2009;12:1062–1068. doi: 10.1038/nn.2342. [DOI] [PMC free article] [PubMed] [Google Scholar]
- Frank MJ, Kong L. Learning to avoid in older age. Psychology and Aging. 2008;23:392–398. doi: 10.1037/0882-7974.23.2.392. [DOI] [PubMed] [Google Scholar]
- Frank MJ, Moustafa AA, Haughey HM, Curran T, Hutchison KE. Genetic triple dissociation reveals multiple roles for dopamine in reinforcement learning. Proceedings of the National Academy of Sciences. 2007;104:16311–16316. doi: 10.1073/pnas.0706111104. [DOI] [PMC free article] [PubMed] [Google Scholar]
- Gureckis TM, Love BC. Learning in noise: Dynamic decision-making in a variable environment. Journal of Mathematical Psychology. 2009b;53:180–193. doi: 10.1016/j.jmp.2009.02.004. [DOI] [PMC free article] [PubMed] [Google Scholar]
- Hammerer D, Li SC, Muller V, Lindenburger U. Life span differences in electrophysiological correlates of monitoring gains and losses during probabilistic reinforcement learning. Journal of Cognitive Neuroscience. 2010;23:579–592. doi: 10.1162/jocn.2010.21475. [DOI] [PubMed] [Google Scholar]
- Heaton RK. A Manual for the Wisconsin Card Sorting Test. Odessa, Florida: Psychological Assessment Resources; 1981. [Google Scholar]
- Kovach CK, Daw ND, Rudrauf D, Tranel D, O’Doherty J, Adolphs R. Anterior prefrontal cortex contributes to action selection through tracking of recent reward trends. Journal of Neuroscience. 2012;32:8434–8442. doi: 10.1523/JNEUROSCI.5468-11.2012. [DOI] [PMC free article] [PubMed] [Google Scholar]
- Lau B, Glimcher PW. Dynamic response-by-response models of matching behavior in rhesus monkeys. Journal of the Experimental Analysis of Behavior. 2005;84:555–579. doi: 10.1901/jeab.2005.110-04. [DOI] [PMC free article] [PubMed] [Google Scholar]
- Lezak MD. Neuropsychological assessment. 3. New York: Oxford University Press; 1995. [Google Scholar]
- Maddox WT, Ashby FG. Comparing decision bound and exemplar models of categorization. Perception & Psychophysics. 1993;53:49–70. doi: 10.3758/bf03211715. [DOI] [PubMed] [Google Scholar]
- Mather M, Carstensen LL. Aging and motivated cognition: the positivity effect in attention and memory. TRENDS in Cognitive Sciences. 2005;9:496–502. doi: 10.1016/j.tics.2005.08.005. [DOI] [PubMed] [Google Scholar]
- McCullagh P, Nelder JA. Generalized linear models. 2. Boca Raton, FL: Chapman and Hall; 1999. [Google Scholar]
- Otto AR, Markman AB, Gureckis TM, Love BC. Regulatory fit and systematic exploration in a dynamic decision-making environment. Journal of Experimental Psychology: Learning, Memory, & Cognition. 2010;36:797–804. doi: 10.1037/a0018999. [DOI] [PubMed] [Google Scholar]
- Otto AR, Markman AB, Love BC. Taking More, Now: The Optimality of Impulsive Choice Hinges on Environment Structure. Social Psychological and Personality Science. 2012;3:131–138. doi: 10.1177/1948550611411311. [DOI] [PMC free article] [PubMed] [Google Scholar]
- Reitan RM. Validity of the Trail Making Test as an indicator of organic brain damage. Perceptual and motor skills 1958 [Google Scholar]
- Rypma B, D’Esposito M. Isolating the neural mechanisms of age-related changes in human working memory. Nature Neuroscience. 2000;3:509–515. doi: 10.1038/74889. [DOI] [PubMed] [Google Scholar]
- Samanez-Larkin GR, Gibbs SEB, Khanna K, Nielsen L, Carstensen LL, Knutson B. Anticipation of monetary gain bus not loss in healthy older adults. Nature Neuroscience. 2007;10:787–791. doi: 10.1038/nn1894. [DOI] [PMC free article] [PubMed] [Google Scholar]
- Schwarz G. Estimating the dimension of a model. The Annals of Statistics. 1978;6:461–464. [Google Scholar]
- Simon JS, Howard JHJ, Howard DV. Adult age differences in learning from positive and negative probabilistic feedback. Neuropsychology. 2010;24:534–541. doi: 10.1037/a0018652. [DOI] [PMC free article] [PubMed] [Google Scholar]
- Steingrover H, Wetzels R, Wagenmakers EJ. Validating the PVL-Delta model for the Iowa Gambling Task. Frontiers in Psychology. 2013;4:898. doi: 10.3389/fpsyg.2013.00898. [DOI] [PMC free article] [PubMed] [Google Scholar]
- Sutton RS, Barto AG. Reinforcement learning: an introduction. IEEE Transactions on Neural Networks. 1998;9:1054–1054. [Google Scholar]
- Vrieze SI. Model selection and psychological theory: A discussion of the differences between the Akaike information criterion (AIC) and the Bayesian information criterion (BIC) Psychological Methods. 2012;17:228–243. doi: 10.1037/a0027127. [DOI] [PMC free article] [PubMed] [Google Scholar]
- Wagenmakers EJ, Farrell S. AIC model selection using Akaike weights. Psychonomic Bulletin & Review. 2004;11:192–196. doi: 10.3758/bf03206482. [DOI] [PubMed] [Google Scholar]
- Wechsler D. Wechsler Adult Intelligence Scale. 3. San Antonio: Harcourt Brace & Company; 1997. [Google Scholar]
- Wood S, Busemeyer J, Koling A, Davis H, Cox CR. Older adults as adaptive decision-makers: Evidence from the Iowa Gambling Task. Psychology & Aging. 2005;20:220–225. doi: 10.1037/0882-7974.20.2.220. [DOI] [PubMed] [Google Scholar]
- Worthy DA, Maddox WT. Age-based differences in strategy-use in choice tasks. Frontiers in Neuroscience. 2012;5:1–10. doi: 10.3389/fnins.2011.00145. [DOI] [PMC free article] [PubMed] [Google Scholar]
- Worthy DA, Maddox WT, Markman AB. Regulatory fit effects in a choice task. Psychonomic Bulletin and Review. 2007;14:1125–1132. doi: 10.3758/bf03193101. [DOI] [PubMed] [Google Scholar]
- Worthy DA, Otto AR, Maddox WT. Working-memory load and temporal myopia in dynamic decision-making. Journal of Experimental Psychology: Learning, Memory, and Cognition. 2012;38:1640–1658. doi: 10.1037/a0028146. [DOI] [PMC free article] [PubMed] [Google Scholar]
- Worthy DA, Pang B, Byrne KA. Decomposing the roles of perseveration and expected value representation in models of the Iowa gambling task. Frontiers in Psychology. 2013;4:640. doi: 10.3389/fpsyg.2013.00640. [DOI] [PMC free article] [PubMed] [Google Scholar]
- Yechiam E, Busemeyer JR. Comparisons of basic assumptions embedded in learning models for experienced based decision making. Psychonomic Bulletin and Review. 2005;12:382–402. doi: 10.3758/bf03193783. [DOI] [PubMed] [Google Scholar]
- Yechiam E, Busemeyer JR. Evaluating generalizability and parameter consistency in learning models. Games and Economic Behavior. 2008;63:370–394. [Google Scholar]
- Yechiam E, Busemeyer JR, Stout JC, Bechara A. Using cognitive models to map relations between neuropsychological disorders and human decision making deficits. Psychological Science. 2005;16:973–978. doi: 10.1111/j.1467-9280.2005.01646.x. [DOI] [PubMed] [Google Scholar]