Abstract
With a globally aging population, the burden of care of cognitively impaired older adults is becoming increasingly concerning. Instances of Alzheimer’s disease and other forms of dementia are becoming ever more frequent. Earlier detection of cognitive impairment offers significant benefits, but remains difficult to do in practice. In this paper, we develop statistical models of the behavior of older adults within their homes using sensor data in order to detect the early onset of cognitive decline. Specifically, we use inhomogenous Poisson processes to model the presence of subjects within different rooms throughout the day in the home using unobtrusive sensing technologies. We compare the distributions learned from cognitively intact and impaired subjects using information theoretic tools and observe statistical differences between the two populations which we believe can be used to help detect the onset of cognitive decline.
Index Terms: Mild Cognitive Impairment, Unobtrusive Sensing Technologies, Older Population, Generalized Linear Models, Poisson Distribution
I. INTRODUCTION
Alzheimer’s disease is the sixth leading cause of death in North America [1]. Statistics show that one in nine Americans, and one in eleven Canadians, aged 65 and older have Alzheimer’s disease [2]. As the “baby boomer” generation ages, both the proportion and number of older adults with dementia is projected to increase dramatically, thus greatly increasing the burden of care. Early detection of the cognitive decline that precedes dementia is considered to be of great significance for many reasons. For subjects with remediable causes such as nutritional deficiencies or complications resulting from taking medication, early detection of cognitive decline can significantly increase the chances of recovery and prevent further decline. For subjects with irreversible conditions, early detection of cognitive decline still provides them and their families with an opportunity to proactively plan for their future by seeking the appropriate interventions that can enhance their daily functioning and reduce any emotional stress or fear [3].
Early stage cognitive decline is challenging to detect in the context of traditional doctor visits, as many of the subtle clues are difficult to spot. However, recent studies have shown that early changes in motor capabilities precede and may be indicative of a cognitive impairment [4], and that subjects with mild cognitive impairment exhibit a more variable and less consistent pattern of activity throughout the day [5]. Accordingly, and with the advancement in technology and the proliferation of smart systems, a good alternative to the traditional clinical paradigm is to bring assessment into the daily activity of a person in their home environment via unobtrusive sensors and smart systems.
Numerous smart systems have been developed to monitor the health and well-being of older adults and support their independence [6] [7]. However, these systems monitor the general health of the inhabitants and are not designed to detect cognitive changes. Other systems, such as [8], have been designed to monitor cognitive changes using a number of predefined measures extracted from sensors. However, this approach has been demonstrated to generalize poorly to new subjects and instead focuses on idiosyncratic nuances of the individual subjects [9].
To address this main issue, in this paper we develop statistical models of the subjects’ general activity in their homes by modeling the distribution of their arrival times at each room as independent inhomogenous Poisson processes. The resulting generalized linear models provide an intuitive statistical analysis and are hypothesized to generalize better to unseen subjects. We develop these models using sensor and clinical data pertaining to 68 subjects, that we received from the ORegon Center for Aging and TECHnology (ORCATECH). We take an information theoretic approach and use the kl-divergence measure to compare models pertaining to cognitively intact and impaired subjects. Intuitively, we postulate that there is a statistical difference in the distribution of arrival times between cognitively intact and impaired subjects.
The rest of the paper is organized as follows: Section II explains the data and how it was acquired. Section III describes our approach in building generalized linear models of home activity. Section IV presents and discusses preliminary results. Section V proposes potential future work and Section VI concludes the paper.
II. DATA ACQUISITION & LABELING
All data acquisition was done by ORCATECH who deployed sensing technologies in the homes of at least 300 subjects and monitored them unobtrusively for an average period of 3 years.
A. Participants and Data Acquisition
Participants were recruited from the Portland, Oregon, metropolitan area. The eligibility criteria included:
being a man or woman aged 80 years or older;
living independently in a larger than one-room “studio” apartment;
cognitively healthy (Clinical Dementia Rating (CDR) score < 0.5; Mini-Mental State Examination (MMSE) score > 24); and,
in average health for age (well-controlled chronic diseases and comorbidities or none at all).
Data were acquired by installing sensing technologies in the homes of the recruited subjects. In order to detect movement and general activity, passive infra-red motion sensors were installed in rooms frequently visited by the participating subjects. Visitors and absences from the home were tracked through wireless contact switches placed on the exit doors of the home. All sensor firings were sent wirelessly to a transceiver, time-stamped and recorded. For full details on data acquisition, the reader is referred to [10].
B. Labeling of Data
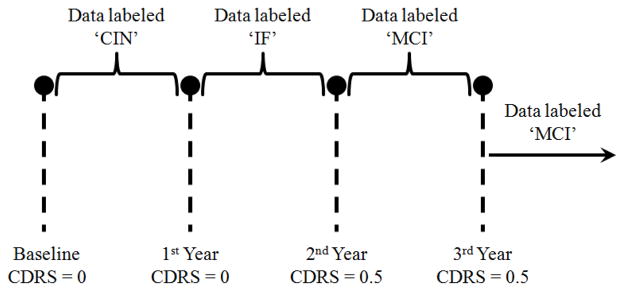
Participants were assessed in-home at baseline, and during annual in-home visits by research personnel who administered a standardized battery of tests, including the Mini-Mental State Examination (MMSE) and the Clinical Dementia Rating (CDR). CDR served as our ground truth and was used to determine if subjects were cognitively impaired or intact. A score of 0 on the CDR scale indicated cognitive intactness whereas a score of 0.5 on the CDR scale indicated mild cognitive impairment (MCI). Since subjects were assessed annually, data labeling fell into three categories:
cognitively intact (CIN),
in-flux or transitioning (IF), and
transitioned to mild cognitive impairment (MCI).
The labeling protocol that we implemented in assigning labels to the data is summarized in the example depicted by Fig. 1, which represents a subject who was monitored for at least 3 years and was administered three annual assessments besides baseline. The subject scored 0 on CDR scale at baseline, but scored 0.5 on the 2nd and 3rd year assessments. Therefore, the data from baseline up to the 1st year assessment were assigned the label ‘CIN’ and the data from the 2nd year assessment onward were assigned the label ‘MCI’. The data between the 1st year and the 2nd year assessments were assigned the label ‘IF’. This is because the conversion to cognitive impairment is not an instantaneous event but a very gradual process. Accordingly, the subject’s cognitive status would be in flux between years 1 and 2 and would belong to neither cognitive intactness nor MCI.
Fig. 1.

Example of a subject who scored 0.5 on CDR scale on the 2nd year assessment onward.
III. PROBLEM SETUP
In this section, we represent variables by lower case letters, e.g. u, vectors by bold lower case letters, e.g. u, and matrices by bold upper case letters, e.g. U. Suppose that a database consists of N subjects, each subject residing in a living unit with n rooms, and we are interested in building statistical models for each subject that would estimate the probability of the subject being present in a room within a fixed time interval throughout the day. Accordingly, the problem can be well-modeled as a Poission process, because a Poisson distribution models the number of occurrences of an event in a fixed period of time. In our case, the event is being present in a room. By defining a binary variable, y, that indicates absence (y = 0) or presence (y = 1) in a room, the probability of a subject arriving at a room can be given by
| (1) |
where λ is the Poisson distribution parameter.
However, note that in this problem, parameter λ would most likely vary throughout the day as the presence in each room is highly time dependent, and therefore an inhomogenous Poisson process would be a better model. To address the inhomogeneity, we divide a day into k intervals and define a λi for each interval where 1≤i≤k. Therefore, a day represented by a matrix X would look like the following:
| (2) |
where,
| (3) |
In other words, X takes the form of an identity matrix of size k×k, where each column represents a time interval, and each interval is associated with a λi. Consequently, if a subject was monitored for 900 days for example, then the subject’s input space would consist of a total number of m = 900×k vectors. Each vector would have a corresponding label y indicating whether the subject was present in the room during this time interval or not.
Accordingly, the problem becomes that of estimating the probability of a subject being present in a room given a time interval x(i) as an input. To do that, we need to find the λi’s corresponding to each interval, which we will represent by the vector λ. Accordingly, each room will be associated with a λ vector. Therefore, given a data set of m time intervals along with the corresponding labels represented by the vector , the goal is to find λ that would maximize the likelihood function L(y|λ),
| (4) |
However, maximizing (4) is equivalent to maximizing its log. Therefore,
| (5) |
As has been demonstrated and proven in [11], to estimate λ originating from an inhomogenous Poisson process, λ should be defined as a function that is monotonic, grows at least linearly, decays exponentially, and has a derivative. λi of the form ex(i)Tw meets these constraints, and consequently, the problem of finding λ turns into the problem of finding the weight vector w. Substituting this definition of λi in (5), we get
| (6) |
But since y(i) is binary, then y(i)! is always equal to 1 which in turn means that log(y(i)!) is always equal to 0. Accordingly, (6) becomes
| (7) |
Maximizing (7) is equivalent to minimizing the negative of it, i.e., minimizing
| (8) |
whose derivative is given by
| (9) |
Once w is found, λ is computed as λ = ew. Therefore, for a subject residing in a living unit with 5 rooms for example, who transitioned to MCI during the study, we would need to approximate 15 λ vectors, one for each room for when the subject is cognitively intact, when the subject’s cognition is in flux, and when the subject is cognitively impaired.
IV. PRELIMINARY RESULTS
Of the 68 subjects, 7 were males and 61 were females. Of the male subjects, 2 transitioned to MCI during the monitoring period, and of the female subjects, 13 transitioned to MCI during the monitoring period. In this section, we report preliminary results by building generalized linear models corresponding to four rooms: bedroom, bathroom, kitchen, and living room since these rooms exist in all houses and living units of any size. Accordingly, for each subject we estimated four Poisson distributions (λbdr, λbr, λk, and λlr) for each stage of cognition (cognitive intactness, in-flux or transitioning, and MCI). According to (1), for y = 1 the probability is directly proportional to λ. Therefore, a high λ is equivalent to a high probability.
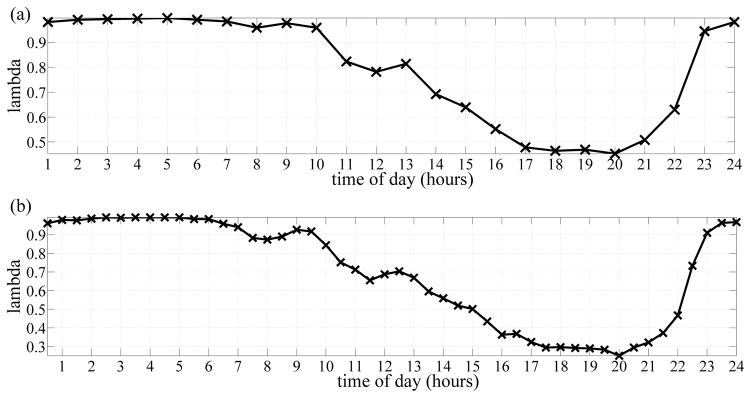
Initially, we developed these models for a number of subjects in order to determine the best k, the number of time intervals per day. Fig. 2a) shows the bedroom distribution for a cognitively intact subject using hourly intervals (k = 24) whereas Fig. 2b) shows the distribution using 30-minute intervals (k = 48). As Fig. 2 shows, the distribution estimated using 30-minute intervals appears smoother that the distribution estimated using hourly intervals. Intuitively, the shorter the interval length the smoother the distribution, but the higher the computational cost. However, the smoothness portrayed by Fig. 2b) was satisfactory and therefore, the rest of the results are based on k = 48 intervals.
Fig. 2.

a) Bedroom distribution for a subject estimated using hourly intervals. b) Bedroom distribution for the same subject estimated using 30-minute intervals.
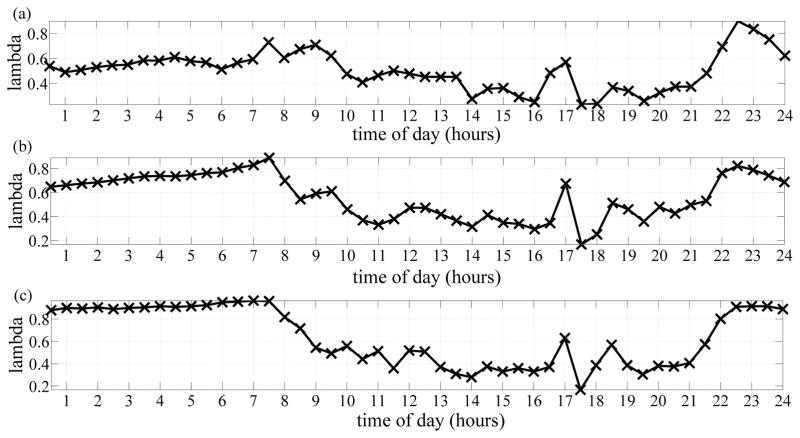
Fig. 3 depicts the bedroom distributions pertaining to a subject who transitioned to MCI during the monitoring period, where Fig. 3a) shows the distribution corresponding to the stage of cognitive intactness, Fig. 3b) shows the distribution corresponding to the stage of transitioning to MCI, and Fig. 3c) shows the distribution corresponding to the stage of MCI. From these distributions, we are able to visualize how likely the subject is to be present in the bedroom throughout the day. Furthermore, using these distributions, and distributions pertaining to other subjects who transitioned to MCI, we were able to extract important differences among the three distributions. One main observation was the distributions pertaining to the cognitive intactness stage were smoother than the distributions pertaining to the transitioning and the MCI stages. This is apparent in Fig. 3.
Fig. 3.
a) Bedroom distribution for a subject when cognitively intact. b) Bedroom distribution for the same subject when transitioning or in-flux. c) Bedroom distribution for the subject when cognitively impaired.
Another important observation was that we were able to extract few MCI symptoms such as disturbed sleep patterns which is clearly portrayed by the distributions in Fig. 3. Because the motion sensors utilized in this study were passive infra-red sensors, then they would fire only when the subject is actively present. Sleeping would not be detected by these sensors and that explains the low probability from 11PM – 7AM when the subject was cognitively intact. However, as the subject started transitioning to MCI, the probability of being present in the bedroom from 11PM – 7AM increased, and increased the most when the subject transitioned to MCI. This increase in probability of presence was potentially due to movements and activity related to disturbed sleep patterns which have been proven to be associated with MCI [12].
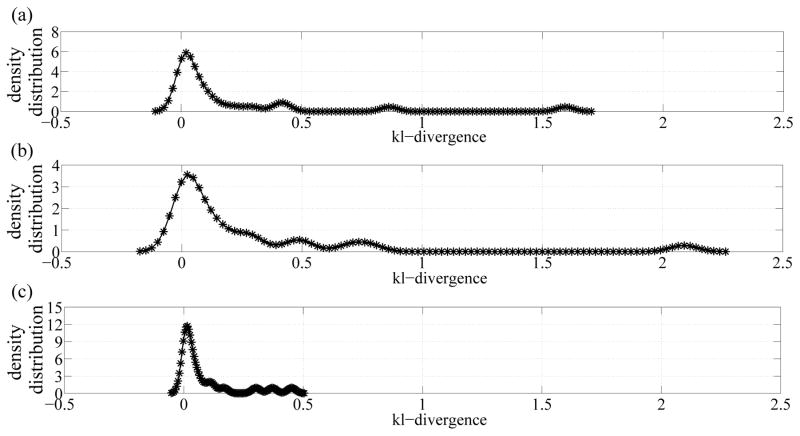
Finally, by taking an information theoretic approach, we computed the kl-divergence measure, which is a measure of difference, between the cognitive intactness and the transitioning distributions, between the cognitive intactness and MCI distributions, and between transitioning and MCI distributions for all subjects as depicted in Fig. 4. As shown in Fig. 4, an increasing trend is portrayed as we move from cognitive intactness to transitioning to MCI which implies that when subjects are transitioning, they exhibit behaviors and patterns closer to MCI than cognitive intactness.
Fig. 4.
Distributions of kl-divergence measures between a) cognitive intactness and transitioning distributions, b) cognitive intactness and MCI distributions, and c) transitioning and MCI distributions.
V. FUTURE WORK
Based on these promising results, for future work, we plan to further explore this approach by eliciting differences between cognitively intact models and cognitively impaired models using other metrics, such as entropy. Furthermore, since the clinical field is not a bastion of clarity on the definition of MCI [13], we plan to experiment with a set of neuropsychological assessments as our ground truth instead of CDR and compare the results. Finally, we also plan to explore augmenting these models with other features such subjects’ age, gender, and the number of times a subject visits a room instead of a binary presence or absence.
VI. CONCLUSION
In this paper we presented an alternative approach to that of existing studies on smart systems developed to monitor cognitive decline. Our simple approach is more generalizable than existing approaches which tend to overfit the data from individual subjects. We developed a statistical model of the presence of a subject within a room as an inhomogeneous Poisson process. We built generalized linear models for four rooms - bedroom, bathroom, kitchen, and living room - using data from 68 subjects, 15 of which transitioned to MCI during the monitoring period. Most importantly, using the learned models, were were able to observe statistical differences between the behavior of cognitively impaired and intact subjects that could potentially assist in the early detection of cognitive impairment and dementia.
Footnotes
This work was supported by P30AG024978 Oregon Roybal Center for Translational Research on Aging, P30AG008017 Oregon Alzheimer’s Disease Center, R01AG024059 BRP, ISAAC Intelligent Systems for Assessing Aging Changes, and Intel Corporation BRP.
Contributor Information
Ahmad Akl, Email: ahmad.akl@utoronto.ca.
Jasper Snoek, Email: jsnoek@seas.harvard.edu.
Alex Mihailidis, Email: alex.mihailidis@utoronto.ca.
References
- 1.Hoyert DL, Xu J. Deaths: Preliminary data for 2011. National Vital Statistics Report. 2012;61(6):1–52. [PubMed] [Google Scholar]
- 2.Gaugler J, James B, Johnson T, Scholz K, Weuve J. 2013 alzheimers disease facts and figures. Alzheimer’s Association. 2013;9(2):1–71. [Google Scholar]
- 3.Boise L, Camicioli R, Morgan DL, Rose JH, Congleton L. Diagnosing dementia: Perspectives of primary care physicians. The Gerontologist. 1999;39(4):457–464. doi: 10.1093/geront/39.4.457. [DOI] [PubMed] [Google Scholar]
- 4.Camicioli R, Howieson D, Oken B, Sexton G, Kaye J. Motor slowing precedes cognitive impairment in the oldest old. Neurology. 1998;50(5):1496–1498. doi: 10.1212/wnl.50.5.1496. [DOI] [PubMed] [Google Scholar]
- 5.Hayes TL, Abendroth F, Adami A, Pavel M, Zitzelberger TA, Kaye JA. Unobtrusive assessment of activity patterns associated with mild cognitive impairment. Alzheimer’s and Dementia. 2008;4(6):395–405. doi: 10.1016/j.jalz.2008.07.004. [DOI] [PMC free article] [PubMed] [Google Scholar]
- 6.Ohta S, Nakamoto H, Shinagawa Y, Tanikawa T. A health monitoring system for elderly people living alone. Journal of Telemedicine and Telecare. 2002;8(3):151–156. doi: 10.1177/1357633X0200800305. [DOI] [PubMed] [Google Scholar]
- 7.Sixsmith AJ. An evaluation of an intelligent home monitoring system. Journal of Telemedicine and Telecare. 2000;6(2):63–72. doi: 10.1258/1357633001935059. [DOI] [PubMed] [Google Scholar]
- 8.Dawadi P, Cook D, Schmitter-Edgecombe M. Automated cognitive health assessment using smart home monitoring of complex tasks. Systems, IEEE Transactions on Systems, Man, and Cybernetics. 2013 Nov;43(6):1302–1313. doi: 10.1109/TSMC.2013.2252338. [DOI] [PMC free article] [PubMed] [Google Scholar]
- 9.Akl A, Taati B, Mihailidis A. Autonomous unobtrusive detection of mild cognitive impairment in older adults. submitted to the IEEE Transactions on Biomedical Engineering. 2014 doi: 10.1109/TBME.2015.2389149. [DOI] [PMC free article] [PubMed] [Google Scholar]
- 10.Kaye JA, Maxwell SA, Mattek N, Hayes TL, Dodge H, Pavel M, Jimison HB, Wild K, Boise L, Zitzelberger TA. Intelligent systems for assessing aging changes: Home-based, unobtrusive, and continuous assessment of aging. The Journals of Gerontology Series B: Psychological Sciences and Social Sciences. 2011;66B(suppl 1):i180–i190. doi: 10.1093/geronb/gbq095. [DOI] [PMC free article] [PubMed] [Google Scholar]
- 11.Paninski L. Maximum likelihood estimation of cascade point-process neural encoding models. Network: Computation in Neural Systems. 2004;15(4):243–262. [PubMed] [Google Scholar]
- 12.Hita-Yañez E, Atienza M, Gil-Neciga E, Cantero JS. Disturbed sleep patterns in elders with mild cognitive impairment: The role of memory decline and apoe ε4 genotype. Current Alzheimer Research. 2012;9(3):290–297. doi: 10.2174/156720512800107609. [DOI] [PubMed] [Google Scholar]
- 13.Petersen RC. Mild cognitive impairment as a diagnostic entity. Journal of Internal Medicine. 2004;256(3):183–194. doi: 10.1111/j.1365-2796.2004.01388.x. [DOI] [PubMed] [Google Scholar]


