Abstract
Structural biology, in particular the structure determination of viruses and other large macromolecular complexes leads to data- and compute-intensive problems that require resources well beyond those available on a single system. Thus, there is an imperative need to develop parallel algorithms and programs for clusters and computational grids. We present one of the most challenging computational problems posed by the three-dimensional structure determination of viruses, the orientation refinement.
1. Introduction and Motivation
Viruses are large macromolecules that cause a variety of human, animal, and plant diseases. A virus consists of a nucleic acid genome, a protein shell or capsid, and sometimes a membrane or envelope, which can enclose or be enclosed by the capsid.
Viruses differ in terms of the genome, shape, size, molecular mass, and the number of proteins in the capsid. The genome consists of either single or double-stranded RNA or DNA. There are spherical, helical and more complex shapes of viruses. Viruses range in size from as little as 150 to 2,000 Å or more. The molecular masses of viruses differ; for example, picornaviruses have a mass of about 8. 5 × 10⁶ daltons about 30% of which is due to one RNA molecule of about 8, 000 nucleotides. In contrast, alphaviruses like Sindbis virus, have a mass of about 50 × 106 daltons including a genome consisting of about 12,000 nucleotides [25].
Because of symmetry of the protein shell, a relatively small number of identical building blocks recognize each other and are able to assemble together spontaneously. The principle of genetic economy requires that the shell be built out of multiple copies of identical units; the amount of genetic information, thus the size of the genome, is considerably smaller for a symmetric virus particle. For example, one of the smallest known viruses, the satellite tobacco necrosis virus has a diameter of 180 Å, a protein shell of 60 sub-units, and its RNA is very small, about 1, 120 nucleotides [3].
Viruses infect healthy cells by attaching to them, then delivering their nucleic acid into the cell. A virus has to locate a specific docking site on a host cell. The information about the structure of the capsid is critical in determining the pharmaceutical compounds that can block the virus binding site. Thus, the structure of viruses is not only of scientific interest but it has the potential to lead to discovery of antivirals for the prevention and treatment of plant, animal, and human diseases.
2. Structure Determination in Cryo-TEM
Electron microscopy is a widely used method to obtain the structure of viruses at low to moderate resolution [2], [7], [8], [9], [11], [15], [23]; X-ray crystallography has traditionally been used for high resolution structure determination at resolutions of 3 Å or better. However crystallization of large macromolecules like viruses is extremely challenging, and hence there is a desire to push the limits of electron microscopy and extend the resolutions of structure determination to the 5 Å range.
In cryo-transmission electron microscopy (cryo-TEM) a solution containing virus particles is vitrified at liquid nitrogen temperatures and the sample is placed inside the microscope where it is irradiated with an electron beam that forms an image on film or on a CCD. An entire micrograph consists of real images(2D projections) of many identical virus particles frozen in the sample in different orientations [22].
Reconstructing the 3D image of the virus from the 2D projections is conceptually similar to Computed-Aided Tomography (CAT) [13], [14], [16]. The notable difference is that the orientations and centers of the 2D images are known in CAT (the patient is in a fixed position and the images are taken at known angles of the X-ray source) while in cryo-TEM virus particles are frozen in the solution at random orientations. Moreover, we assume that all virus particles frozen in the sample are identical thus we have many 2D projections of a single object whose 3D electron density we wish to reconstruct. In CAT we have multiple 2D images of a single object.
The procedure for 3D structure determination in cryo-TEM consists of the following steps:
Step A Extract individual particle projections from micrographs and identify the center of each projection.
Step B Determine the orientation of each projection.
Step C Carry out the 3D reconstruction of the electron density of the macromolecule.
Step D Dock an atomic model into the 3D electron density map.
Steps B and C are executed iteratively until the 3D electron density map cannot be further improved at a given resolution; then the resolution is increased gradually. The number of iterations for these steps is in the range of hundreds and one cycle of iteration for a medium size virus may take several days. Typically it takes months to obtain a high resolution electron density map. Then Step D of the process can be pursued.
Best results in obtaining high resolution electron density maps are often obtained in the case of highly symmetrical particles such as icosahedral viruses because the high symmetry leads to redundancies in the Fourier transform data and that, in turn, aids the orientation search process.
It was estimated that approximately 2000 particle images are necessary for the reconstruction of a virus with a diameter of 1000 Å at 10 Å resolution [24], and recent results at 7–9 Å resolution for the Hepatitis B virus capsid [4], [5] have confirmed this estimate.
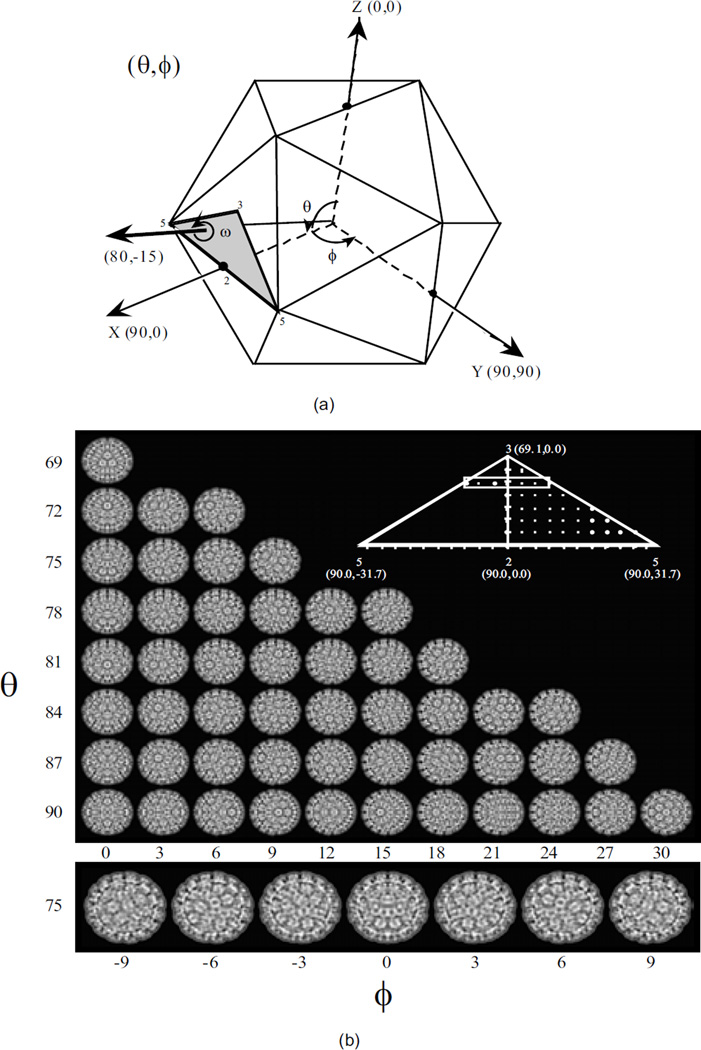
In this paper we are concerned only with step B of the process described above, i.e., the orientation refinement. To determine the orientation of a view of a virus particle extracted from a micrograph, we project the current reconstructed electron density at different orientations and then compare the experimental image with the calculated projections. The unknown orientation θ, ϕ, ω, see Figure 1, is then determined to be the orientation of the calculated projection of the best fit.
Figure 1.
(a) The three angles used to characterize the orientation of a view. (b) The set of calculated views for an icosahedral virus at a 3° angular interval.
When the symmetry is known, the search process for orientation determination is restricted to a relatively small angular domain (the asymmetric unit as depicted in Figure 1(a)). We consider the more challenging case when the information regarding the symmetry of the virus particle is not available. The advantage of the method described in this paper is that one could use it not only to determine the structure of the symmetric protein shell, but also the structure of asymmetric objects. Moreover, if the virus exhibits any symmetry this method allows us to determine its symmetry group.
Previous parallel orientation refinement programs such as the one reported in [17] took advantage of the embarrassingly parallel nature of the traditional algorithm. Our algorithm is radically different. It does not make any assumption about the symmetry of the object, it performs calculations in Fourier Space, it is based upon a multi-resolution search, and a sliding window mechanism discussed for the first time in [1]. The orientation refinement algorithm is used in conjunction with our 3D reconstruction algorithm in Cartesian coordinates for objects without symmetry [18], [20], [21].
3. Problem Formulation
We use the following terms and notations:
D is the current version of electron density map of size l3.
𝒟 = DFT(D) is the 3D Discrete Fourier Transform (DFT) of the electron density map.
𝒞 is a set of 2D planes of 𝒟 obtained by interpolation in the 3D Fourier domain.
ℰ = {ℰ1, … ℰq, … ℰm} with 1 ≤ q ≤ m is a set of m experimental views; each view is of size l × l pixels.
ℱ = {ℱ1, …. ℱq, … ℱm} is the set of 2D DFTs of experimental views. Here ℱq = DFT(ℰq) for 1 ≤ q ≤ m.
is the set of initial orientations, one for each view.
is the set of refined orientations, one for each view.
P is the number of nodes available for program execution. Parallel I/O could reduce the I/O time but in our algorithm we do not assume the existence of a parallel file system. To avoid contention, a master node typically reads an entire data file and distributes data segments to the nodes as needed.
Given a 3D lattice D of size l3 we define a z-slab of size zslabsize to be a set of consecutive zslabsize xy-planes. One can similarly define x-slab and y-slab.
The resolution of the electron density map is denoted by rmap. In the reconstruction process we use only the Fourier coefficients up to .
The angular resolution is denoted by rangular.
Given: (1) a set of m views and (2) the electron density map, the goal is to find the orientation of each view.
Several methods including the method of “common lines”, [2] can be used to this end. Here we describe a procedure for the refinement of orientations that is less sensitive to the noise caused by experimental errors. The basic idea is to project the electron density at known angles and then to compare each experimental view with the calculated projection. Once we define the distance between an experimental view and a calculated projection, the goal of the search is to identify the calculated projection at the minimum distance from the experimental view. The procedure does not make any assumptions about the symmetry, but can detect symmetry if one exists.
We are only concerned here with the orientation refinement, in other words we are given a rough estimation of the orientation, say at 3° angular resolution and our goal is to reach a resolution of say 0.01° or better.
This paper describes an algorithm where the search is conducted in the Fourier domain. We first perform a 2D Discrete Fourier Transform (DFT) of the experimental view, ℱ, apply a Contrast Transfer Function (CTF) correction to it, and then compare it with a cut at a precise orientation through the 3D DFT of the electron density map, 𝒞.
A correction of the experimental data used for the 3D structure determinations is necessary. The relationship between the electron image of a specimen and the specimen itself isin part affected by the microscope CTF [2]. The Defocusing, which is used to enhance phase contrast and thereby enables the visualization of unstained specimens [2], must be compensated for in the reconstruction, in order to achieve a reliable representation of the structure. The CTF is an oscillatory function that produces phase reversal and attenuates amplitudes in the DFT of a TEM image. The effects of the transfer function become more pronounced at progressively higher resolutions. One can correct the transfer function by means of a variety of filtering methods [12].
In this algorithm the distance between two l × l arrays of complex numbers:
and 𝒞 = [cj,k + idj,k]1≤j,k≤l, with . is computed as:
To give more weight to higher frequency components at higher resolution (large radius in the Fourier domain) while computing the distance, we can apply a weighting function wt(j, k) to d(ℱ, 𝒞).
To determine the distance, d(ℱ, 𝒞) at a given resolution we use only the Fourier coefficients up to thus the number of operations is reduced accordingly.
The algorithm is embarrassingly parallel, each experimental view can be processed independently by a different processor. But the 3D electron density map and its DFT can be very large; the database of calculated views could require several TBytes of data and the electron density may need several Gbytes of storage.
The size of the search space 𝒫 is very large; if the initial orientation of an experimental view, ℰq is given by Oq = {θq, ϕq, ωq} then the cardinality of the set 𝒫 is:
This step requires 𝒪(l2 × |𝒫|) arithmetic operations. For example, if rangular = 0.1° and the search range is from 0 to π for all three angles, then the size of the search space is very large: |𝒫| = (1800)3 = 5.832 × 10⁹.
Figure 1(b) shows that the corresponding size for an icosahedral particle at 3° angular resolution consists of only 51 calculated views; at 0.1° the size of the search space is about 4, 000 calculated views, [2]. Thus, for an asymmetric particle the size of the search space increases by six (6) orders of magnitude compared with an icosahedral particle !! Moreover, when comparing two views of an icosahedral virus particle, a calculated and an experimental one, we could use only a shell of thickness corresponding to the capsid, rather than the entire 2D image.
4. A SlidingWindow Multi-Resolution Parallel Orientation Refinement Algorithm
The orientation refinement is a multi-resolution process. Typically, we carry out several refinement steps at different angular resolutions, e.g., one at rangular = 1° followed by one at rangular = 0.1°, one at rangular = 0.01°, and finally one at rangular = 0.002°. The advantage of this approach is clearly illustrated by an example: assume that the initial value is say θ = 65°, the search domain is 60° to 70° and we require an angular resolution of 0.002°. A one step search would require 5000 matching operations versus 35 for a multi-resolution matching. The orientation of an experimental view is given by three angles (θ, ϕ, ω), therefore the multi-resolution approach reduces the number of matching operations for a single experimental view by almost four orders of magnitude. As pointed out earlier, several thousand experimental views are needed for the reconstruction of the 3D electron density map at a high resolution. A matching operation consists of two steps (1) construct a cut into 𝒟 with a given orientation and (2) compute the distance between the 2D DFT of the experimental view, ℱq, and the cut.
The search domain at a given angular resolution is extended whenever the best fit occurs near the edge of the search domain. This sliding-window approach increases the number of matching operations, but at the same time improves the quality of the solution. A similar strategy is used for refining the centers of the experimental images.
The orientation refinement algorithm consists of the following steps:
Step a. Construct 𝒟, the 3D Discrete Fourier Transform, DFT, of the electron density map.
Step (a.1) The master node reads all z-slabs of the entire electron density map D.
Step (a.2) The master node sends to each other node a z-slab of the electron density map D of size .
Step (a.3) Each node carries out a 2D DFT calculation along the x- and y-directions on its z-slab.
Step (a.4) A global exchange takes place after the 2D DFT calculation and each node ends up with a y-slab of size tslab.
Step (a.5) Each node carries out a 1D DFT along the z-direction in its y-slab.
Step (a.6) Each node broadcasts its y-slab.
After the all-gather operation each node has a copy of the entire 𝒟. To perform calculations at resolution rmap we only keep a subset of the 𝒟, within a sphere of radius .
This step requires a total of 𝒪(l3 × log2l) arithmetic operations and 𝒪 (l3) words of memory in each node.
Step b. Read in groups of views, ℰ, from the file containing the 2D views of the virus, and distribute them to all the processors. The amount of space required to store the experimental views on each processor is: m′ × (b × l2) with b the number of bytes per pixel. In our experiments b = 2.
Step c. Read orientation file containing the initial orientations of each view, . Distribute the orientations to processors such that a view ℰq and its orientation , 1 ≤ q ≤ m, are together.
At a given angular resolution we perform the following operations for each experimental view ℰq, 1 ≤ q ≤ m:
Step d. Compute ℱq. Each processor carries out the transformation of the m′ views assigned to it.
This step requires 𝒪(l2 × log2l) arithmetic operations for each experimental view and 𝒪 (l2) words of memory for the data.
Step e. Perform the CTF-correction of the DFT of each view ℱq, 1 ≤ q ≤ m.
Note that the views originated from the same micrograph have the same CTF. This step requires 𝒪 (l2) operations for each experimental view.
Step f. Given:
the experimental view ℰq with the initial orientation ,
- the search domain,
Construct a set of 2D-cuts of 𝒟, the 3D-DFT of electron density map by interpolation in the 3D Fourier domain. Call the set of planes spanning the search domain for ℰq. Call the orientation of the cut .
Call w the number of calculated cuts in 𝒟 for a given angular search range and angular resolution. w = wθ × wϕ × wω. Typical values are wθ = wϕ = wω = 10, thus w = 1000.
This step requires 𝒪(w × l2) arithmetic operations for each experimental view.
Step g. Determine the distance of ℱq to every ,
This step requires 𝒪(w × l2) arithmetic operations for each experimental view.
Step h. Compute the minimum distance:
Call the orientation of the cut ,
This step requires 𝒪(w) arithmetic operations for each experimental view.
Step i. If any of the three angles corresponding to this minimum distance cut, is near the edge of the original search domain defined in step (f), redefine the search domain. Make the center of the new search domain, and repeat steps (f), (g), and (h).
Call nwindow the number that we slide the window. Then the total number of operations required for each view in steps (f), (g), and (h) is: 𝒪(nwindow × w × l2).
Step j. Assign to experimental view ℰq the orientation of this minimum distance cut, .
Step k. Refine the position of the center of the 2D DFT. Move the center of ℰq, within a box of size 2δcenter using the current orientation and determine the best fit with the minimum distance cut .
For each new value of the center , determine the distance to :
Find the minimum distance:
where ncenter is the number of center locations considered. For example, if we use a 3 × 3 box ncenter = 9.
If the is near the edge of the search box redefine the search box. Make the center of a new search box, and repeat step k. Then, the total number of operations required for each view in this step is: .
Step l. Correct ℰq to account for the new center.
Step m. Wait for all nodes to finish processing at a given angular resolution.
Step n. Repeat the computation for the next angular resolution until the final angular resolution is obtained. Then: is the set of refined orientations, one for each view.
Step o. Write the refined orientation file.
As pointed in Section 3 the structure determination is an iterative process. Given a resolution rmap we use the refined orientations and the new centers to reconstruct the electron density map. The new map is used again for another step of orientation refinement and the process continues until we cannot further refine the structure at that particular resolution. Then we increase the resolution and repeat the entire procedure.
5. Experimental Results
Our objectives were threefold: (a) to verify the correctness of our results, (b) to determine our ability to increase the resolution of the structure determination using the new algorithms, and (c) to obtain some indication about the performance of our programs.
We present results regarding two virus structures, those of Sindbis and reo viruses [10]. The experimental data for the Sindbis virus consist of 7,917 views of 221 × 221 pixels each; the highest resolution obtained using existing algorithms is 11.2 Å. The experimental data for the reo virus consist of 4,422 views of 511 × 511 pixels each; the highest resolution obtained using existing algorithms is 8.6 Å.
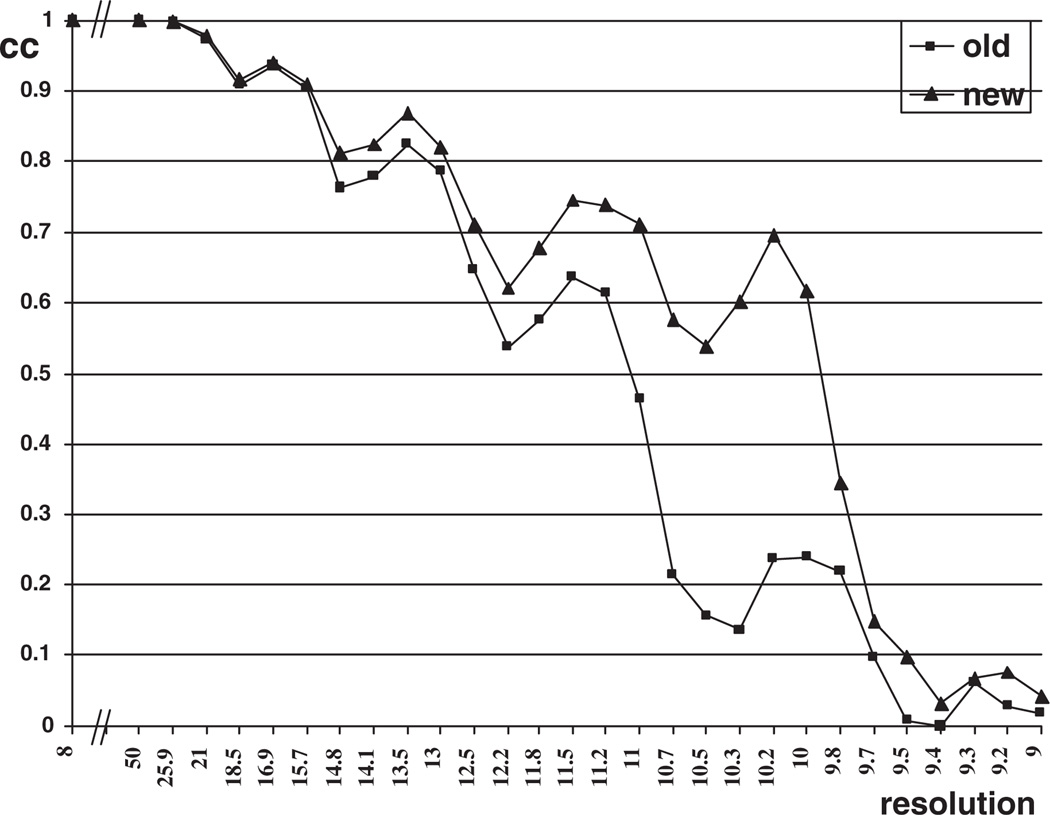
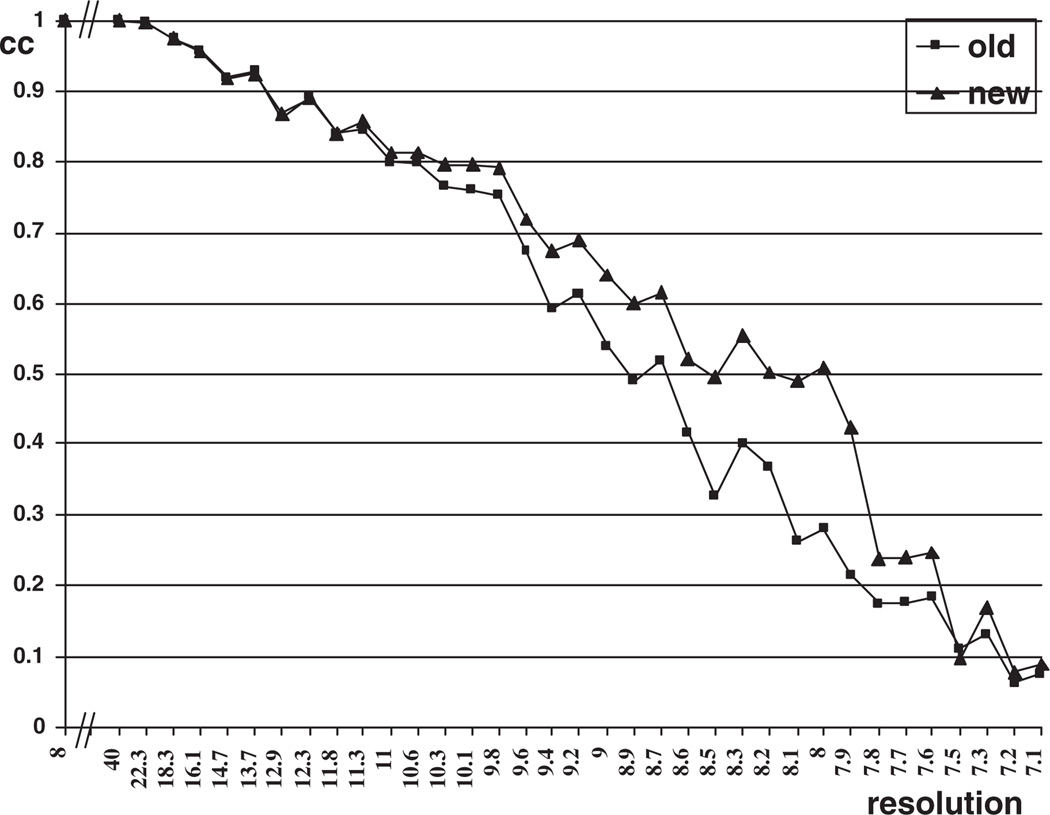
We used our new algorithm to refine the orientation of these data for angular resolutions rangular = 1°, 0.1°, 0.01° and 0.002°, and with center resolution δcenter = 1 pixel, 0.1 pixel, 0.01 pixel and 0.002 pixel. In our calculations we reached a resolution of 10.0 Å for the Sindbis virus and 8.0 Å for the reo virus, see Figures 5 and 6.
Figure 5.
Correlation-coefficient plot for Sindbis virus.
Figure 6.
The correlation-coefficient plot for reo virus.
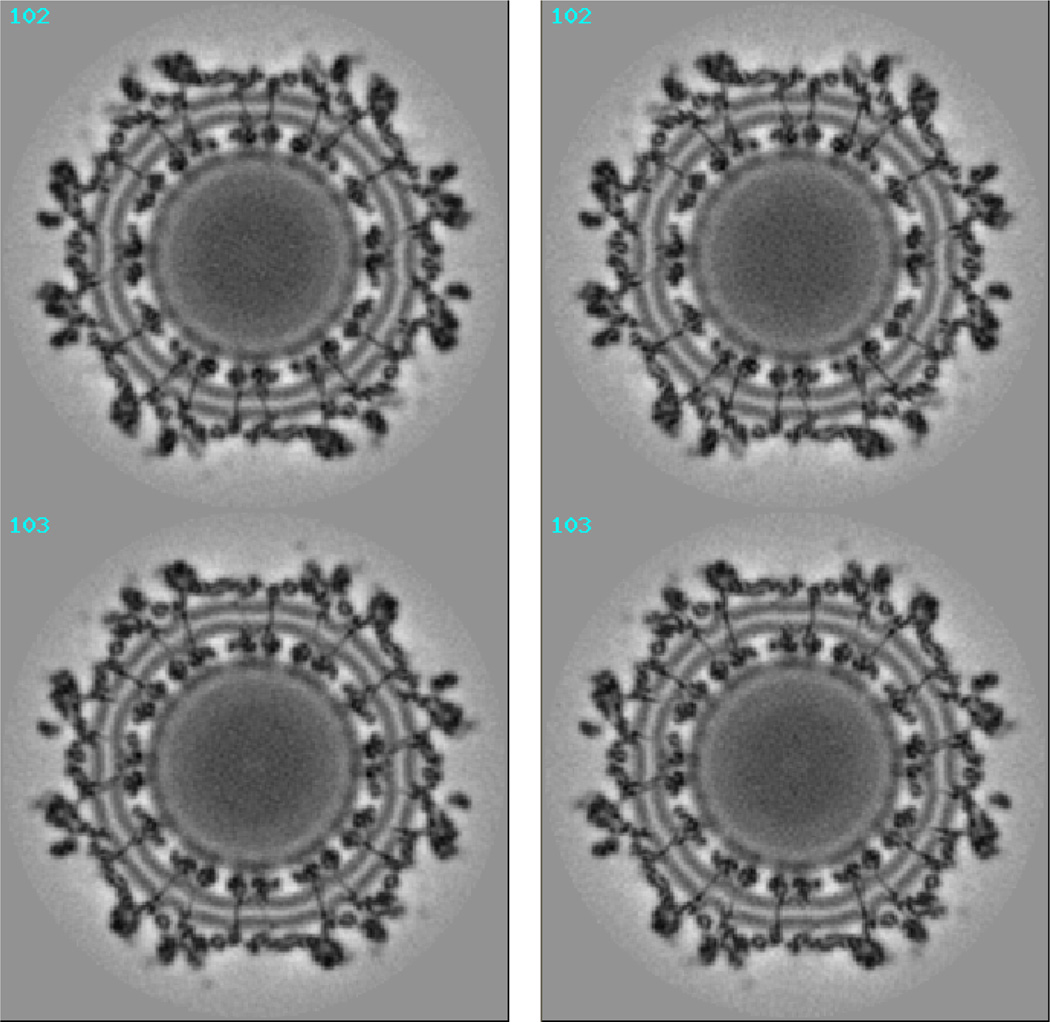
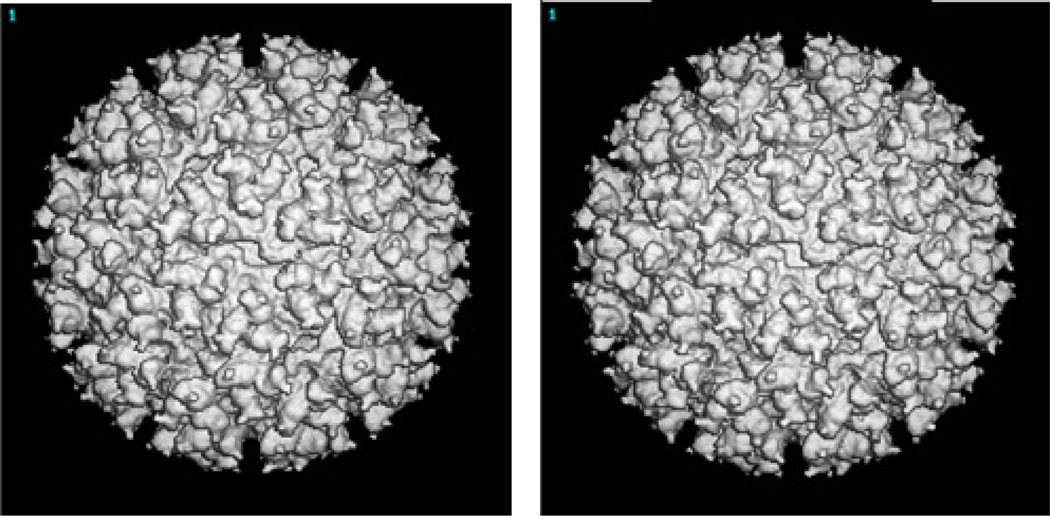
The first objective was achieved by comparing our results with those using existing algorithms. Figure 2 shows the cross sections 102–103 of the 3D electron density map of Sindbis virus, reconstructed with its old orientation and with our new refined orientation respectively. Figure 3 shows the 3D density map of Sindbis virus, reconstructed with its old orientation and with our new refined orientation respectively. Though differences in the two maps are difficult to visualize directly in low magnification views, high magnification views do reveal more details in the new density map.
Figure 2.
Cross sections 102–103 of the 3D electron density map of Sindbis virus obtained with its old orientation (left) and the orientation produced by our new algorithm (right).
Figure 3.
3D electron density map of Sindbis virus obtained with its old orientation (left) and our new refined orientation(right).
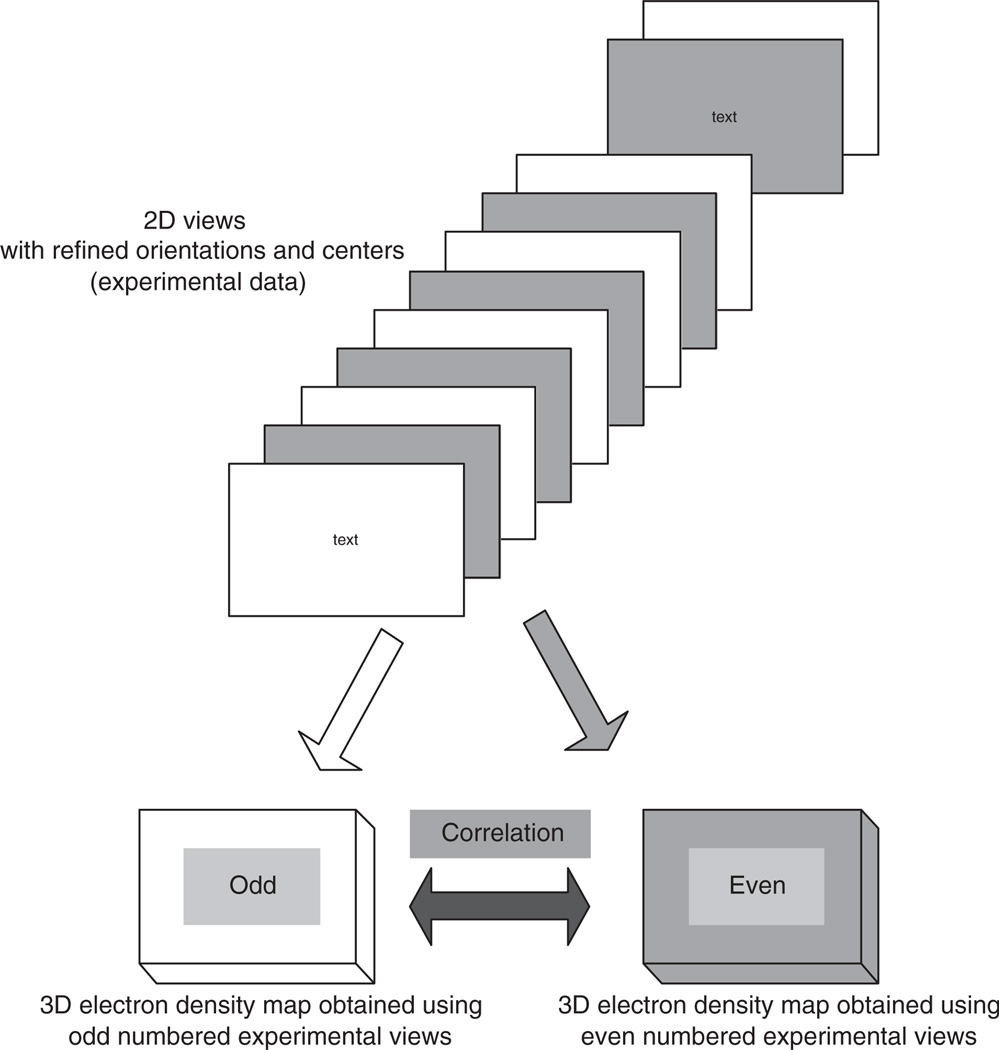
To test the resolution achieved, we use the procedure illustrated in Figure 4. After the last step of the orientation refinement at a given resolution we compute two 3D reconstructions, one using only odd numbered experimental views and the other, even numbered views. Then we determine the correlation between the two maps. Figure 5 shows a plot of the correlation coefficients for the new reconstructed maps compared with the one based upon previously determined orientations for the Sindbis virus. Figure 6 shows a plot of the correlation coefficients for the new reconstructed maps compared with the one based upon previously determined orientations for the reo virus.
Figure 4.
The procedure used to determine the resolution of the electron density map.
Figures 5 and 6 indicate that the new orientation refinement method gives higher correlation coefficients and hence enables us to reconstruct electron density maps at higher resolution.
To determine the highest resolution we examine the plot of the correlation coefficient versus resolution and determine the crossing point of the graph and the 0.5 line. A correlation coefficient higher than 0.5 gives a conservative estimate of the final resolution of the entire density map. Figure 5 shows that the graph corresponding to the new method crosses the 0.5 line at 10.0 Å versus 11.2 for the old method. Figure 6 shows that the correlation coefficient for new method goes below 0.5 at 8.0 Å while the one for the old method does the same at 8.7 Å.
Finally, we evaluated the performance of our new algorithms. We tested our program on a 64-node IBM SP2 system, with each node having four processors and 2 GB of memory. The four processors in each node share the node’s main memory and communicate using MPI.
Our parallel orientation refinement and parallel 3D reconstruction program run on 16 processors for these two data sets. Tables 1 and 2 show the time for different steps of the orientation refinement process for one iteration of structure determination for the Sindbis and the reo virus. Tables 1 and 2 show that 99% of the time for orientation refinement, is spent in matching the experimental views with the 2D-cuts of 𝒟. The execution time for 3D reconstruction for the Sindbis virus is 4,575 seconds and for the reo virus is 7,933 seconds. The 3D reconstruction time represents less than 5% of the total time per cycle. Moreover we see in some instances the sliding window mechanism activated, for example, at 0.01° instead of 9 matchings (search range) we needed 15 for the Sindbis virus and 11 for the reo virus.
Table 1.
The time for different steps of the orientation refinement process for the structure determination of Sindbis virus.
| Angular resolution (°) | 1 | 0.1 | 0.01 | 0.002 |
| Search range | 9 | 9 | 15 | 9 |
| 3D DFT (s) | 19 | 15 | 13 | 13 |
| Read image (s) | 246 | 152 | 158 | 155 |
| FFT analysis (s) | 46 | 46 | 46 | 46 |
| Orientation refinement (s) | 14,053 | 14,109 | 71,065 | 26,901 |
| Total time (s) | 14,364 | 14,308 | 71,282 | 27,116 |
Table 2.
The time for different steps of the orientation refinement process for the structure determination of reo virus.
| Angular resolution (°) | 1 | 0.1 | 0.01 | 0.002 |
| Search range | 9 | 9 | 11 | 9 |
| 3D DFT (s) | 175 | 206 | 178 | 155 |
| Read image (s) | 550 | 533 | 573 | 529 |
| FFT analysis (s) | 138 | 142 | 137 | 138 |
| Orientation refinement (s) | 19,942 | 21,957 | 69,672 | 43,786 |
| Total time (s) | 20,805 | 22,839 | 70,561 | 44,608 |
An interesting question is: How fine the angular resolution should be used and what is its effect on the center location; does it make any sense to refine the angles beyond 0.01°?
6. Conclusions
In this paper we discuss a novel algorithm for the refinement of orientations of individual virus particle projections for asymmetric particles and analyze its computational complexity. The algorithm can be used to determine the symmetry group of a symmetric particle and for the 3D reconstruction of particles exhibiting no symmetry or any symmetry.
The algorithm presented in this paper was designed for a distributed memory parallel architecture. On a shared memory system we would need one copy of the electron density map and of its 3D DFT. On a distributed memory system we choose to replicate the electron density map and its 3D DFT on every node because we wanted to reduce the communication costs. The alternative is to implement a shared virtual memory where 3D “bricks” of the electron density or its DFT are brought on demand in each node when they are needed, a strategy presented in [6].
We tested our programs using experimental data gathered for symmetric virus particles because we wanted to compare the quality of our solution with the one produced by programs that exploit the known symmetry of the protein shell of a virus particle. Such programs have been used for many years by the structural biology community. Our results indicate that our algorithm provides better quality solutions than they currently obtained. In addition to enabling structural biologists to study asymmetric systems, we were able to refine two structures to 10.0 Å and 8.0 Å versus 11.2 Å and 8.6 Å resolution respectively. We are now running additional cycles of refinement on both data sets in the hope of extending the resolution of both structures.
Acknowledgments
The research reported in this paper was partially supported by National Science Foundation grants MCB9527131 and DBI0296107 to Dan Marinescu and Tim Baker, ACI0296035 and EIA0296179 to Dan Marinescu, and NIH grants GM33050 and AI45976 to Tim Baker.
Contributor Information
Yongchang Ji, Email: yji@cs.ucf.edu, School of Electrical Engineering and Computer Science, University of Central Florida, Orlando, Florida, 32816.
Dan C. Marinescu, Email: dcm@cs.ucf.edu, School of Electrical Engineering and Computer Science, University of Central Florida, Orlando, Florida, 32816.
Wei Zhang, Email: leila@bilbo.bio.purdue.edu, Department of Biological Sciences, Purdue University, West Lafayette, IN, 47907.
Timothy S. Baker, Email: tsb@bilbo.bio.purdue.edu, Department of Biological Sciences, Purdue University, West Lafayette, IN, 47907.
References
- 1.Baker TS, Martin IMB, Marinescu DC. CSD-TR #97–055. Department of Computer Sciences, Purdue University; 1997. A parallel algorithm for determining orientations of biological macromolecules imaged by electron microscopy. [Google Scholar]
- 2.Baker TS, Olson NH, Fuller SD. Adding the third dimension to virus life cycles: Three-dimensional reconstruction of icosahedral viruses from cryo-electron microscopy. Microbiology and Molecular Biology Reviews. 1999;63(4):862–922. doi: 10.1128/mmbr.63.4.862-922.1999. [DOI] [PMC free article] [PubMed] [Google Scholar]
- 3.Branden C, Tooze J. Introduction to protein structure. New York and London: Garland Publishing; 1991. [Google Scholar]
- 4.Böttcher B, Wynne SA, Crowther RA. Determination of the fold of the core protein of hepatitis B virus by electron cryomicroscopy. Nature (London) 1997;386:88–91. doi: 10.1038/386088a0. [DOI] [PubMed] [Google Scholar]
- 5.Conway JF, Cheng N, Zlomick A, Wingfield PT, Stahl SJ, Steven AC. Visualization of a 4-helix bundle in the hepatitis B virus capsid by cryo-electron microscopy. Nature (London) 1997;386:91–94. doi: 10.1038/386091a0. [DOI] [PubMed] [Google Scholar]
- 6.Cornea-Hasegan MAD, Marinescu C, Zhang Z, Rice JR, Lynch RE, Rossmann MG. Macromolecular electron density averaging on distributed memory MIMD systems. Concurrency: Practice and Experience. 1993;5(8):635–657. [Google Scholar]
- 7.Crowther RA, DeRosier DJ, Klug A. The reconstruction of a three-dimensional structure from projections and its application to electron microscopy. Proc. Roy. Soc. London. 1970;A 317:319–340. [Google Scholar]
- 8.DeRosier DJ, Klug A. Reconstruction of three-dimensional structures from electron micrographs. Nature. 1967;217:130–134. doi: 10.1038/217130a0. [DOI] [PubMed] [Google Scholar]
- 9.DeRosier DJ, Moore PB. Reconstruction of three-dimensional images from electron micrographs of structures with helical symmetry. J. Molec. Biol. 1970;52:355–369. doi: 10.1016/0022-2836(70)90036-7. [DOI] [PubMed] [Google Scholar]
- 10.Dryden KA, Farsetta DL, Wang G, Keegan JM, Fields BN, Baker TS, Nibert DL. Internal \ structures containing transcriptase-related proteins in top component particles of mammalian orthoreovirus. Virology. 1998;245:33–46. doi: 10.1006/viro.1998.9146. [DOI] [PubMed] [Google Scholar]
- 11.Frank J. Three-dimensional electron microscopy of macromolecular assemblies. Academic Press; 1996. [Google Scholar]
- 12.Gonzalez RC, Woods RE. Digital image processing. Addison-Wesley Publishing Company, Inc; 1993. [Google Scholar]
- 13.Gordon R. Three-dimensional reconstruction from projections: A review of algorithms. Intern. Rev. of Cytology. 1974;38:111–151. doi: 10.1016/s0074-7696(08)60925-0. [DOI] [PubMed] [Google Scholar]
- 14.Grangeat P, Amans J-L, editors. Three-dimensional image reconstruction in Radiology and Nuclear Medicine. Kluwer Academic Publishers; 1996. [Google Scholar]
- 15.van Heel M, Growen B, Matadeen R, Orlova E, Finn R, Pape T, Cohen D, Stark H, Schmidt R, Schatz M, Patwardhan A. Single-particle electron cryo-microscopy: towards atomic resolution. Quarterly Review of Biophysics. 2000;33(4):307–369. doi: 10.1017/s0033583500003644. [DOI] [PubMed] [Google Scholar]
- 16.Herman GT, editor. Image reconstruction from projections, implementation and applications. Springer-Verlag; 1979. [Google Scholar]
- 17.Johnson CA, Weisenfeld NI, Trus BL, Conway JF, Martino RL, Steven AC. Orientation determination in the 3D reconstruction of icosahedral viruses using a parallel computer. CS & E. 1994:555–559. [Google Scholar]
- 18.Lynch RE, Marinescu DC, Lin H, Baker TS. Proc. IPPS/SPDP. IEEE Press; 1999. Parallel algorithms for 3D reconstruction of asymmetric objects from electron micrographs; pp. 632–637. [Google Scholar]
- 20.Marinescu DC, Ji Y, Lynch RE. Space-Time Tradeoffs for Parallel 3D Reconstruction Algorithms for Virus Structure Determination. Concurrency and Computation: Practice and Experience. 2001;13:1083–1106. [Google Scholar]
- 21.Marinescu DC, Ji Y, Marinescu GM. Proc. Int. Symp.on Parallel and Distributed Computing. XI. Analele Stiintifice ale Universitatii Al.I.Cuza, Iasi, ISSN 1224–2268; 2002. Grid Computing and Applications to Computational Biology; pp. 11–46. [Google Scholar]
- 22.Martin IM, Marinescu DC, Baker TS, Lynch RE. Identification of spherical particles in digitized images of entire micrographs. J. of Structural Biology. 1997;120:146–157. doi: 10.1006/jsbi.1997.3901. [DOI] [PubMed] [Google Scholar]
- 23.Ramanchandran GN, Lakshminarayanan AV. Three dimensional reconstructions from radiographs and electron micrographs: Application of convolution instead of Fourier transforms. Proc. National Academy of Sciences. 1971;68:2236–2240. doi: 10.1073/pnas.68.9.2236. [DOI] [PMC free article] [PubMed] [Google Scholar]
- 24.Rossmann MG, Tao Y. Cryo-electron-microscopy reconstruction of partially symmetric objects. J. Structural Biology. 1999;125:196–208. doi: 10.1006/jsbi.1999.4083. [DOI] [PubMed] [Google Scholar]
- 25.Strauss JH, Strauss EG. The alphaviruses: gene expression, replication, and evolution. Microbiol. Rev. 1994;58:491–562. doi: 10.1128/mr.58.3.491-562.1994. [DOI] [PMC free article] [PubMed] [Google Scholar]


