

Abstract
The tumor suppressor p53 is the most frequently mutated gene in human cancers, mutated in 25–30% of breast cancers. However, mutation rates differ according to breast cancer subtype, being more prevalent in aggressive estrogen receptor-negative tumors and basal-like and HER2-amplified subtypes. This heterogeneity suggests that p53 may function differently across breast cancer subtypes. We used RNAi-mediated p53 knockdown (KD) and antagomir-mediated KD of microRNAs to study how gene expression and cellular response to p53 loss differ in luminal versus basal-like breast cancer. As expected, p53 loss caused downregulation of established p53 targets (e.g. p21 and miR-34 family) and increased proliferation in both luminal and basal-like cell lines. However, some p53-dependent changes were subtype specific, including expression of miR-134, miR-146a and miR-181b. To study the cellular response to miR-146a upregulation in p53-impaired basal-like lines, antagomir KD of miR-146a was performed. KD of miR-146a caused decreased proliferation and increased apoptosis, effectively ablating the effects of p53 loss. Furthermore, we found that miR-146a upregulation decreased NF-κB expression and downregulated the NF-κB-dependent extrinsic apoptotic pathway (including tumor necrosis factor, FADD and TRADD) and antagomir-mediated miR-146a KD restored expression of these components, suggesting a plausible mechanism for miR-146a-dependent cellular responses. These findings are relevant to human basal-like tumor progression in vivo, since miR-146a is highly expressed in p53 mutant basal-like breast cancers. These findings suggest that targeting miR-146a expression may have value for altering the aggressiveness of p53 mutant basal-like tumors.
Introduction
p53 is one of the most frequently mutated genes in human cancers and it is mutated in ~25–30% of breast cancers (1–3). In breast cancer, the rates of p53 mutations differ significantly depending upon the molecular subtype, with p53 mutations being most frequent in basal-like/triple negative breast and HER2-amplified cancers (2,4–8). Recently, it was reported that 84% of the basal-like breast cancers and 75% of the HER2-amplified breast cancers exhibited p53 mutations (3) compared with 12 and 32% in luminal A and luminal B breast cancers, respectively. In addition, p53 mutation status has been shown to be an important survival/prognostic marker in breast cancer (7,9). The variation in p53 mutational status across different molecular subtypes exerts functional consequences and selective pressures that are different in luminal and basal-like breast cancers (8,10). Understanding the inherent differences in p53 pathway in luminal versus basal-like breast cancers could provide a target for development of new treatment strategies.
p53 interacts with microRNAs (miRs) at multiple levels (11). MicroRNAs are small non-coding RNAs (19–25 nucleotide long) that downregulate gene expression through sequence specific targeting of mRNAs, with resulting translational repression or degradation of the target mRNA (12). The expression of microRNAs is tissue dependent and expression regulates processes such as cell proliferation, apoptosis and development (13). Dysregulation of microRNA expression has been associated with various types of cancer including breast cancer (14).
Cross talk between p53 and microRNAs is complex and bidirectional; p53 regulates the expression and maturation of multiple microRNAs and the microRNAs, in turn, can regulate the activity and function of p53. The regulation of miR-34 family by p53 has been reported by numerous groups (15,16). p53 has also been shown to regulate the expression of several other microRNAs including miR-145 (17), miR-107 (18), miR-192 and miR-215 (19). p53 modulates the maturation of miR-16-1, miR-143, miR-145 and miR-206 (11). Conversely, several microRNAs regulate the expression and functioning of p53 including miR-504 (20), miR-125b (21), miR-29a, miR-29b and miR-29c (22), miR-34a (23), miR-122 (24) and miR-146a (25).
Based on the intricate relationship between p53 status and microRNAs, we hypothesized that the some differences in the p53 pathway activity in luminal versus basal-like breast cancers might be a function of differential microRNA expression. We analyzed basal-like and luminal breast cancer cell lines for differential expression of microRNAs and mRNAs following knockdown (KD) of p53. Several miRs were differentially expressed in a p53-dependent fashion in luminal versus basal-like cell lines. We evaluated the phenotypes that were modulated by these microRNAs and identified mRNA expression changes that were associated with the loss of these microRNAs. Our results show that p53 loss promotes a prosurvival pathway in basal-like breast cancer cells, mediated by upregulation of miR-146a.
Materials and methods
Cell lines and culture conditions
Four human breast cancer cell lines with wild-type (WT) p53 status were employed for the current study: MCF-7 and ZR-75-1 (two luminal cell lines), SUM102 (basal-like cell line) and HME-CC (an immortalized human mammary epithelial cell line with basal-like characteristics). Our previous work has compared the cellular response of p53 KD cell lines to cell lines and tumors with p53 mutations and found these KD cells to be representative models of gene expression responses to p53 loss (5). Since a very small number of p53 WT basal-like models have been reported, we have included HME-CC with basal-like characteristics as an example of basal-like breast cancer cell lines. All isogenic pairs of cell lines (e.g. MCF-7 and MCF-7 with p53 KD) were provided by Charles Perou based on methods described in Troester et al. (5) and were propagated for <6 months prior to experiments. The MCF-7 and ZR-75-1 parents and derivatives were grown and maintained in RPMI 1640 with l-glutamine (GIBCO) supplemented with 10% fetal bovine serum (Sigma) and 50 units/ml penicillin and 50 units/ml streptomycin (GIBCO). Breast cancer cell line SUM102 was obtained from Steve Ethier of the Karmanos Cancer Center at Wayne State University, Detroit, MI and was maintained in HuMEC (Invitrogen). HME-CC cell line was also maintained in HuMEC (Invitrogen) as described previously (10). Stable populations of isogenic cell lines, corresponding to all four parent cell lines, but expressing p53-RNAi, were established (5). All lines were sequenced and shown to be free of p53 mutations prior to KD experiments. These p53 KD populations were maintained in the same culture conditions as the parent cell populations, with growth medium refreshed three times weekly and cells maintained at 37°C and 5% CO2.
RNA and microRNA isolation
Cells were harvested 48 h after plating by scraping them in RNA lysis buffer. RNeasy mini kit (Qiagen) was used to isolate total RNA from the cells and mirVana miRNA Isolation Kit (AM1560; Ambion) was used to isolate miRNA. The quantification for total RNA and microRNA was performed using a ND-1000 Nanodrop spectrophotometer. Quality of miRNA and mRNA was determined by Agilent Bioanalyzer using an RNA 6000 Nano Chip. All samples had RNA integrity numbers >9.
Quantitative real-time PCR for miRNA and NF-κB signaling pathway
The miRNA and NF-κB signaling pathways were analyzed by quantitative real-time PCR arrays (Human Cancer miRNA PCR Array, MAH-102C, for miRNA arrays and Human NFkB Signaling Pathway Array, PAHS-025A, for NF-κB pathway arrays) according to manufacturer’s protocol (SA Biosciences) on an Applied Biosystems 7900HT Fast PCR machine. These arrays consisted of probes for 88 microRNAs and 84 genes, respectively, with each array. In addition, these arrays included the assessment of standard endogenous control genes for normalization (four in microRNA arrays and five in NF-κB arrays) and quality control genes (four in microRNA arrays and seven in NF-κB arrays). The relative expression values from miRNA and NF-κB PCR arrays were obtained by normalizing to the average of control genes present on the array (for miRNA) or by normalizing to glyceraldehyde-3-phosphate (for NF-κB) and then normalizing the p53 KD cell lines to their parent cell lines. Similarly, the relative expression values of SUM102-p53 KD and HME-CC-p53 KD cell lines with miR-146a-KD were normalized to SUM102-p53 KD and HME-CC-p53 KD cell lines.
To identify differentially regulated genes between parent and KD cell lines (e.g. MCF-7 versus MCF-7 + p53 KD or SUM102 + p53 KD versus SUM102 + p53 KD + antagomir-146a), we conducted Significance Analysis of Microarray (SAM) analysis on the 1/(Delta C t) values (since the C t values are inversely related to expression values). The genes that were significant in parental cell lines versus p53 KD cell lines were chosen for further analysis after antagomir-146a treatment.
Antagomir-mediated microRNA KD and pre-miR (miRNA precursor)-mediated overexpression of miR-146a
Breast cancer cell lines that overexpressed miR-146a were selected for antagomir transfection targeted at miR-146a. Only the p53 KD lines of SUM102 and HME-CC had high miR-146a, but the parent lines were also transfected as controls. Antagomirs (miR-146a; AM17000) and standard control oligomers (anti-miR negative control #1; AM17012) were obtained from Applied Biosystems. Transfection conditions were optimized by performing the reverse transfection procedure as per the manufacturer’s protocol by using four concentrations of siPORT NeoFX Transfection Reagent (Part # AM4510; Applied Biosystems). The transfection conditions were optimized by measuring the reduction in the expression of HMGA with anti-let-7c transfection as recommended by the manufacturer. Optimal transfection was observed with 12 µl in SUM102 and its derivative cell lines, whereas in HME-CC and its derivative cell lines, the optimal concentration was 18 µl. To overexpress miR-146a, basal-like breast cancer cell lines (parental), SUM102 and HME-CC, were transfected with pre-miR miRNA precursor (miR-146a, PM 10722; Applied Biosystems). The reverse transfection procedure was performed utilizing the conditions optimized for antagomir transfections above. All pre-miR and antagomir transfections were performed in triplicate and were carried out according to manufacturer’s protocol, and control transfections consisting of transfection reagent (in the absence of antagomir/pre-miR miRNA precursor) as well as non-targeting control were set in parallel. Total RNA and miRNA were isolated for further analysis after 48 h.
Expression of mature miR-146a after transfection with targeting antagomirs and pre-miR precursors was assessed by real-time PCR. The control and transfected samples were reverse transcribed into cDNA using the miScript Reverse Transcription Kit (#218061; Qiagen) and real-time PCR was performed using the miScript SYBR Green PCR Kit (#218073; Qiagen) according to the manufacturer’s instructions. The miScript Assay used to measure the levels of miR-146a was obtained from Qiagen (#MS00003535); RNU6-2 (#MS00033740; Qiagen) was used as an endogenous control. Expression of miR-146a was assessed by real-time PCR utilizing an Applied Biosystems 7900HT Fast PCR machine (Applied Biosystems).
Protein isolation and western blotting
Cells were harvested from culture by scraping, and protein was isolated and quantitated using the BCA Protein Determination Assay (Pierce kit #23225). After denaturing the lysates by boiling them with β-mercaptoethanol, 30mg of protein was electrophoresed on a 4–20% Tris–HCl Criterion precast gel (Bio-Rad) and transferred to a Hybond-P membrane (Amersham Biosciences) by electroblotting. The blots were probed with antibodies against BRCA1 and BRCA2 (Santa Cruz Biotechnology) and β-actin (Cell Signaling). Blots were washed three times for 5 min with Tris-buffered saline supplemented with 0.1% Tween and were probed with ECL Anti-Rabbit IgG Horseradish Peroxidase-Linked Whole Antibody (Amersham GE Healthcare). Blots were rewashed, and chemiluminescence was used to enhance the detection by utilizing western blotting detection system (Amersham-GE Healthcare). Using Image J software, pixel intensity was used to measure the BRCA1, BRCA2 and β-actin protein bands. Relative BRCA1 and BRCA2 protein concentrations were quantified by dividing the pixel intensity of BRCA1 and BRCA2 bands with the intensity of the β-actin protein band.
Whole genome microarrays
RNA was isolated, quantified and tested for quality as described above. Parental cell lines and their p53 derivative cell lines were run in duplicate (two independent experiments) on human whole genome 244K custom microarray slides (Agilent) according to the manufacturer’s protocol. Cy3-labeled reference was Stratagene Universal Human Reference spiked 1:1000 with MCF-7 RNA and 1:1000 with ME16C RNA. Cy-5-labeled cDNAs were made from all experimental samples (SUM102, HME-CC, MCF-7, and ZR-75-1 and p53 KD cell lines). Labeled cDNAs were prepared using the Agilent QuickAmp protocol and were hybridized to arrays overnight and then washed and scanned on an Agilent G2505C microarray scanner. All array data are available through the Gene Expression Omnibus (GSE pending).
Microarray data were Lowess normalized and probes with >70% good data (signal >10 dpi in both channels) were selected for further analysis. Missing data were imputed using k-nearest neighbors’ imputation (with k = 10). Duplicate probes were collapsed by averaging and the expression of p53 KD cell lines was normalized to corresponding parental cell lines. Data normalized in this fashion correspond to the log2 of the fold change due to p53 loss. These data were then analyzed by two-class SAM to identify p53-dependent genes that differ between luminal and basal-like cell lines (two classes: MCF-7-p53 KD, ZR-75-1-p53 KD or SUM102-p53 KD, HME-CC-p53 KD). One-class SAM analysis was also performed to identify the p53-dependent changes that were common to all of the cell lines.
Significant genes were evaluated for ontological enrichment using Ingenuity Pathway Analysis, with Benjamini–Hochberg (B–H) multiple testing correction. Significant functions and pathways were defined as those with B–H P values <0.05.
Apoptosis assay
Steady state apoptosis levels were assessed in MCF-7, ZR-75-1, SUM102, HME-CC cell lines and their p53 KD derivative cell lines (MCF-7-p53 KD, ZR-75-1-p53 KD, SUM102-p53 KD and HME-CC-p53 KD). In addition, we also assessed steady state apoptosis levels in SUM102, SUM102-p53 KD, HME-CC and HME-CC-p53 KD cell lines with miR-146a KD as well as in SUM102 and HME-CC cells with miR-146a overexpression. The apoptosis levels were assessed utilizing the Caspase-Glo® 3/7 luminescent Assay (Cat# G8091; Promega). Cells were plated at 20 000 K per well in cell culture and luminometer-compatible white-walled 96-well plates according to manufacturer’s protocol. Each sample was plated at least in triplicate. The luminescence of each sample, as well as blank non-plated wells, was measured in plate-reading luminometer after 24 h and the readings were background subtracted before the analysis.
Population doubling times
To assess the proliferation rates of the cell lines as a function of p53 and miR-146a status, we measured population doubling times (PDT). Cells (150 K) of each cell line were plated per 100 mm cell culture dish. Cells were counted every 24 h for 6 days and three dishes were counted in triplicate each day. PDT were calculated using the equation: PDT = 0.693/k, where k is determined from the slope of a linear regression equation of the form: ln A(t) = ln A 0 + kt.
miR-146a expression analysis in human breast cancers
Previously published datasets from Blenkiron et al. (26) and The Cancer Genome Atlas (TCGA) network (3) were analyzed for expression of miR-146a as a function of breast cancer subtype as well as p53 expression status (WT versus mutated). Regarding the Blenkiron dataset, the p53 expression status of these tumors was kindly provided by Dr C.Caldas, University of Cambridge, Cambridge, UK. The breast cancer subtype status was determined by PAM50. Based on the availability of subtype and p53 expression status, our final dataset included N = 75 tumors that were not classified as normal-like, specifically: 12 basal-like breast cancers (n = 5 p53 WT; n = 7 p53 MUT), 34 luminal A breast cancers (n = 30 p53 WT; n = 4 p53 MUT), 16 HER2 breast cancers (n = 6 p53 WT; n = 10 p53 MUT) and 13 luminal B breast cancers (n = 5 p53 WT; n = 8 p53 MUT). The TCGA dataset consisted of N = 628 (n = 409 p53 WT; n = 219 p53 MUT) tumor samples for which the p53 status was publicly available. Specifically there were: 100 basal-like breast cancers (n = 13 p53 WT; n = 87 p53 MUT), 320 luminal A breast cancers (n = 282 p53 WT; n = 38 p53 MUT), 53 HER2 breast cancers (n = 17 p53 WT; n = 36 p53 MUT), 141 luminal B breast cancers (n = 87 p53 WT; n = 54 p53 MUT) and 15 normal-like breast cancers (n = 10 p53 WT; n = 4 p53 MUT). In a final, ancillary analysis, we further culled the master TCGA dataset [N = 577 (n = 409 p53 WT; n = 168 p53 MUT)] to exclude two individuals with silent p53 mutations and include only fully characterized p53 mutation types (splice mutants, frameshift deletions, in-frame deletions, non-sense mutations or missense mutations).
For both the Blenkiron and TCGA analyses, miR-146a microarray expression was extracted and median-centered across all samples. We used analysis of variance with 3 or 7 df to test the differences in mean expression by subtype (N = 4 groups) or by subtype and p53 status (N = 8 groups). Boxplots were generated to visualize the mean miR-146a expression in each group and to also detect outliers. One basal-like, p53 mutant sample with very low relative expression was removed (ID = 2219) from the Blenkiron dataset because it was beyond Q1 - 1.5 times interquartile range of the strata. We further stratified the TCGA basal-like tumors by p53 mutation type to evaluate associations between type of mutation and miR-146a. All analyses were completed using R version 2.14. In addition, the basal-like breast cancers in the TCGA dataset were also classified based on the functional (gene expression-based) mutation status as having p53-WT-like or p53 mutant-like mRNA profiles as described in Troester et al. (5). After median-centering, mean miR-146a expression was estimated for WT-like and mutant-like samples and differences in mean were assessed by student T-test. The majority of tumors (N = 77) were functionally p53 mutant and only two were p53 WT. We used analysis of variance to test the differences in mean expression by p53 status (N = 2 groups) or p53 mutation type. The association between WT-like or mutant-like expression and mutation type (splice mutants, frameshift deletions, in-frame deletions, non-sense mutations or missense mutations) was assessed among basal-likes using a chi-square test. Boxplots were generated to visualize the mean miR-146a expression in each group and to also detect outliers. All analyses were completed using R version 2.14.
Results
Effects of p53 loss on transcription (mRNA and miRNA expression) by molecular subtype
To better understand the heterogeneity and inherent differences in p53 signaling across different molecular subtypes of breast cancer, we compared mRNA expression and microRNA expression as a function of p53 status in a subset of luminal and basal-like breast cancer cell lines. We employed a well-established system of well-characterized cell lines and their isogenic pairs with stable p53 KD. A panel of four cell lines was included (two basal-like SUM102 and HME-CC and two luminal MCF-7 and ZR-75-1). We observed that p53 KD significantly altered mRNA expression and miRNA expression. Based on the PCR-based microRNA arrays, we identified a common response shared by all cell lines indicating the miR-34 family, an established p53 target, was downregulated in p53 KD cell lines (Supplementary Figure 1, available at Carcinogenesis Online). In addition, expression of several other microRNAs changed significantly across numerous cell lines as a function of p53 status, including miR-133b, let-7f, miR-18a, miR-34c-5p, miR-128, miR-215, miR-181c and miR-148a. These microRNAs were downregulated in presence of p53 KD in all cell lines except in SUM102, where only miR-34c-5p was downregulated and the rest of these microRNAs were upregulated.
Some p53-dependent changes in microRNA expression were subtype specific. The miRs that were differentially expressed in luminal versus basal-like p53 KD cell lines included miR-134, miR-146a and miR-181b (Figure 1A). These three microRNAs were significantly upregulated in basal-like cells with p53 KD and significantly downregulated in luminal cell lines with p53 KD (Supplementary Table 1, available at Carcinogenesis Online). miR-146a was chosen for further analysis based on having the most significant fold change among these differentially expressed microRNAs.
Fig. 1.

Basal-like and luminal breast cancers have distinct transcriptional and phenotypic responses to p53 loss. (A) Fold change in the expression of miRNAs in p53 KD cells normalized to parent cells based on real-time PCR results with significant differential expression in luminal versus basal-like cells. The bars represent real-time PCR results for miR-134 (black), miR-146a (dark gray) and miR-181b (light gray) in p53 KD cells compared to WT control cells (where relative quantification = 1). The error bars represent standard error of the mean. All the experiments were done in triplicate (biological replicates). (B) Cluster analysis of basal-like and luminal p53 KD cell lines normalized to parent cell lines showing the gene expression differences in different subtypes as a function of p53 status. The red dendrogram branch represents basal-like cells and blue branch represents luminal cell lines. The grey bar represents the genes that are upregulated in basal-like p53 KD cell lines and the yellow bar represents the genes that are downregulated in basal-like p53 KD cell lines relative to luminal p53 KD cells. All the arrays were run in duplicate (biological replicates). (C) Apoptosis levels in luminal and basal-like cell lines, parental and in presence of p53 KD. The black bars represent steady state apoptosis levels in luminal breast cancer cells and the dark grey bars represent steady state apoptosis levels in basal-like breast cancer cells. The levels were measured in terms of relative luminescence units in caspase 3/7 based apoptosis assay. The reductions in apoptosis level with p53 KD (second bar graph) were calculated as percentages of the steady state apoptosis levels in corresponding parent cell lines with WT p53 levels. All the experiments were done in triplicate (biological replicates) with each experiment containing three technical replicates. The error bars in all graphs represent standard error of the mean.
Consistent with the patterns of microRNA changes and previously published literature (5), we observed that mRNA expression associated with p53 loss was different for each cell line and cell type. However, a gene expression response was again shared by all cell lines, including downregulation of established p53 targets (e.g. p21). There were also changes that were common to luminal or to basal-like lines. Using a two-class SAM (luminal p53 KD and basal-like p53 KD cell lines’ gene expression data normalized to corresponding WT cell lines’ gene expression data), we observed 137 genes to be upregulated (Figure 1B, grey bar) and 36 genes downregulated (Figure 1B, yellow bar) in basal-like cell lines with p53 KD, compared with luminal cell lines with p53 KD. The Ingenuity Pathway Analysis revealed several significant canonical pathways and functions associated with these clusters. The upregulated cluster was highly enriched for genes associated with proliferation of cells, tumorigenesis, cell growth, cell death, apoptosis and immune response. On further analysis, the genes upregulated in the apoptosis group included numerous genes (like ADAM12, BMP6, CYR61, IGFBP1, ITGB3, MCL1, PDGFRB, PTGS2, TGFB2 and XAF1) that have been shown to inhibit apoptosis in breast cancer. In addition, significant canonical pathways associated with upregulated gene cluster included hepatic fibrosis/hepatic stellate cell activation, eicosanoid signaling, role of cytokines in mediating communication, glucocorticoid receptor signaling and integrin-linked kinase signaling among other pathways. Among these pathways, integrin-linked kinase has been recognized as anti-apoptotic factor in breast cancer (27).
p53 loss-dependent cellular responses: proliferation and apoptosis
Based on our observation that microRNA and mRNA expression patterns change significantly as a function of p53 loss and are distinct in each subtype, we evaluated the cell lines for relevant phenotypic changes. Because apoptotic pathways were p53 dependent in basal-like relative to luminal breast cancers, we employed luminescence-based caspase assays to assess the apoptosis levels in luminal and basal-like cell lines, both WT and in the presence of p53 KD. We observed that basal-like cell lines exhibited distinctly higher (4- to 5-fold) levels of steady state apoptosis compared with luminal cell lines (Figure 1C). In addition, p53 KD resulted in a statistically significant reduction in apoptosis in basal-like cell lines, whereas luminal cell lines did not exhibit such significant response (Figure 1C). The basal-like cell lines, SUM102 and HME-CC, exhibited 63 and 41% statistically significant reductions in presence of p53 KD (P = 0.000014 and 0.001 in SUM102 and HME-CC cells), in contrast, luminal cell lines, MCF-7 and ZR-75-1, exhibited 12 and 17% reduction with p53 loss (non-statistically significant; P = 0.14 and 0.19) (Figure 1C). We also assessed proliferation rates by evaluating PDT. We observed that p53 loss resulted in upregulation of proliferation in all cell lines as evidenced by a statistically significant decrease in PDT (Table I)
Table I.
PDT expressed in hours for parent cell lines, p53 KD cell lines and p53 KD cell lines treated with antagomirs to miR-146a
| Parent/WT | P53 KD | P valuea | p53 KD, miR-146a KD | P valueb | |
|---|---|---|---|---|---|
| PDT (SE) | PDT (SE) | PDT (SE) | |||
| MCF-7 | 36.8 (1.7) | 20.1 (0.2) | 0.0006 | ||
| ZR-75-1 | 42.3 (1.0) | 35.7 (0.7) | 0.006 | ||
| HME-CC | 21.3 (0.8) | 16.1 (0.2) | 0.003 | 18.9 (0.1) | 0.000067 |
| SUM102 | 26.3 (0.5) | 20.1 (0.2) | 0.00001 | 25.6 (0.0) | 0.00001 |
aComparing WT and p53 KD cell lines in a two-tailed, unpaired t-test. SE, Standard error.
bComparing p53 KD and p53 KD-miR-146a KD cell lines in a two-tailed, unpaired t-test.
miR-146a-dependent cellular responses
Among the differentially expressed microRNAs, miR-146a was upregulated with the most significant fold change. To identify the role of this microRNA in modulating the p53-dependent changes in breast cancer cell lines, we used antagomirs directed against miR-146a. Antagomir transfection resulted in significant reduction of expression of miR-146a in HME-CC-p53 KD (P = 7.9 × 10⁻⁶) and SUM102-p53 KD (P = 1.3 × 10⁻⁶) cells (Figure 2A). The significance values were calculated based on two-tailed unpaired t-test. The HME-CC-p53 KD exhibited 80-fold increase in miR-146a expression compared with HME-CC WT, and antagomir transfection resulted in reduction of miR-146a expression down to 8-fold levels to those of HME-CC WT (Figure 2A). Similarly, SUM102-p53 KD exhibited an 11-fold increase in miR-146a expression compared with SUM102 WT and antagomir transfection resulted in reduction of miR-146a expression to levels comparable to SUM102 WT (Figure 2A). Thus, the antagomir effectively suppressed miR-146a expression. In order to evaluate the selectivity of miR-146a antagomir, we measured the expression of related family member miR-146b and its expression was not significantly altered with the KD of miR-146a (P = 0.30 for HME-CC-p53 KD cells and P = 0.89 for SUM102-p53 KD cells).
Fig. 2.
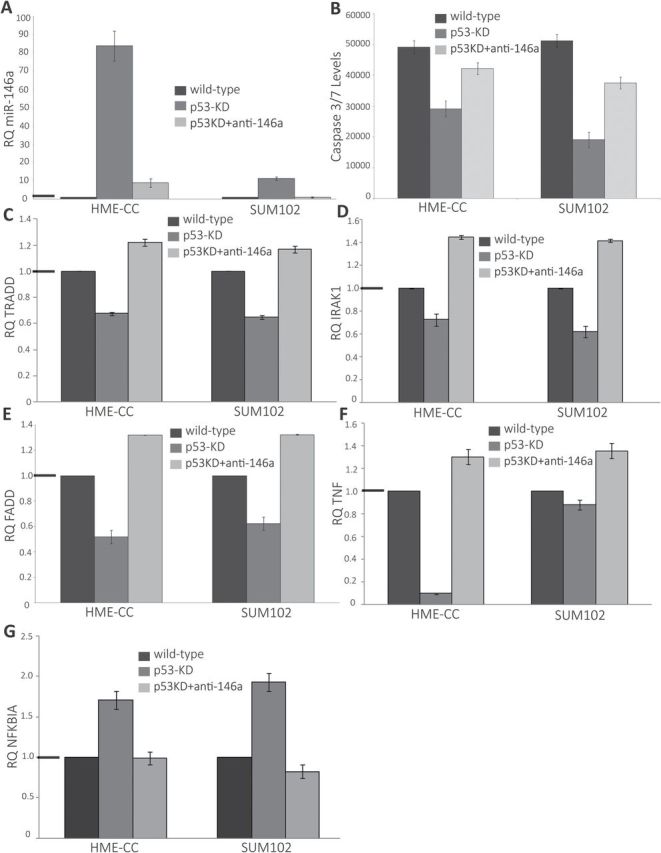
Effects of antagomir-mediated KD of miR-146a expression in basal-like breast cancer cell lines. (A) Antagomir-mediated KD of miR-146a significantly decreased miR-146a expression in basal-like cell lines. The black bars represent real-time PCR results for miR-146a in parent cells (where RQ = 1). The dark grey bars represent real-time PCR results for miR-146a in p53 KD cells compared to parent cells and the light grey bars represent real-time PCR results for miR-146a in p53 KD cells in presence of miR-146a KD. (B) Caspase assay in basal-like cell lines: function of p53 and miR-146a. The black bars represent steady state apoptosis levels in parent cells; the dark grey bars represent steady state apoptosis levels in p53 KD cells and the light grey bars represent the steady state apoptosis levels in p53 KD cells in presence of miR-146a KD. The levels were measured in terms of luminescence units in caspase 3/7 based apoptosis assay. The error bars represent standard error of the mean. (C–G) Changes in expression of extrinsic apoptotic pathway/proapoptotic cascade after p53 KD in the presence/absence of miR-146a KD. The black bars represent real-time PCR results for gene of interest in parent cells (where RQ = 1). The dark grey bars represent real-time PCR array results for same gene in p53 KD cells compared to parent cells and the light grey bars represent real-time PCR array results for same gene in p53 KD cells in presence of miR-146a KD. The graphs represent changes in expression for (C) TRADD, (D) IRAK1, (E) FADD, (F) TNF and (G) NFKBIA. The black horizontal bars on the y-axis represent the WT (null value). All of the experiments were done in triplicate. The changes represented were statistically significant based on two-tailed unpaired t-test. The error bars represent standard error of the mean.
Antagomir KD of miR-146a ablated several p53-dependent phenotypic changes, including altered PDT and apoptosis levels. miR-146a KD in basal-like cells with p53 KD resulted in increased PDT indicating reduction in proliferating rates (Table I). These changes in PDT were statistically significant for both HME-CC-p53 KD and SUM102-p53 KD cell lines (Table I). This change in doubling time may be mediated by apoptosis levels, given that we observed miR-146a KD led to a statistically significant (two-tailed, unpaired t-test) increase in steady state apoptosis levels in basal-like cells with p53 KD (Figure 2B). The HME-CC-p53 KD cell line exhibited a 45% increase in steady state apoptosis levels in presence of miR-146a KD (P = 0.0095) and SUM102-p53 KD cell line demonstrated 96% increase in steady state apoptosis levels (P = 2.3 × 10⁻⁴), almost doubling the rate of apoptosis in SUM102-p53 KD cells (Figure 2B).
Pre-miR miRNA precursor transfection resulted in a statistically significant overexpression of miR-146a in HME-CC and SUM102 cells (Supplementary Figure 2A, available at Carcinogenesis Online). Transfections in HME-CC cells resulted in an 135-fold increase in miR-146a expression compared with non-transfected HME-CC cells (P = 0.000785) (Supplementary Figure 2A, available at Carcinogenesis Online) and SUM102 cells demonstrated 60-fold increase in miR-146a expression compared with non-transfected SUM102 cells (P = 6.55 × 10⁻⁴) (Supplementary Figure 2A, available at Carcinogenesis Online). To evaluate potential off target effects of pre-miR transfection on other miRNAs, we measured the expression of the three highly expressed miRNAs, miR-210, miR-181a and miR-23b, as well the expression of related family member miR-146b. None of these were significantly altered by miR-146a overexpression, nor was miR-146b. Overexpression of miR-146a in WT basal-like breast cancer cells resulted in a statistically significant reduction in steady state apoptosis levels compared with non-transfected cells, thus exhibiting a phenotype parallel to the one observed in basal-like breast cancer cells with p53 KD (and increased expression of miR-146a). In association with miR-146a overexpression, the HME-CC cells exhibited a 46% reduction in apoptosis levels (P = 7.9 × 10⁻⁵) and SUM102 cells demonstrated 51% reduction in apoptosis levels (P = 1.0 × 10⁻⁶) (Supplementary Figure 2B, available at Carcinogenesis Online).
NF-κB-mediated apoptosis via death receptor pathways
To understand the mechanism behind miR-146a-associated proliferation and apoptosis changes, we performed mechanistic studies. miR-146a has been implicated in NF-κB signaling, p53 signaling and in regulating expression of BRCA1 and BRCA2. We conducted western blot experiments to examine the changes in the BRCA1 and BRCA2 pathway as a function of p53 status but no significant changes were observed in basal-like and luminal cell lines with p53 KD (data not shown). Using Human NF-κB Signaling Pathway PCR Arrays, we analyzed the expression of key genes related to NF-κB-mediated signal transduction. We observed that 2 of the genes were significantly upregulated (including NFKBIA inhibitor of the NF-κB-mediated signaling pathway and CSF3) and 15 genes were significantly downregulated in basal-like cell lines with p53 KD (Figure 2C–G; Supplementary Table 2, available at Carcinogenesis Online). These genes included key regulators of the extrinsic apoptotic pathway/proapoptotic cascade including tumor necrosis factor (TNF), FADD and TRADD as well as an established target of miR-146a – IRAK1 (Figure 2C–G) (28–31). Antagomir-mediated KD of miR-146a in basal-like cell lines with p53 KD restored expression of these components and reduced the expression of NFKBIA (Figure 2C–G). The observed changes in expression were statistically significant based on two-tailed unpaired t-test. These changes were not observed in luminal cell lines with p53 KD, where only two genes were significantly upregulated (TNF and IFNB1) (Supplementary Table 2, available at Carcinogenesis Online). These results suggest that an alternate survival pathway exists for basal-like breast cancer cells with p53 loss, mediated by upregulation of miR-146 and downregulation of the extrinsic apoptotic pathway including TNF, FADD and TRADD.
miR-146a and pre-miR-146a expression in human breast cancers
We analyzed two publicly available primary breast cancer datasets for the patterns of expression of miR-146a based on the molecular subtype of breast cancer. We have not observed luminal breast cancer cell lines to express high levels of miR-146a and across a dataset of >700 tumors, luminal breast cancers express low levels of miR-146a. Therefore, we evaluated the role of miR-146a in altering phenotypes among basal-likes where the high expression is most relevant. In the dataset from Blenkiron et al. (26), we observed that the mean expression of miR-146a expression in basal-like breast cancers is higher than the mean expression of miR-146a in other molecular subtypes of breast cancer (luminal A, luminal B and HER2+) (F statistic = 3.23, df = 3 and 70, P = 0.03) (Figure 3A). Further stratification of these results on p53 status show that basal-like, luminal A and HER2+ breast cancers with WT p53 expression exhibit similar levels of miR-146a (Figure 3B), but basal-like breast cancers with mutations in p53 expressed significantly higher levels of miR-146a (F statistic = 2.12, df = 3 and 66, P = 0.05) (Figure 3B). In contrast to basal-like breast cancers, luminal A and HER2+ cancers with mutated p53 status expressed miR-146a at levels below mean levels (Figure 3B). These results confirm our cell line observation that miR-146a is uniquely upregulated by p53 loss in basal-like breast cancers. Interestingly, however, we also observed that luminal B breast cancers with p53 mutation upregulated miR-146a, which may play a role in the aggressiveness of luminal B relative to luminal A breast cancers (Figure 3B).
Fig. 3.

miR-146a expression in primary tumors. (A) The box plots represent the expression of miR-146a in basal-like, HER2+, luminal A and luminal B subtypes of primary breast cancers in the Blenkiron et al. dataset. (B) The box plots represent the expression of miR-146a in basal-like, HER2+, luminal A and luminal B subtypes of primary breast cancers stratified by the expression of p53 in the Blenkiron et al. dataset. (C) The box plots represent the expression of miR-146a in basal-like, HER2+, luminal A and luminal B subtypes of primary breast cancers stratified by the expression of p53 in TCGA dataset. (D) The box plots represent the expression of miR-146a in basal-like breast cancers stratified by the functional mutational status of p53 in TCGA dataset. The solid bars in the middle of boxes indicate the median levels of expression.
To confirm these findings in a second dataset, we analyzed data from TCGA project (3). Basal-like breast cancers showed higher expression of miR-146a relative to other molecular subtypes of breast cancer (F statistic = 66.06, df = 3 and 610, P < 0.001) (Figure 3C). Given the relative homogeneity of basal-like breast cancers with respect to p53, it is not possible to conduct stable analyses of the p53 dependence of miR-146a expression among basal-like breast cancers. However, since different p53 mutations vary in their functional effects on the pathway, we stratified analysis of basal-like breast cancers based on the mutation type. p53 mutation status was publicly available for 66 of 87 basal-like, p53 mutant samples, therefore, 21 samples that lacked this information were excluded from stratified analyses. There were 33 samples with missense mutation, 13 samples with frameshift deletions, 5 samples with in-frame deletions, 2 with splice site mutations and 13 with non-sense mutations. Among basal-like breast cancers, the few samples with splice site mutations (n = 2) and frameshift deletions (n = 13) exhibited the highest levels of expression of miR-146a (Supplementary Figure 3A, available at Carcinogenesis Online). In addition, we used comprehensive miRNA expression, p53 sequence and p53 pathway expression from the TCGA to characterize samples both with respect to mutation status and p53-dependent gene expression (using a published p53-dependent signature (5) as a measure of functional status). We observed that the samples with p53 mutant-like expression (n = 77) had significantly higher mean expression (134.01 versus −168.14 in the two WT-like samples, respectively; t = 5.95, df = 33.34, P value = 1.08e-06) of miR-146a across basal-like TCGA samples (Figure 3D). Furthermore, among basal-like tumors, all tumors with sequence-based mutation evidence showed mutant-like expression except for two tumors with missense mutations (Supplementary Figure 3B, available at Carcinogenesis Online). These mutant tumors with WT-like expression had lower levels of miR-146a, underscoring that all missense mutations do not have functional consequences (32). Also, these missense mutations were most likely to be associated with WT like gene expression, indicating that all missense mutations also do not have functional consequences for p53 activity (33). We also analyzed TCGA data for the expression of precursor of miR-146a (pre-miR-146a) in these samples. We observed that the expression pattern of pre-miR-146a parallels the expression of miR-146a (Figure 3C; Supplementary Figure 4A, available at Carcinogenesis Online). In addition, the expression levels of pre-miR-146a exhibited a pattern very similar to that of the mature miR-146a when stratified based on mutation type (Supplementary Figures 3A and 4B, available at Carcinogenesis Online). This suggests that the differential expression of miR-146a occurs at/above the level of synthesis of pre-miR-146a rather than as a result of pre-miR processing.
Discussion
Clinically, basal-like breast cancers are associated with aggressive behavior and poor prognosis. Basal-like breast cancers exhibit high proliferative capacity, high mitotic index and high histological grade among other aggressive features (6,34,35). These features correlate well with the high expression of proliferation genes in this subtype of breast cancer (6,35), but our data show an additional feature that is unique to basal-like breast cancers. Basal-like breast cancer cell lines in the presence of WT p53 status exhibit distinctly higher steady state apoptosis levels in comparison with the steady state apoptosis levels seen in luminal breast cancer cell lines (also with WT p53 expression). Apoptosis and proliferation may be counterbalanced at steady state in WT cells, but when p53 loss occurs, doubling times may decrease due to significantly decreased apoptosis. The decrease in apoptosis associated with loss of WT p53 expression may contribute both to decreased doubling times and to the genomic instability that is well documented in basal-like breast cancers (6,34,35). In fact, p53 loss may be an early event in the natural history of breast cancer(36), and its importance is suggested by the observation that >80% of basal-like breast cancers exhibit p53 mutations (3).
Our work sought to identify gene expression changes that may result from p53 loss and to evaluate how these changes differ in basal-like and luminal lines. We observed that established targets of p53 (miR-34c-5p) were downregulated in all cell lines with p53 KD, consistent with previous findings. And while these established targets were among the only miRs that changed similarly in all four cell lines, we also discovered novel relationships, with miR-146a being significantly upregulated by p53 loss in basal-like cells, but not luminal cell lines. Some have speculated that microRNAs are strong regulators of cellular state (37), and therefore it may not be surprising that cell lines with very distinct differentiation status (basals versus luminals) have very distinct microRNA profiles. Recent data from the TCGA also establish strong genomic differences between luminal and basal-like breast cancers, which fundamentally affect regulation of both mRNA and microRNA profiles (3). It is important to link these genomic changes to changes in cellular phenotype.
This study has specifically linked changes in miR-146a expression with changes in apoptosis via altered NF-κB signaling. Figure 4 presents a proposed model for the effects of p53 loss on miR-146a expression and NF-κB death receptor signaling. We have established several portions of this mechanism here, showing that p53 negatively regulates miR-146a expression, and that in turn, miR-146a regulates the apoptosis levels through downregulation of extrinsic apoptotic pathway. We have shown that upregulation of NFKBIA, an inhibitor of NF-κB signaling, occurs downstream of miR-146a expression. While it is not clear whether upregulation of NFKBIA directly inhibits extrinsic apoptotic pathway, we were able to modulate expression of the extrinsic apoptotic pathway by altering miR-146a expression showing a causal role for miR-146a in apoptotic signaling. This mechanism is also consistent with previous literature, wherein overexpression of miR-146a in breast cancer cell lines has been shown to cause suppression of NF-κB activity (29). In our data, miR-146a downregulated the expression of NF-κB pathway members IRAK1 and TRAF6 (changes also seen in Taganov study (30) with LPS-IRAK1 and TRAF6). We also observed significant reduction in expression of genes related to NF-κB-mediated signal transduction and upregulation of the NF-κB inhibitor gene in basal-like breast cancer cell lines with p53 KD, whereas no such observations were seen in luminal breast cancer cell lines. Given the role of these specific NF-κB targets in the extrinsic apoptotic pathway/proapoptotic cascade (28,38), these data suggest a plausible mechanism for downregulation of apoptosis. NF-κB signaling has been shown to promote apoptosis in response to specific signals/cell subtypes (28,31).
Fig. 4.
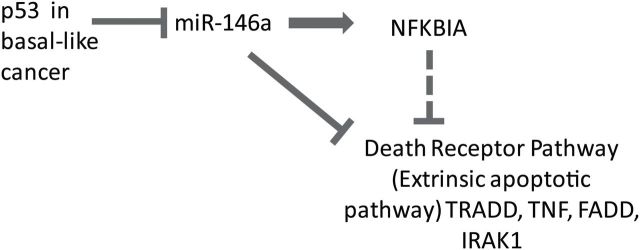
Schematic illustrating the effect of p53 alteration on apoptotic pathway in basal-like breast cancer cells. The flow chart represents the proposed sequence of events. The dotted line indicates the hypothesized connection between NFKBIA and the external apoptotic pathway.
Other previous research, consistent with our findings, has emphasized miR-146a in immune response, cell growth and cancer. miR-146a was initially identified and linked with innate immune function as a modulator of the response to Toll-like receptor ligands and cytokines (30); that study in THP-1 cells identified that miR-146a contained two binding sites for NF-κB. Recently, miR-146a been shown to be one of the miRs associated with lymphocytic infiltration in breast cancers (39). Links between 146a and PDT are also consistent with previous literature; similar to our findings in basal-like cancers, upregulation of miR-146a has been shown to protect human bronchial epithelial cells from apoptosis and to induce cellular proliferation (40). Our results differ from some previous literature. miR-146a has been shown to bind to BRCA1 and BRCA2 and modulate their expression (41). That study documented an inverse relation between the levels of miR-146a expression and BRCA1 protein levels and modulating the levels of miR-146a by using pre-miR precursor transfections led to a reduction in BRCA1 levels (42). While BRCA1 loss is a feature of basal-like breast cancers (35) and basal-like cell lines in this study exhibited higher levels of miR-146a, increases in miR-146a did not result in expected reduction in the levels of BRCA1 or BRCA2. This may be because the WT SUM102 expresses barely detectable levels of BRCA1 transcripts (43) in contrast to six of seven basal-like cell lines used in the previous study (42) that express more substantial levels of BRCA1 transcripts (43). The SUM102 cells, and other basal-like breast cancers, may have a preexisting mechanism for silencing/reducing the expression of BRCA1 that are independent of p53-dependent miR-146a upregulation or it may be that a functional p53 pathway is required for miR-146a-mediated regulation of BRCA1/2 levels. On the other hand, even in tumors with no mutations, a functionally null p53 status might exist due to other pathway-level genetic or epigenetic alterations (e.g. MDM2 overexpression). Future research should resolve how BRCA1 interacts with the p53-miR146a axis.
The previous literature, together with our findings, suggests that miR-146a may be an important oncogene. A recent study in breast cancer cells showed that miR-146a was significantly upregulated in invasive cell lines when compared with normal and less invasive cell lines (44). Previous studies have also shown that abnormal expression of miR-146a is associated with paradoxical roles as an oncogene or a tumor suppressor in different human cancer tissues. This variation seems to be context dependent in terms of tissue type as well as signaling networks. miR-146a has been shown to function as an oncogene in cervical cancer (45) and anaplastic thyroid carcinoma (46) but as a tumor suppressor in pancreatic cancer (47) and gastric cancer (48). Within breast cancer, overexpression of miR-146a has been shown to be oncogenic by increasing the proliferation of breast cancer cells (42) and to function as a tumor suppressor (29) by impairing the invasion and migration capacity when overexpressed in some breast cancer cell lines. These observations reconfirm that miRs are not only expressed in tissue specific manner but are also a part of the intricate network involving direct interactions and cross talks with other genes, microRNAs and signaling molecules. In addition, each microRNA can have multiple targets and each target can be regulated by multiple microRNAs (i.e. signal integration). In our study, we have identified an alternate survival pathway exists for basal-like breast cancer cells with p53 loss, mediated by upregulation of miR-146a.
Since a vast majority of basal-like breast cancers lack expression of WT p53, identifying the patterns associated with increased tumorigenic potential can have significant translational value. Alternate splicing is one of the common ways by which human p53 isoforms are abnormally expressed in variety of cancers including breast cancers (49). In our dataset, the patients with splice mutations (and frameshift mutations) seem to have a stronger miR-146a upregulation than the patients with other types of p53 mutations. All mutations are not equally likely to limit p53 function, as illustrated in Supplementary Figure 3B, available at Carcinogenesis Online, where some missense mutations fail to exhibit p53 mutant-like gene expression. While the specific mechanisms of splice variant influence on miR-146a upregulation are beyond the scope of this paper, it is clear that the consequences of specific p53 mutations vary. Although the sample sizes in individual categories are smaller and bear repeating in other datasets, the trend supports our in vitro findings (50). Our study identifies miR-146a as a potential target that may have value for altering the aggressiveness of p53 mutant basal-like tumors. Since miRs are relatively stable, resistant to RNase degradation and can be isolated and quantified precisely from tissue, they can be excellent biomarkers to identify a specific subtype, in this case basal-like breast cancers with p53 pathway defects. Targeting miR-146a using anti-sense nucleotides (or other modalities currently being developed to modulate the expression of microRNAs) may provide a way of targeting aggressiveness of these basal-like breast cancers. However, it is imperative that miRNA-based treatments are selective and accurate in target delivery in order for them to be therapeutically effective as well as to prevent off-target effects and toxicity. Further studies should address how modulation of miR-146a levels may affect drug response and other biological processes.
Supplementary material
Supplementary Tables 1 and 2 and Figures 1–4 can be found at http://carcin.oxfordjournals.org/
Funding
The authors gratefully acknowledge the support of the NCI/National Institutes of Environmental Health Sciences (NIEHS) Breast Cancer and the Environment Research Program (BCERP) (U01-ES-019472 and U01-CA-179715).
Conflict of Interest Statement: None declared.
Supplementary Material
Glossary
Abbreviations:
- KD
knockdown
- PDT
population doubling time
- SAM
Significance Analysis of Microarray
- TCGA
The Cancer Genome Atlas
- TNF
tumor necrosis factor
- WT
wild-type.
References
- 1. Forbes S.A., et al. (2011). COSMIC: mining complete cancer genomes in the Catalogue of Somatic Mutations in Cancer. Nucleic Acids Res., 39(Database issue), D945–D950. [DOI] [PMC free article] [PubMed] [Google Scholar]
- 2. Børresen-Dale A.L. (2003). TP53 and breast cancer. Hum. Mutat., 21, 292–300. [DOI] [PubMed] [Google Scholar]
- 3. Koboldt,D.C. et al. (2012) Comprehensive molecular portraits of human breast tumours. Nature, 490, 61–70. [DOI] [PMC free article] [PubMed] [Google Scholar]
- 4. Carey L.A., et al. (2006). Race, breast cancer subtypes, and survival in the Carolina Breast Cancer Study. JAMA, 295, 2492–2502. [DOI] [PubMed] [Google Scholar]
- 5. Troester M.A., et al. (2006). Gene expression patterns associated with p53 status in breast cancer. BMC Cancer, 6, 276. [DOI] [PMC free article] [PubMed] [Google Scholar]
- 6. Sørlie T., et al. (2001). Gene expression patterns of breast carcinomas distinguish tumor subclasses with clinical implications. Proc. Natl Acad. Sci. USA, 98, 10869–10874. [DOI] [PMC free article] [PubMed] [Google Scholar]
- 7. Langerød A., et al. (2007). TP53 mutation status and gene expression profiles are powerful prognostic markers of breast cancer. Breast Cancer Res., 9, R30. [DOI] [PMC free article] [PubMed] [Google Scholar]
- 8. Dumay A., et al. (2013). Distinct tumor protein p53 mutants in breast cancer subgroups. Int. J. Cancer, 132, 1227–1231. [DOI] [PubMed] [Google Scholar]
- 9. Olivier M., et al. (2006). The clinical value of somatic TP53 gene mutations in 1,794 patients with breast cancer. Clin. Cancer Res., 12, 1157–1167. [DOI] [PubMed] [Google Scholar]
- 10. Troester M.A., et al. (2004). Cell-type-specific responses to chemotherapeutics in breast cancer. Cancer Res., 64, 4218–4226. [DOI] [PubMed] [Google Scholar]
- 11. Suzuki H.I., et al. (2009). Modulation of microRNA processing by p53. Nature, 460, 529–533. [DOI] [PubMed] [Google Scholar]
- 12. Bartel D.P. (2004). MicroRNAs: genomics, biogenesis, mechanism, and function. Cell, 116, 281–297. [DOI] [PubMed] [Google Scholar]
- 13. Miska E.A. (2005). How microRNAs control cell division, differentiation and death. Curr. Opin. Genet. Dev., 15, 563–568. [DOI] [PubMed] [Google Scholar]
- 14. Iorio M.V., et al. (2005). MicroRNA gene expression deregulation in human breast cancer. Cancer Res., 65, 7065–7070. [DOI] [PubMed] [Google Scholar]
- 15. Chang T.C., et al. (2007). Transactivation of miR-34a by p53 broadly influences gene expression and promotes apoptosis. Mol. Cell, 26, 745–752. [DOI] [PMC free article] [PubMed] [Google Scholar]
- 16. Corney D.C., et al. (2007). MicroRNA-34b and MicroRNA-34c are targets of p53 and cooperate in control of cell proliferation and adhesion-independent growth. Cancer Res., 67, 8433–8438. [DOI] [PubMed] [Google Scholar]
- 17. Sachdeva M., et al. (2009). p53 represses c-Myc through induction of the tumor suppressor miR-145. Proc. Natl Acad. Sci. USA, 106, 3207–3212. [DOI] [PMC free article] [PubMed] [Google Scholar]
- 18. Yamakuchi M., et al. (2010). P53-induced microRNA-107 inhibits HIF-1 and tumor angiogenesis. Proc. Natl Acad. Sci. USA, 107, 6334–6339. [DOI] [PMC free article] [PubMed] [Google Scholar]
- 19. Georges S.A., et al. (2008). Coordinated regulation of cell cycle transcripts by p53-Inducible microRNAs, miR-192 and miR-215. Cancer Res., 68, 10105–10112. [DOI] [PubMed] [Google Scholar]
- 20. Hu W., et al. (2010). Negative regulation of tumor suppressor p53 by microRNA miR-504. Mol. Cell, 38, 689–699. [DOI] [PMC free article] [PubMed] [Google Scholar]
- 21. Le M.T., et al. (2009). MicroRNA-125b is a novel negative regulator of p53. Genes Dev., 23, 862–876. [DOI] [PMC free article] [PubMed] [Google Scholar]
- 22. Park S.Y., et al. (2009). miR-29 miRNAs activate p53 by targeting p85 alpha and CDC42. Nat. Struct. Mol. Biol., 16, 23–29. [DOI] [PubMed] [Google Scholar]
- 23. Yamakuchi M., et al. (2008). miR-34a repression of SIRT1 regulates apoptosis. Proc. Natl Acad. Sci. USA, 105, 13421–13426. [DOI] [PMC free article] [PubMed] [Google Scholar]
- 24. Fornari F., et al. (2009). MiR-122/cyclin G1 interaction modulates p53 activity and affects doxorubicin sensitivity of human hepatocarcinoma cells. Cancer Res., 69, 5761–5767. [DOI] [PubMed] [Google Scholar]
- 25. Ghose J., et al. (2011). Regulation of miR-146a by RelA/NFkB and p53 in STHdh(Q111)/Hdh(Q111) cells, a cell model of Huntington’s disease. PLoS One, 6, e23837. [DOI] [PMC free article] [PubMed] [Google Scholar]
- 26. Blenkiron C., et al. (2007). MicroRNA expression profiling of human breast cancer identifies new markers of tumor subtype. Genome Biol., 8, R214. [DOI] [PMC free article] [PubMed] [Google Scholar]
- 27. Abboud E.R., et al. (2007). Integrin-linked kinase: a hypoxia-induced anti-apoptotic factor exploited by cancer cells. Int. J. Oncol., 30, 113–122. [PubMed] [Google Scholar]
- 28. Kucharczak J., et al. (2003). To be, or not to be: NF-kappaB is the answer–role of Rel/NF-kappaB in the regulation of apoptosis. Oncogene, 22, 8961–8982. [DOI] [PubMed] [Google Scholar]
- 29. Bhaumik D., et al. (2008). Expression of microRNA-146 suppresses NF-kappaB activity with reduction of metastatic potential in breast cancer cells. Oncogene, 27, 5643–5647. [DOI] [PMC free article] [PubMed] [Google Scholar]
- 30. Taganov K.D., et al. (2006). NF-kappaB-dependent induction of microRNA miR-146, an inhibitor targeted to signaling proteins of innate immune responses. Proc. Natl Acad. Sci. USA, 103, 12481–12486. [DOI] [PMC free article] [PubMed] [Google Scholar]
- 31. Ikner A., et al. (2011). TWEAK induces apoptosis through a death-signaling complex comprising receptor-interacting protein 1 (RIP1), Fas-associated death domain (FADD), and caspase-8. J. Biol. Chem., 286, 21546–21554. [DOI] [PMC free article] [PubMed] [Google Scholar]
- 32. Hollstein M., et al. (1994). Database of p53 gene somatic mutations in human tumors and cell lines. Nucleic Acids Res., 22, 3551–3555. [PMC free article] [PubMed] [Google Scholar]
- 33. Soussi T., et al. (2005). Reassessment of the TP53 mutation database in human disease by data mining with a library of TP53 missense mutations. Hum. Mutat., 25, 6–17. [DOI] [PubMed] [Google Scholar]
- 34. Carey L.A., et al. (2007). The triple negative paradox: primary tumor chemosensitivity of breast cancer subtypes. Clin. Cancer Res., 13, 2329–2334. [DOI] [PubMed] [Google Scholar]
- 35. Sorlie T., et al. (2003). Repeated observation of breast tumor subtypes in independent gene expression data sets. Proc. Natl Acad. Sci. USA, 100, 8418–8423. [DOI] [PMC free article] [PubMed] [Google Scholar]
- 36. Mouchawar J., et al. (2010). Population-based estimate of the contribution of TP53 mutations to subgroups of early-onset breast cancer: Australian Breast Cancer Family Study. Cancer Res., 70, 4795–4800. [DOI] [PMC free article] [PubMed] [Google Scholar]
- 37. Ponomarev E.D., et al. (2013). MicroRNAs are universal regulators of differentiation, activation, and polarization of microglia and macrophages in normal and diseased CNS. Glia, 61, 91–103. [DOI] [PMC free article] [PubMed] [Google Scholar]
- 38. Perkins N.D., et al. (2006). Good cop, bad cop: the different faces of NF-kappaB. Cell Death Differ., 13, 759–772. [DOI] [PubMed] [Google Scholar]
- 39. Dvinge H., et al. (2013). The shaping and functional consequences of the microRNA landscape in breast cancer. Nature, 497, 378–382. [DOI] [PubMed] [Google Scholar]
- 40. Liu X., et al. (2009). MicroRNA-146a modulates human bronchial epithelial cell survival in response to the cytokine-induced apoptosis. Biochem. Biophys. Res. Commun., 380, 177–182. [DOI] [PubMed] [Google Scholar]
- 41. Shen J., et al. (2008). A functional polymorphism in the miR-146a gene and age of familial breast/ovarian cancer diagnosis. Carcinogenesis, 29, 1963–1966. [DOI] [PubMed] [Google Scholar]
- 42. Garcia A.I., et al. (2011). Down-regulation of BRCA1 expression by miR-146a and miR-146b-5p in triple negative sporadic breast cancers. EMBO Mol. Med., 3, 279–290. [DOI] [PMC free article] [PubMed] [Google Scholar]
- 43. Elstrodt F., et al. (2006). BRCA1 mutation analysis of 41 human breast cancer cell lines reveals three new deleterious mutants. Cancer Res., 66, 41–45. [DOI] [PubMed] [Google Scholar]
- 44. Luo D., et al. (2013). A systematic evaluation of miRNA:mRNA interactions involved in the migration and invasion of breast cancer cells. J. Transl. Med., 11, 57. [DOI] [PMC free article] [PubMed] [Google Scholar]
- 45. Wang X., et al. (2008). Aberrant expression of oncogenic and tumor-suppressive microRNAs in cervical cancer is required for cancer cell growth. PLoS One, 3, e2557. [DOI] [PMC free article] [PubMed] [Google Scholar]
- 46. Pacifico F., et al. (2010). Nuclear factor-{kappa}B contributes to anaplastic thyroid carcinomas through up-regulation of miR-146a. J. Clin. Endocrinol. Metab., 95, 1421–1430. [DOI] [PubMed] [Google Scholar]
- 47. Li Y., et al. (2010). miR-146a suppresses invasion of pancreatic cancer cells. Cancer Res., 70, 1486–1495. [DOI] [PMC free article] [PubMed] [Google Scholar]
- 48. Yao Q, et al. (2013). MicroRNA-146a acts as a metastasis suppressor in gastric cancer by targeting WASF2. Cancer Lett, 335, 219–224. [DOI] [PubMed] [Google Scholar]
- 49. Khoury M.P., et al. (2011). p53 isoforms: an intracellular microprocessor? Genes Cancer, 2, 453–465. [DOI] [PMC free article] [PubMed] [Google Scholar]
- 50. Soussi T., et al. (2001). Assessing TP53 status in human tumours to evaluate clinical outcome. Nat. Rev. Cancer, 1, 233–240. [DOI] [PubMed] [Google Scholar]
Associated Data
This section collects any data citations, data availability statements, or supplementary materials included in this article.